Market Overview
| Study Period | 2020 - 2031 |
|---|---|
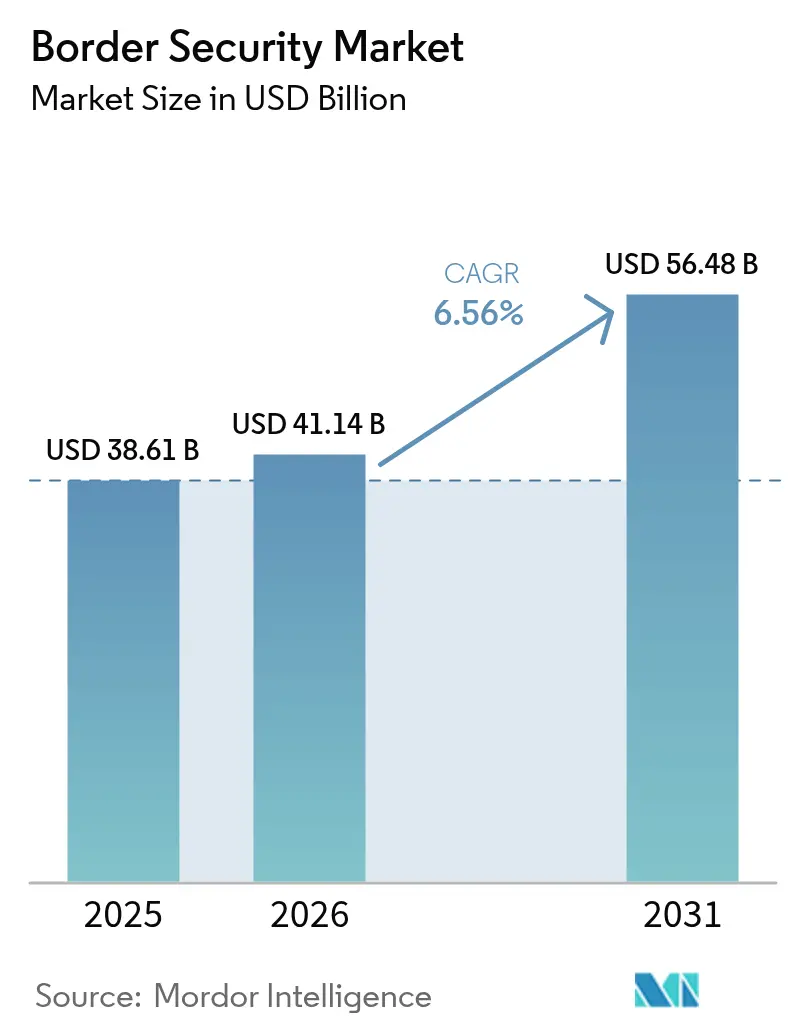
| Market Size (2026) | USD 41.14 Billion |
| Market Size (2031) | USD 56.48 Billion |
| Growth Rate (2026 - 2031) | 6.56% CAGR |
| Fastest Growing Market | Asia Pacific |
| Largest Market | North America |
| Market Concentration | Medium |
Major Players *Disclaimer: Major Players sorted in no particular order Image © Mordor Intelligence. Reuse requires attribution under CC BY 4.0. | |
Border Security Market Analysis by Mordor Intelligence
The border security market size was valued at USD 38.61 billion in 2025 and estimated to grow from USD 41.14 billion in 2026 to reach USD 56.48 billion by 2031, at a CAGR of 6.56% during the forecast period (2026-2031). This expansion is supported by a surge in sovereign investments prioritizing autonomous surveillance, AI-enabled perimeter analytics, and integrated command platforms. Governments are directing larger portions of defense budgets to smart-border modernization. At the same time, persistent cartel drone incursions and hybrid warfare tactics force agencies to adopt layered aerial and ground sensor networks. Integrators that fuse radar, optical, biometric, and acoustic feeds onto a single decision dashboard are gaining traction, and agile vendors that can certify systems under strict export-control frameworks are carving out niche positions. These dynamics collectively reinforce the long-term growth runway of the border security market.[1]Source: DHS Office of Procurement Operations, “Forecast Record | Acquisition Planning Forecast System,” APFS-CLOUD.DHS.GOV
Key Report Takeaways
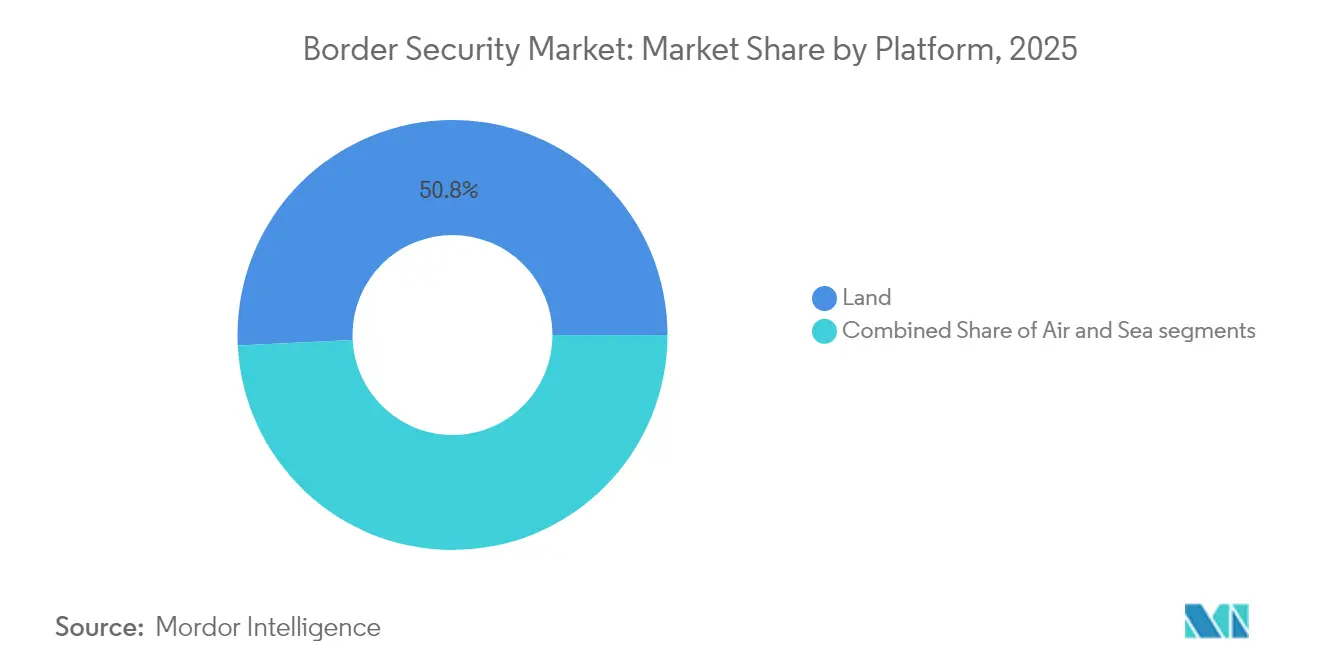
- By platform, land systems led the border security market with 50.78% of the share in 2025. Air-based systems are projected to post an 8.41% CAGR through 2031.
- By vertical, military applications commanded 60.15% of the border security market size in 2025; homeland security is forecasted to advance at an 8.12% CAGR through 2031.
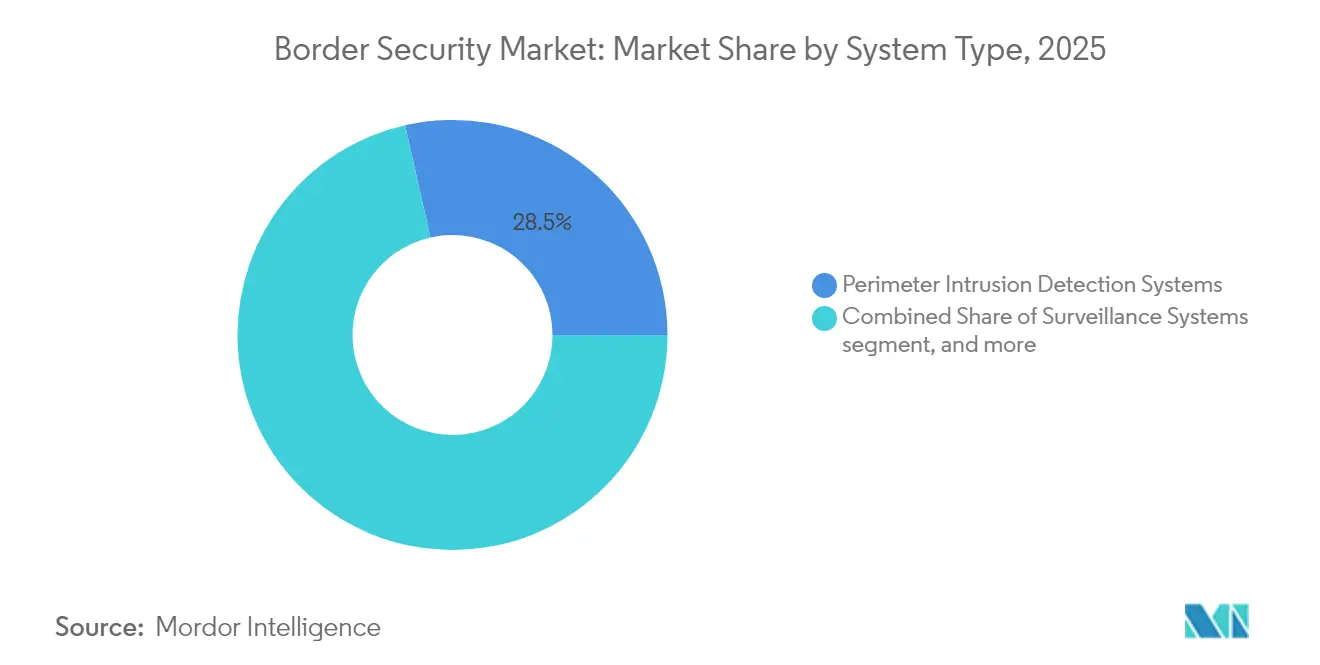
- By system type, perimeter intrusion detection systems held a 28.54% share in 2025; counter-UAS solutions are expected to grow at an 10.92% CAGR from 2026 to 2031.
- By installation, new deployments represented a 65.10% share in 2025. System upgrades are projected to expand at a 7.74% CAGR through 2031.
- By geography, North America captured a 41.05% share in 2025, and Asia-Pacific is set to record the quickest 8.44% CAGR up to 2031.
Note: Market size and forecast figures in this report are generated using Mordor Intelligence’s proprietary estimation framework, updated with the latest available data and insights as of 2026.
Global Border Security Market Trends and Insights
Drivers Impact Analysis*
| Driver | (~)% Impact on CAGR Forecast | Geographic Relevance | Impact Timeline |
|---|---|---|---|
| Escalating cross-border terrorism and illegal immigration | +1.8% | North America, EU | Short term (≤ 2 years) |
| Government modernization budgets for smart borders | +1.5% | North America, EU, APAC | Medium term (2-4 years) |
| AI-enabled perimeter intrusion and video analytics adoption | +1.2% | Global | Medium term (2-4 years) |
| Autonomous unmanned patrol platforms (UAV/UGV/USV) | +1.0% | North America, EU, Middle East | Long term (≥ 4 years) |
| Edge-AI biometric kiosks at secondary crossings | +0.8% | APAC, MEA | Medium term (2-4 years) |
| Supply-chain security mandates widening customs spend | +0.6% | Global | Long term (≥ 4 years) |
| Source: Mordor Intelligence | |||
Escalating cross-border terrorism and illegal immigration
Cartel groups executed more than 60,000 drone sorties along the US-Mexico frontier within six months, eclipsing sortie rates in several active conflict zones and exposing the limitations of legacy ground sensors.[2]Source: U.S. Immigration and Customs Enforcement, “Drone Incursion Briefing,” ICE.GOV The European Union (EU) responded with a 3,000-kilometer “drone wall” stretching from Norway to Poland, underpinned by multi-billion-euro AI reconnaissance investments led by Germany.[3]Source: du Fretay Halna, “NATO Moves Forward with Deployment of Drone Wall on Eastern Flank,” ARMYRECOGNITION.COM Estonia committed EUR 12 million (USD 14.08 million) to the project, and Poland broke ground on 700 kilometers of fortified surveillance infrastructure. Real-time fusion of radar, electro-optical, and RF feeds is now mandatory for agencies that track small, fast unmanned aerial systems (UAS) in contested GPS environments. Vendors that deliver open-architecture command platforms capable of ingesting diverse sensor streams are best positioned to capture the next wave of border security market demand.
Government modernization budgets for smart borders
The US Department of Homeland Security (DHS) lifted Border Security Thrust Area funding to USD 100.5 million in FY2025, a 21% jump versus FY2023 allocations. Canada’s USD 1.3 billion Border Plan earmarks USD 667.5 million for the RCMP and USD 355.4 million for CBSA, signaling steady North American coordination. In Europe, the SAFE loan facility offers EUR 150 billion (USD 176.03 billion) for joint procurement, while the Stability and Growth Pact escape clauses permit EUR 650 billion (USD 762.67 billion) of additional defense outlays over four years. National targets, such as Germany’s pledge to spend 3.5% of GDP on defense by 2029, sustain a multiyear pipeline of projects. Streamlined acquisition reforms shorten award cycles for AI-native solutions, giving the border security market fresh momentum.
AI-enabled perimeter intrusion and video analytics adoption
DHS’s AI strategy mandates automated detection across surveillance grids; CBP now deploys software that flags millisecond-scale pixel changes to track micro-UAS, mortars, and stealth incursions. VisionWave’s event-based radar demonstrated detection of supersonic projectiles in Abu Dhabi trials, creating commercial interest in AI-powered active protection systems. BigBear.ai and DEFCON AI model contested logistics to improve sustainment at the Southwest border. Edge processors placed at secondary crossings cut latency by handling classification on-site, meeting real-time interdiction needs where backhaul bandwidth is scarce. These capabilities realign procurement criteria toward software-centric platforms that deliver tactical insights without relying on distant cloud nodes.
Autonomous unmanned patrol platforms
The White House Executive Order titled “Unleashing American Drone Dominance” obliges agencies to prefer domestically built drones, an edict bolstered by US Department of Defense (DoD) funding that sets aside USD 10.1 billion in FY2025 for unmanned programs. Poland’s USD 1.2 billion aerostat package awarded to Raytheon and partners illustrates escalating European appetite for persistent airborne sensors. Quantum Systems’ Vector and Trinity Pro UAVs, produced at a rate of several hundred per month, feed NATO’s eastern drone wall with endurance platforms that can loiter over borders for hours. Coordinated swarms of unmanned aerial vehicle (UAV), unmanned ground vehicle (UGV), and unmanned surface vehicle (USV) assets extend situational awareness well beyond human sightlines, shaping future specifications within the border security market.
Restraints Impact Analysis*
| Restraint | (~)% Impact on CAGR Forecast | Geographic Relevance | Impact Timeline |
|---|---|---|---|
| High capex and long procurement cycles | -1.2% | Global government sectors | Medium term (2-4 years) |
| Privacy and civil-liberty pushback on biometrics | -0.8% | EU, North America, APAC | Short term (≤ 2 years) |
| RF spectrum congestion near dense borders | -0.6% | Congested crossings | Long term (≥ 4 years) |
| Export-control constraints on equipment sourcing | -0.4% | International markets | Long term (≥ 4 years) |
| Source: Mordor Intelligence | |||
High capex and long procurement cycles
Teledyne FLIR’s USD 74.2 million Coast Guard order illustrates the five-year delivery timelines typical for multi-sensor suites. Large programs require security clearances, integration tests, and consolidated funding lines that can delay fielding by up to two years. EU reforms raise value thresholds to fast-track small contracts, yet big integrated systems still face lengthy review. Such delays can slow upgrades just as threats evolve, muting short-term uptake, yet proven incumbents often benefit from the technical rigor embedded in protracted cycles.
Privacy and civil-liberty pushback on biometrics
DHS attempts to expand biometric exit rules, but meets resistance from advocacy groups. At the same time, EU regulators temper the rollout of advanced face and DNA checks until strict safeguards are in place. Requirements for explicit consent, data minimization, and audit trails raise solution costs and curb fully automated identity management. Vendors respond with privacy-preserving templates and decentralized wallets, but the compliance burden can stall near-term deployments in the border security market.
*Our forecasts treat driver/restraint impacts as directional, not additive. The impact forecasts reflect baseline growth, mix effects, and variable interactions.
Segment Analysis
By Platform: Layered land-air synergy strengthens situational awareness
Land systems anchored 50.78% of the border security market share in 2025, confirming that fences, fixed towers, and command posts remain indispensable to day-to-day perimeter control. Ground infrastructure houses radar masts, fiber links, and energy supplies that sustain wide-area sensor grids. Air platforms, however, register an 8.41% CAGR through 2031 as agencies turn to long-endurance UAVs and aerostats that stretch coverage beyond line-of-sight (BLOS). The border security market size tied to air platforms is projected to grow from a single-digit baseline to high-teens billions by decade’s end, mirroring the uptick in drone-borne incursions that must be countered at altitude. Seamless data fusion between tower radars and airborne ISR assets boosts detection probability and trims false alarms. Vendors winning new contracts offer open APIs so that aerostat feeds, unattended ground sensors, and mobile command trucks can interoperate without middleware rewrites.
Ground modernization programs extend utility through hybrid power supplies and self-healing mesh networks, maintaining uptime in harsh environments. Poland’s Shield-East fortifications blend traditional walls with radar-equipped towers and drone interceptors, showing how hard-scape barriers and smart sensors now co-exist. In parallel, Estonia leverages compact UAV swarms to patrol forested terrain where ground lines of sight are poor. This multipronged doctrine keeps the border security market aligned with varied topographies, from deserts to mountains to river boundaries.


By Vertical: Civilian uptake narrows the military gap
Military missions captured 60.15% of the border security market size in 2025, reflecting legacy budgets and battlefield-tested solutions adapted for sovereign frontiers. Homeland security agencies close the gap with an 8.12% CAGR, propelled by specialized immigration, customs, and public-safety mandates. Civilian operators now demand defense-grade optics, encrypted links, and AI analytics to spot illicit crossings, placing them on par with army doctrine for persistent surveillance. Procurement officers focus on modular payloads that let the same sensor cage switch from militant detection to narcotics interdiction without hardware swaps. As budgets converge, suppliers must meet MIL-STD survivability while passing privacy audits unique to civilian jurisdictions. Dual-use architectures that can be toggled between lethal and non-lethal modes make inroads, minimizing training curves and maximizing asset utilization within the broader border security market.
Civil agencies pursue quick-turn pilot projects, often ordering ten-to-twenty drone kits at a time, then scaling once proof of value is shown. Military buyers, by contrast, sign multi-year IDIQ contracts covering hundreds of platforms. Companies adept at small-batch rapid deliveries secure early civilian footholds that can evolve into larger follow-on awards, gradually diluting the historical military share dominance.
By System Type: Counter-UAS demand reshapes procurement priorities
Perimeter intrusion detection systems held 28.54% of the border security market share in 2025, yet counter-UAS solutions now exhibit the fastest trajectory at 10.92% CAGR. Drone attacks on critical crossings expose how legacy ground sensors cannot always detect low-altitude, low-RCS threats. Australian EOS Apollo lasers slash per intercept cost USD 1 per shot, undercutting missile-based systems that can run USD 500,000 per intercept. Agencies prioritize systems that map RF, radar, acoustic, and electro-optical detections into a standard threat matrix, triggering automatic jamming, take-over, or kinetic neutralization. The border security market size allocated to counter-UAS is set to double before 2030 as swivel-turret lasers, smart nets, and directed energy weapons become field-ready. Interoperability is mandatory: vendors must show that UAS data feeds populate central C2 dashboards alongside legacy ground sensors. Operators favor flexible rules-of-engagement logic that can shift from warning to disable commands under real-time legal guidance.
At the same time, classic intrusion systems evolve with fiber-optic acoustic cables, seismic arrays, and AI image analytics that lower nuisance alarms. This iterative enhancement protects their incumbency even as funds migrate to aerial threat defense.
By Installation: New projects dominate, upgrades surge
New builds represented 65.10% of deployments in 2025, driven by states that lacked holistic coverage. Frontex and NATO grants finance greenfield sites across Eastern Europe, while Gulf nations install integrated land-sea systems. The upgrade subsegment advances at 7.74% CAGR as aging towers, cameras, and radar stacks swap in AI chips and hardened cybersecurity overlays. Agencies weigh incremental retrofits against wholesale replacement to stretch budgets. Teledyne FLIR’s rolling deliveries illustrate how modular sensor pods can refresh legacy rotorcraft without grounding fleets.
Cloud-delivered analytics enable step-change performance gains without new hardware, but some actors still require on-premise compute for classified data. Suppliers that package software licenses with phased hardware refresh schedules capture recurring revenue streams and move the border security market toward subscription models. Lifecycle contracts covering maintenance, spares, and firmware assure continuous capability lift.
Geography Analysis
North America remains the largest revenue contributor, bolstered by the One Big Beautiful Act’s USD 150 billion defense increment that funnels fresh capital into high-fidelity sensors, AI fusion nodes, and autonomous patrol kits. US Immigration and Customs Enforcement expanded its investigative analytics suite with a USD 30 million task order to Palantir, demonstrating continued appetite for data-centric tools. Canada’s Border Plan synchronizes land, air, and maritime upgrades, creating cross-border interoperability that enhances situational awareness without duplicating assets. The region relies on established ITAR frameworks to safeguard sensitive IP, ensuring domestic primes maintain a competitive edge within the border security market.
Asia-Pacific posts the fastest compounded growth through 2031, reflecting dual imperatives of economic corridor protection and high-profile event security. Dubai’s six-second biometric corridor showcases how sovereign wealth accelerates technology rollouts. Saudi Arabia’s enormous AI fund injects liquidity into local startups aiming to indigenize edge analytics. India’s exports of Kaala Bhairav combat UAVs prove regional firms can capture international orders, widening supplier diversity. Diverse regulatory landscapes compel vendors to localize encryption, language processing, and data-sovereignty features, adding complexity and generating bespoke integration revenues.
Europe’s security calculus changed with the initiation of the 3,000-kilometer drone wall. Germany’s commitment to spend 3.5% of GDP on defense by 2029 secures multi-year project pipelines. EU joint-procurement rules mandate 65% local content, steering contracts toward suppliers with European manufacturing. GDPR continues to shape system architectures by demanding privacy-by-design protocols. Baltic states fast-track mobile radar deployments that plug surveillance blind spots while awaiting larger drone wall segments. These initiatives sustain robust, if moderately paced, growth in the border security market.


Regulatory Landscape
Border security procurement is being shaped by tighter interoperability and biometric-governance rules in Europe, alongside capability-driven acquisition policy in the United States. In the EU, Regulation (EU) 2024/1356 introduced mandatory screening procedures at external borders for third-country nationals, pushing Member States to integrate identification and risk assessment workflows into border processes. Interoperability requirements are being operationalized through eu-LISA programs, including the European Search Portal (ESP), for which Implementing Decision 2026/1155 set an operational start date of June 12, 2026, raising compliance expectations for vendors supplying identity, watchlist, and decision-support systems across the Schengen Area.
In the United States, DHS acquisition governance is moving toward faster adoption of adaptable commercial technology, with DHS Directive 102-01 (February 2026) establishing a commercial-first default for mission capabilities. Funding direction also reinforces performance and autonomy requirements: Public Law 119-98 (2026) provides USD 3.45 billion for CBP procurement, including nonintrusive inspection equipment, AI-driven surveillance, and autonomous border platforms, with spending authority through September 30, 2029. Parallel appropriations language constrains deployment of certain tower systems unless they meet CBP testing and acceptance for autonomous (AI/ML-enabled) capabilities, while international travel-document and biometric practices continue to align with ICAO TRIP guidance for MRTDs and biometric border control systems.
Value Chain Analysis
The border security value chain typically starts with sensor and compute component suppliers (radar, EO/IR cameras, acoustic and RF detection, biometrics, edge AI processors, and secure communications) feeding OEMs and subsystem vendors. Prime contractors and systems integrators then combine these elements into fixed and relocatable towers, mobile surveillance vehicles, counter-UAS suites, and command-and-control platforms, followed by accreditation, field integration, and sustainment. Recent US procurement illustrates this integrator-led model at scale: CBP awarded Anduril Industries a USD 363 million contract (June 2026) to deliver more than 200 Extended Range Sentry Towers (XRST), alongside tower and surveillance awards to General Dynamics Information Technology (including a USD 115 million delivery order in May 2026 and a USD 71 million task order in June 2026) and a mobile surveillance award to Teledyne FLIR Defense (USD 28.8 million in June 2026).
Downstream, deployment and lifecycle services (installation, network backhaul, cybersecurity hardening, spares, and software updates) support long-term revenue and help lock in vendor relationships through multi-year vehicles such as CBP’s Consolidated Tower and Surveillance Equipment (CTSE) IDIQ structure. Bottlenecks arise around specialized semiconductors and AI-compute hardware that can constrain tower and edge-analytics production schedules, while policy-driven requirements for autonomous capability and tested acceptance create qualification gates that favor vendors with proven field performance and validated integration with existing CBP tower networks. Interagency funding and operational support, including Department of Defense obligations for southern border operations since FY2025, further reinforce demand for integrated, rapidly deployable systems that can be sustained across diverse terrain and mission profiles.
Competitive Landscape
The border security market exhibits moderate concentration. Northrop Grumman Corporation, Thales Group, and Elbit Systems Ltd. maintain entrenched positions through legacy radar and missile franchises. RTX Corporation secured a USD 537 million SPY-6 radar order with options exceeding USD 2.89 billion, underlining incumbent reach. Yet AI-native challengers such as Palantir, VisionWave, and Ondas attract contracts focused on data fusion and autonomous drone fleets. L3Harris partnered with Palantir to merge AI analytics into manufacturing and test operations, illustrating how strategic alliances blur traditional hardware-software boundaries.
Investment inflows validate disruptor potential. Private-equity commitments into defense technology doubled to USD 13.8 billion during sweeping US drone legislation in 2025. European M&A climbed to USD 2.3 billion in H1 2025, reflecting buyers’ desire to consolidate sensor and C2 capabilities under one roof. Suppliers differentiate through secure supply chains and rapid cyber-patch cycles, essential as export-control regimes tighten. Low-cost directed-energy interceptors, exemplified by EOS Apollo, threaten the missile-centric economics of incumbents. Firms that bundle cost-disruptive hardware with certified data pipelines will likely win procurement skirmishes ahead.
Despite new entrants, buyers still value field-proven reliability; thus, mixed consortia frequently emerge, pairing legacy integrators with AI startups to balance risk and innovation. Procurement complexity and multi-year support needs lock in service revenues, prolonging vendor-client relationships and sustaining moderate market concentration.
Border Security Industry Leaders
Northrop Grumman Corporation
Thales Group
Lockheed Martin Corporation
BAE Systems plc
General Dynamics Corporation
- *Disclaimer: Major Players sorted in no particular order

Market Opportunities and Future Outlook
Whitespace remains most visible in integrated architectures that pair physical infrastructure with autonomous sensing, edge analytics, and rapid fielding through IDIQ contracting. The United States provides a clear example of this convergence through a reported USD 46 billion “smart wall” approach that blends 30-foot steel barriers with autonomous tower networks, ground sensors, and cameras, and by mid-June 2026, CBP had erected 74 miles of new wall under the current administration’s infrastructure expansion. Procurement activity around towers and mobility reinforces the buying pattern, with Anduril’s USD 363 million award for more than 200 XRST towers (June 2026), GDIT’s USD 71 million task order for Relocatable Autonomous Surveillance Towers under the CTSE contract, and Teledyne FLIR Defense’s USD 28.8 million mobile surveillance award for the eMSC-L program all pointing to ongoing demand for scalable, relocatable coverage where fixed infrastructure is difficult.
A second opportunity cluster is forming around counter-UAS and drone-defense integration within border surveillance grids, as agencies incorporate layered detection and defeat into perimeter operations rather than treating it as a stand-alone capability. For example, CACI announced SkyValor selection to strengthen drone defense at the Southern Border (July 2026), signaling continued procurement for detection, tracking, and defeat capabilities that can interoperate with tower and command platforms. In Europe, Schengen interoperability milestones such as the operational start of the European Search Portal (June 12, 2026) and ongoing eu-LISA interoperability activities expand demand for compliant identity, watchlist, and decision-support systems that connect biometric matching, screening, and cross-border data exchange within regulated safeguards.
Recent Industry Developments
- July 2026: CACI announced that its SkyValor drone defense capability was selected to strengthen drone defense at the Southern Border. The award highlights procurement momentum for counter-UAS capabilities that can be integrated into broader border surveillance architectures, not deployed as standalone point solutions.
- June 2026: General Dynamics Information Technology (GDIT) received a USD 71 million CBP task order under the USD 1.8 billion Consolidated Tower and Surveillance Equipment (CTSE) contract to deploy autonomous surveillance towers along the southern border. The award underscores CBP’s shift toward AI-enabled, automated detection and classification at the edge, supporting faster scaling through existing IDIQ structures.
- August 2025: IDEMIA Public Security and Sopra Steria delivered eu-LISA’s shared Biometric Matching System (sBMS) in Courbevoie, France. The delivery strengthens EU-wide biometric comparison capabilities for border security and migration management, raising interoperability and compliance requirements for identity systems deployed across the Schengen Area.


Research Methodology Framework and Report Scope
Market Definition and Coverage
For this study, the border security market is defined as spending on systems, equipment, and related integration used to detect, monitor, identify, and respond to threats across land borders, coastal and maritime borders, and air entry points.
Scope exclusions: This sizing does not include broader homeland security spending that is not tied to border protection activities (for example, city policing and general public safety programs).
Segmentation Overview
- By Platform
- Land
- Air
- Sea
- By Vertical
- Military
- Border Defense
- Surveillance and Reconnaissance
- Homeland Security
- Immigration Control
- Anti-Terrorism Operations
- Drug and Human Trafficking Prevention
- Military
- By System Type
- Perimeter Intrusion Detection Systems
- Surveillance Systems
- Detection System
- Command and Control (C2) Systems
- Counter-UAS and Anti-Drone Systems
- Others
- By Installation
- New Installation
- Upgradation
- By Geography
- North America
- United States
- Canada
- Mexico
- Europe
- United Kingdom
- France
- Germany
- Russia
- Rest of Europe
- Asia-Pacific
- China
- India
- Japan
- South Korea
- Rest of Asia-Pacific
- South America
- Brazil
- Rest of South America
- Middle East and Africa
- Middle East
- Saudi Arabia
- Israel
- United Arab Emirates
- Rest of Middle East
- Africa
- South Africa
- Rest of Africa
- Middle East
- North America
Data Sources, Market Sizing, and Validation
Desk Research
To set the base facts, we start with public budgets and procurement disclosures that show how border agencies allocate funds across surveillance, screening, and command infrastructure. Sources such as government budget documents, parliament or congressional committee briefs, customs and immigration portals, and national statistics offices help us understand spending direction and timing.
We also use defense and security policy releases, trade association publications, peer reviewed journals on border surveillance and sensing, and patent databases to map which technologies are being deployed and how quickly they are being adopted. Company annual reports, investor presentations, and reputable press are then used to cross check program awards, delivery schedules, and backlog commentary. In addition, we reference paid subscriptions for company financials and intelligence, patent lookups, and global contracts and tenders, which improves consistency when public disclosures are fragmented. These examples are not exhaustive, and many other public sources were used for data collection, validation, and clarification.
Primary Interviews and Surveys
Primary discussions were used to pressure test what gets counted as border security versus adjacent defense or policing spend, and to confirm typical replacement cycles for sensors, towers, vehicles, and command systems. Interviews and survey inputs were collected from solution providers, system integrators, component suppliers, and end users across APAC, EMEA, and the Americas, so regional procurement patterns and terrain driven requirements could be reflected directly in the model.
Distribution of primary research fieldwork respondents
| Company type | Respondent position | Region |
|---|---|---|
| Top tier: 30% | CXOs: 15% | APAC: 37% |
| Mid tier: 48% | Functional/Unit leaders: 29% | EMEA: 37% |
| Smaller Players: 22% | Managers: 56% | Americas: 26% |
Market-Sizing & Forecasting
Sizing starts with a top-down build where defense and homeland security outlays are reconstructed into a border security demand pool using program line items, procurement plans, and trade and mobility indicators that influence monitoring intensity. The total is then corroborated through selective bottom-up approximations, such as sampled contract values, typical system bill of materials logic, and price per deployment site checks, and it is adjusted when the two views do not reconcile cleanly.
Key inputs used in the model include border length and terrain mix (which drives tower and sensor density), passenger and cargo flows at key crossings, the share of budgets directed to surveillance and screening modernization, procurement cycle timing, and inflation and foreign exchange assumptions used for USD conversion. Because adoption can jump after policy changes or incident led funding, scenario analysis is applied around large program starts, and experts are asked to validate which scenario matches agency intent. When bottom-up reference points are missing for smaller countries, gaps are handled by using comparable country proxies based on border type, spending intensity per kilometer, and modernization stage.
Data Validation & Update Cycle
Model outputs are checked against independent signals, including public contract award totals, multi year budget deltas, and known deployment footprints that indicate how much equipment is being fielded. If a number appears unusually high or low, we recheck the conversion factors, remove double counting between platform and system costs, and then recontact selected experts to confirm what changed.
Before sign-off, results go through a multi step analyst review where assumptions, unit economics, and growth drivers are tested for internal consistency across regions. Reports are refreshed annually, and interim updates are made when material events occur, such as major budget shifts, new border programs, or changes in import restrictions. Right before delivery, a final pass is completed so clients receive the latest updated view.
Mordor Intelligence's Border Security Market Size Versus Other Published Estimates
Published market sizes for border security can vary a lot, even when the topic name looks the same, because different studies count different types of spending and they do not always use the same base year or currency timing. We see the biggest swings when service layers are included, when dual use defense assets are folded into border programs, and when forecasts assume faster or slower procurement execution.
Some published figures bundle a wider homeland security spend pool, including internal security and public safety programs that are not limited to border operations. In Mordor Intelligence, values are counted only when the spend is clearly linked to land, maritime, or air border surveillance, screening, identification, and command functions, which keeps the total tied to observable program budgets and awards.
Benchmark comparison
| Source | Market Size | Gaps in Research Methodology |
|---|---|---|
| Mordor Intelligence | USD 41.14 B (2026) | |
| Global Consultancy A | USD 53.52 B (2025) | Uses a broader solution and service framing that can capture adjacent internal security programs, and it starts from a different base year that can inflate the comparison when procurement timing is uneven. |
| Industry Publisher B | USD 38.90 B (2024) | Anchors the model on an earlier base year and may be more conservative on modernization ramp rates, which can understate the step changes seen when large multi year border programs move into procurement. |
Across the three values, the spread is mainly explained by what is treated as border specific spend, plus the base year chosen and how quickly contract pipelines are assumed to convert into delivered systems. By keeping the scope tied to border agency programs and then cross checking totals against budgets and award signals, the estimate stays traceable to practical inputs that can be reviewed and repeated.


Key Questions Answered in the Report
What is the 2026 global border security market size?
Spending reached USD 41.14 billion in 2026, reflecting record allocations to autonomous surveillance and AI-enabled threat-detection programs.
How fast is spending expected to grow through 2031?
Expenditures are projected to advance at a 6.56% CAGR, pushing total outlays to roughly USD 56.48 billion by 2031.
Which platform segment shows the strongest expansion?
Air-based systems lead on growth, registering an 8.41% CAGR as drones, aerostats and long-endurance UAV swarms extend coverage beyond fixed ground sensors.
Why are counter-UAS solutions in especially high demand?
Escalating cartel and militant drone incursions over 60,000 flights along the US–Mexico frontier in six months drive agencies to add low-cost directed-energy and RF takeover technologies that neutralize small aerial threats quickly.
Which geography is growing the quickest?
Asia-Pacific posts an 8.44% CAGR through 2031, fueled by the UAE’s USD 1.5 billion AI investment, Saudi Arabia’s USD 100 billion defense AI fund, and wider adoption of biometric e-gate corridors.
What two factors currently restrain large-scale deployments?
High upfront capital requirements with 18–24-month procurement cycles, and privacy-driven restrictions that slow adoption of wide-area biometric screening.
Page last updated on:


