Middle East Food Logistics Market Size and Share
Market Overview
| Study Period | 2020 - 2031 |
|---|---|
| Forecast Data Period | 2026 - 2031 |
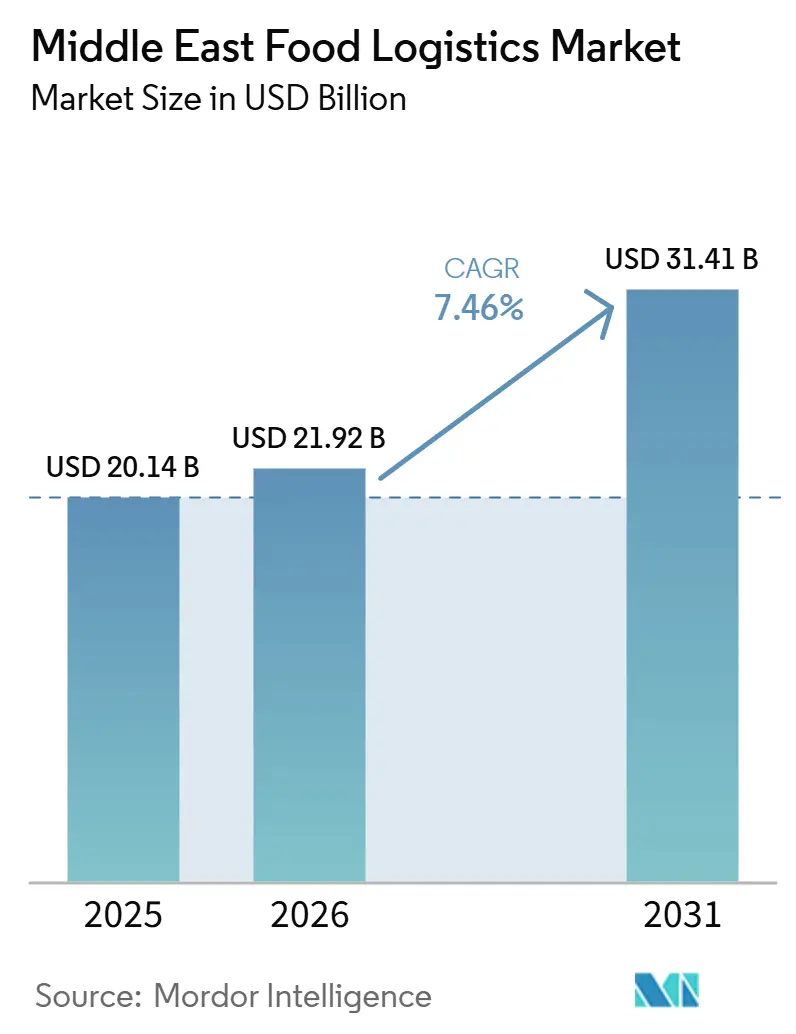
| Base Year Market Size (2025) | USD 20.14 Billion |
| Market Size (2026) | USD 21.92 Billion |
| Market Size (2031) | USD 31.41 Billion |
| Growth Rate (2026 - 2031) | 7.46% CAGR |
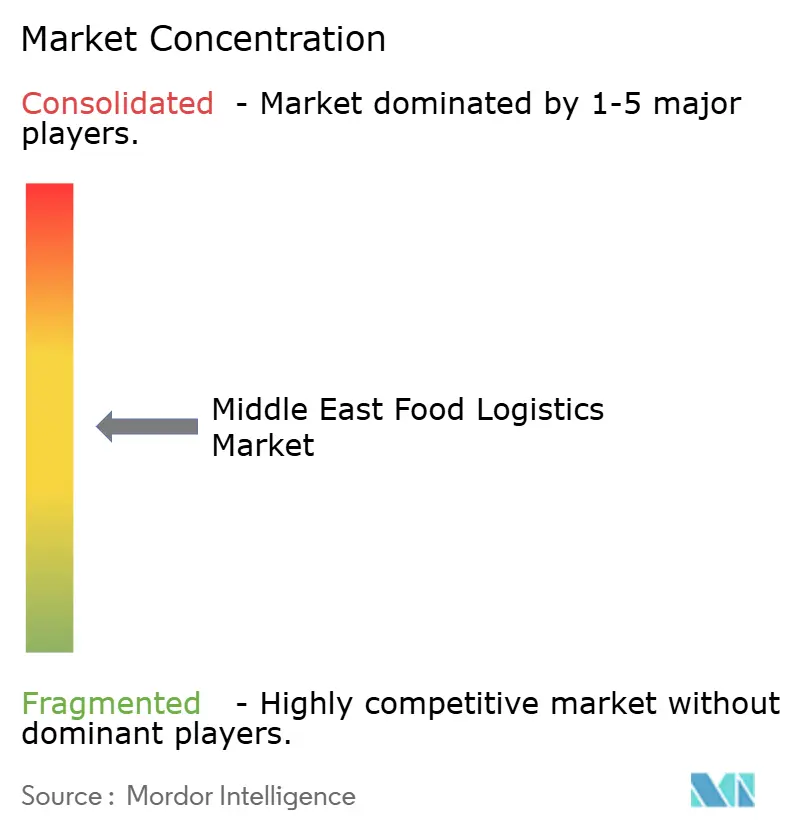
| Market Concentration | Medium |
Major Players *Disclaimer: Major Players sorted in no particular order Image © Mordor Intelligence. Reuse requires attribution under CC BY 4.0. | |
Middle East Food Logistics Market Analysis by Mordor Intelligence
The Middle East food logistics market size is projected to expand from USD 20.14 billion in 2025 and USD 21.92 billion in 2026 to USD 31.41 billion by 2031, registering a CAGR of 7.46% between 2026 to 2031.
Intensifying sovereign-backed food-security mandates are converting strategic stockpiling ambitions into hard-asset warehouse construction, while GCC-wide customs digitalization dismantles legacy border friction that once slowed perishable trade. Simultaneously, halal-tourism mega-projects and foreign direct investment in controlled-environment agriculture are reshaping demand, forcing providers to blend domestic harvest flows with international sourcing. Technology adoption from blockchain-enabled pre-clearance to solar-powered rural micro-cold rooms continues to compress spoilage rates and expand serviceable catchment areas, strengthening the commercial logic for integrated end-to-end solutions. On the downside, high urban land prices, fragmented food-safety codes, and refrigerant phase-out costs temper expansion by inflating the capital burden on operators.
Key Report Takeaways
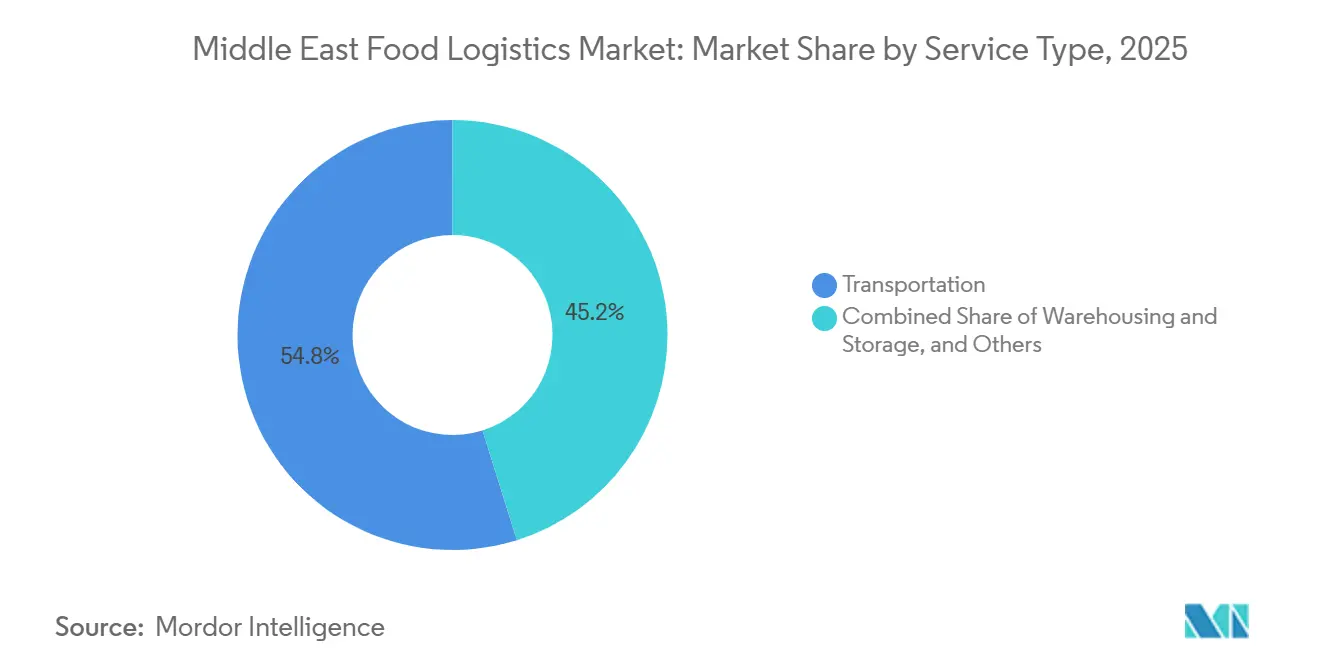
- By service type, transportation services led with 54.84% of the Middle East food logistics market share in 2025, value-added services are projected to expand at 10.03% CAGR through 2031, the fastest among service types.
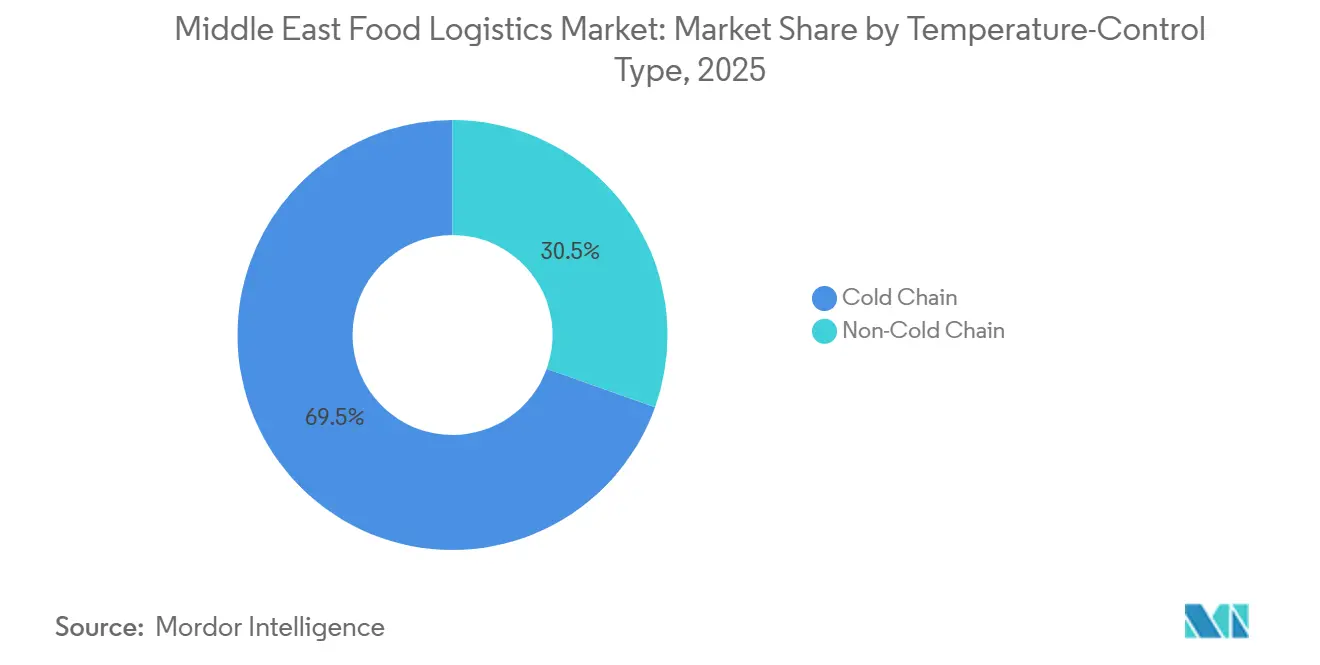
- By temperature control, cold-chain operations commanded 69.54% share of the Middle East food logistics market size in 2025, and are expected to grow at 8.89% CAGR through 2031.
- By end product category, dairy products and frozen desserts commanded 29.02% share of the Middle East food logistics market size in 2025, and pet food is expected to grow at 10.31% CAGR through 2031.
- By country, Saudi Arabia commanded 32.40% of the Middle East food logistics market size in 2025, while the United Arab Emirates is forecast to record the highest country-level CAGR at 9.42% between 2026-2031.
Note: Market size and forecast figures in this report are generated using Mordor Intelligence’s proprietary estimation framework, updated with the latest available data and insights as of January 2026.
Middle East Food Logistics Market Trends and Insights
Drivers Impact Analysis*
| Driver | (~) % Impact on CAGR Forecast | Geographic Relevance | Impact Timeline |
|---|---|---|---|
| Government-Led Food-Security Stockpiling Programs Expanding Regional Warehouse Capacity | +1.9% | GCC-wide, concentrated in Saudi Arabia & UAE | Long term (≥ 4 years) |
| GCC-Wide Customs Digitalization and Unified Tariff Schedules Accelerating Cross-Border Perishables Flows | +1.6% | Regional, the strongest impact on intra-GCC trade corridors | Medium term (2-4 years) |
| Surge in Halal Tourism and Hospitality Projects Demanding Premium Food-Service Logistics | +1.3% | UAE, Saudi Arabia, Qatar, with spillover to Oman | Medium term (2-4 years) |
| FDI-Backed Mega-Agri Clusters Requiring End-To-End Cold Chains | +1.2% | Saudi Arabia, UAE desert zones, and coastal aquaculture belts | Long term (≥ 4 years) |
| Roll-Out of Solar-Powered Micro-Cold Rooms Integrating Rural Producers into Modern Supply Chains | +0.8% | Rural hinterlands across GCC, pilot-stage in Egypt | Long term (≥ 4 years) |
| Smart-City Pilots Deploying Autonomous Temperature-Controlled Delivery Vehicles for Last-Mile Fulfillment | +0.7% | NEOM, Masdar City, Dubai South innovation zones | Long term (≥ 4 years) |
| Source: Mordor Intelligence | |||
Strategic Food-Security Stockpiling Programs Expanding Regional Warehouse Capacity
Governments are translating food-security rhetoric into multi-temperature storage construction, illustrated by Saudi Arabia’s grain reserve requirements that hold 12-months consumption equivalent and the UAE’s 85% self-sufficiency ambition. Long-term offtake agreements guarantee annuity-style revenues for operators but oblige sophisticated inventory-rotation systems to limit obsolescence. Stockpiling facilities increasingly integrate real-time IoT monitoring, ensuring visibility into reserve freshness and reducing waste. The programs accelerate professionalization of the Middle East food logistics market, crowding out smaller entrants unable to meet government audit thresholds. Over the long term, excess public-sector capacity is expected to bleed into commercial leasing, further tightening competitive pricing.
GCC Customs Digitalization and Unified Tariff Schedules Accelerating Cross-Border Perishable Flows
The GCC Common Customs Law and blockchain-enabled clearance platforms now shrink border dwell time from days to hours, materially lowering spoilage risk and freight cost per kilogram. Unified electronic phytosanitary and halal certificates standardize paperwork, empowering 3PLs to guarantee delivery windows while pooling inventory across multi-country hubs. Enhanced velocity positions the Middle East food logistics market as a seamless mega-corridor that rivals mature trade lanes in Europe and North America. The system further stimulates multimodal solutions, trucking from Jebel Ali to Riyadh or Muscat, now competes directly with short-sea transits on both speed and cost. However, operators face upfront integration costs to interface legacy TMS platforms with new government APIs[1]Gulf Cooperation Council, “GCC Common Customs Law,” gcc-sg.org.
Halal Tourism and Hospitality Projects Demanding Premium Food-Service Logistics
Mega-projects such as the Red Sea resorts and Dubai South’s Expo City require precise, halal-certified just-in-time deliveries of high-value ingredients to remote or highly regulated venues. These customers spur the adoption of predictive ordering tools and micro-fulfillment centers capable of pick-to-chef specifications. Premium hospitality clients pay service premiums of 20-30%, widening margins for providers that maintain dual-temperature vehicles and after-midnight delivery slots. Their stringent traceability needs cascade upstream, influencing vendor selection and driving broader compliance uplift across the Middle East food logistics market. Yet exposure to seasonality of tourism volumes obliges capacity-flexible contracts to preserve asset utilization in off-peak months.
FDI-Backed Mega-Agri Clusters Requiring End-to-End Cold Chains
Desert dairies, vertical farms, and aquaculture parks financed by Asian and European investors generate farm-to-fork transport demands previously absent in the region. Fresh milk, leafy greens, and finfish now travel domestically before re-exporting, adding reverse-logistics loops for feed, substrate, and packaging inputs. These clusters accelerate decentralization, forcing the Middle East food logistics market to overlay rural collection routes onto existing import-centric networks. Operators that master synchronized inbound and outbound flows capture efficiency gains, though they shoulder the capital costs of specialized milk tankers or live-fish haulers.
Restraints Impact Analysis*
| Restraint | (~) % Impact on CAGR Forecast | Geographic Relevance | Impact Timeline |
|---|---|---|---|
| Urban Cold-Storage Development Hampered by High Land Prices and Capital Intensity | -1.2% | Metropolitan cores: Dubai, Riyadh, Doha | Medium term (2-4 years) |
| Fragmented National Food-Safety Regulations Raising Multi-Country Compliance Costs | -0.9% | Cross-border operators serving multiple GCC states plus Egypt | Medium term (2-4 years) |
| Impending Phase-Out of High-GWP Refrigerants Crimping Availability of CO₂-Grade Retrofits for Reefers | -0.7% | Fleet operators across the region, in acute for legacy equipment owners | Short term (≤ 2 years) |
| Rising Cyber-Attacks on IoT-Linked Warehouses Disrupting Temperature Monitoring Systems | -0.5% | Technology-advanced facilities in the UAE, Saudi Arabia, Qatar | Short term (≤ 2 years) |
| Source: Mordor Intelligence | |||
Urban Cold-Storage Development Hampered by High Land Prices and Capital Intensity
Industrial plots near Jebel Ali or King Khalid Airport are priced 30-50% above ambient alternatives, translating into payback periods that exceed seven years, a hurdle for smaller firms. Debt-funding appetite tightens further because energy-efficient natural-refrigerant systems raise up-front costs while delivering savings only over time. Developers are experimenting with multilevel warehouses and automated pallet shuttles, but structural retrofits increase engineering complexity and insurance premiums. Consequently, capacity shortfalls manifest during Ramadan and Hajj peaks, forcing spot-rate spikes that ripple across the Middle East food logistics market. Consolidation ensues as well-capitalized institutional investors purchase distressed assets at discounts.
Fragmented National Food-Safety Regulations Raising Multi-Country Compliance Costs
Separate audit regimes by SFDA, UAE Food Safety Authority, and Kuwait Food Authority oblige logistics firms to maintain multiple HACCP playbooks, duplicate temperature records, and undergo redundant inspections. The absence of mutual recognition for halal certifiers multiplies documentation overhead and prolongs product hold times. Compliance outlays can erode 120–150 basis points of EBITDA for cross-border operators, a material drag in a margin-thin sector. Startups mitigate by geo-fencing service to one country, but that limits scale. Until officials advance harmonization, the restraint continues to moderate the Middle East food logistics market growth despite digital solutions easing some paperwork friction[2]Dubai Customs, “Blockchain Trade Platform,” dubaicustoms.gov.ae .
*Our forecasts treat driver/restraint impacts as directional, not additive. The impact forecasts reflect baseline growth, mix effects, and variable interactions.
Segment Analysis
By Service Type: Value-Added Services Capture Premium Growth
Transportation held 54.84% of the Middle East food logistics market share in 2025, anchored by road and short-sea corridors connecting import hubs with consumption centers. However, value-added services are on track for a blistering 10.03% CAGR, reflecting shippers’ pivot from pure haulage to bundled offerings that integrate blast-freezing, labeling, and customs documentation. As FMCG customers pursue SKU proliferation and channel diversification, they prize 3PLs capable of synchronizing production runs with e-commerce flash-sales, compressing order-to-delivery cycles to under 24 hours.
Margins in commoditized line-haul continue to tighten amid fuel-efficiency gains and telematics-driven route optimization, pushing incumbents toward ancillary revenue streams. Providers that meld advanced WMS with predictive analytics now monetize shelf-life management and returns processing. Consequently, the Middle East food logistics market size attributable to value-added functions is forecast to double its 2025 base by 2031, fortifying competitive moats for tech-savvy operators.


By Temperature-Control Type: Cold Chain Solidifies Market Leadership
Cold-chain activities accounted for 69.54% of the Middle East food logistics market share and are expanding at 8.89% CAGR as regulatory convergence around HACCP and halal traceability tightens service expectations. Frozen segments, meat, seafood, and ice cream dominate cubic-meter demand, yet chilled produce and dairy are registering faster uplift due to consumer shifts toward fresh convenience foods.
Energy-efficient natural-refrigerant installations reduce operating expense by up to 20%, offsetting electricity tariff volatility, but capital requirements stall adoption among SMEs. Ambient-controlled niches for confectionery and nutraceuticals emerge, enlarging the solution set that providers must master. As compliance and quality benchmarks rise, non-cold-chain service providers face eventual obsolescence, further concentrating revenue within the cold-chain subset of the Middle East food logistics market.
By End-Product Category: Pet Food Logistics Accelerates Amid Premiumization
Dairy products and frozen desserts commanded 29.02% of the Middle East food logistics market share, benefiting from entrenched dietary habits and upscale gelato parlors proliferating in tourist districts. Yet pet food, historically niche, now leads with a 10.31% CAGR as younger nuclear households humanize pets and demand refrigerated fresh diets over ambient kibble.
Protein categories, such as meat, seafood, and poultry, stay resilient, bolstered by population growth and halal certification that funnels imports through vetted cold-chain corridors. Horticulture logistics becomes more intricate with the advent of vertical farms, requiring high-frequency micro-shipments. Plant-based alternatives and cellular agriculture inch from pilot to limited commercial scale, inaugurating gnotobiotic transport protocols that only a handful of 3PLs in the Middle East food logistics market can deliver[3]Dubai Municipality, “Food Safety Guidelines,” dm.gov.ae .
Geography Analysis
Saudi Arabia retained 32.40% of regional spending in 2025 owing to Vision 2030 warehousing targets, a 12-month grain buffer, and its land-bridge that channels freight into Jordan and Egypt. NADEC’s desert dairies underscore logistical complexity, moving raw milk across 1,000 km routes under inhospitable ambient temperatures while maintaining a 4°C core, a feat enabled by high-end tanker insulation and live telemetry. Upcoming automated port facilities at NEOM further reinforce the Kingdom’s centrality.
The United Arab Emirates posts the fastest expansion at 9.42% CAGR through 2031. Jebel Ali Port’s 15 million TEU throughput, blockchain customs, and AED 945 million (USD 257 million) food-security infrastructure pipeline combine to cement hub status. Abu Dhabi’s agri-tech cluster seeds reverse-logistics flows for substrates and captured CO₂, while Dubai’s hospitality ecosystem forces hyper-responsive last-mile networks that elevate baseline service levels across the Middle East food logistics market[4]Emirates Development Bank, “Food Security Financing,” edb.gov.ae.
Qatar, Kuwait, Oman, and Bahrain serve as growth satellites. Qatar leverages post-World-Cup facilities for event-driven spikes; Kuwait adjusts service fees to nudge digitization; Oman’s seafood exports ride new reefer lanes to Asia; Bahrain deploys finance-backed cold-store solutions for niche pharma and gourmet imports. Egypt, though outside the GCC, anchors Red Sea vegetable exports into Gulf consumers, stitching the broader regional tapestry.
Competitive Landscape
Competitive intensity is moderate with global integrators DHL and CEVA jostling regional specialists like Bahri Logistics and NAQEL Express. Asset-heavy giants deploy automated mega-hubs near port gateways, harvesting scale economies and enticing multinational FMCGs seeking single-invoice solutions. Conversely, asset-light orchestrators exploit cloud platforms to bundle third-party capacity, granting shippers elasticity during Ramadan or tourism peaks.
Technology now defines leadership in the Middle East food logistics market. Machine-learning route planning slashes empty-run kilometers; IoT pallets deliver item-level track-and-trace; and blockchain ledgers satisfy halal auditors. Early movers enjoy a 2-3 percentage-point margin premium over laggards. Venture funding backs startups offering SaaS TMS and robotic micro-fulfillment, pressuring incumbents to accelerate digital roadmaps.
Regulatory dynamics favor well-capitalized players. Phase-down of high-GWP refrigerants raises retrofit capital that small fleets struggle to absorb, accelerating M&A. Food-safety agencies tighten audit frequency, effectively raising the bar of market entry. The resultant shakeout is expected to lift the combined top-five share to near 45% by 2031, subtly shifting the Middle East food logistics market toward oligopolistic characteristics.
Middle East Food Logistics Industry Leaders
CMA CGM
ADQ
DSV
Al-Futtaim Logistics
DHL Group
- *Disclaimer: Major Players sorted in no particular order

Recent Industry Developments
- January 2026: CEVA Logistics opened a new 23,000 m² multi-user eCommerce warehouse in Dubai South Free Zone (UAE) to bolster contract logistics and support regional fulfillment demand.
- December 2025: DHL Supply Chain opened a next-gen Innovation Center and announced a EUR 120 million (USD 140.6 million) investment in a 55,000 m² multi-user warehouse in Dubai South, UAE, to strengthen Middle East logistics capabilities and serve as a gateway connecting East and West.
- July 2025: ADQ completed the acquisition of 63 % of Aramex shares, deepening strategic backing and opening growth opportunities (including logistics and regional scale benefits).
- June 2025: DHL Group announced it will invest over EUR 500 million (USD 577 million) in the Middle East through 2030, expanding infrastructure, networks, and services across the Gulf (including express, freight, warehousing).


Middle East Food Logistics Market Report Scope
| Transportation | Road |
| Rail | |
| Sea and Inland Water | |
| Air | |
| Warehousing and Storage | |
| Value-added Services (Blast Freezing, Labeling, Inventory Management, etc.) |
| Cold Chain | Ambient (15-25 °C) |
| Chilled (2-8 °C) | |
| Frozen (Less than 0 °C) | |
| Non Cold Chain |
| Meat, Seafood, and Poultry |
| Dairy Products and Frozen Deserts (Milk, Ice-cream, Butter, etc.) |
| Horticulture (Fresh Fruits and Vegetables) |
| Processed Food Products |
| Pet Food |
| Others (Spreads, Seasoning, dressing, Specialty and Functional Foods, etc.) |
| Saudi Arabia |
| United Arab Emirates |
| Qatar |
| Kuwait |
| Oman |
| Bahrain |
| Egypt |
| Rest of Middle East |
| By Services | Transportation | Road |
| Rail | ||
| Sea and Inland Water | ||
| Air | ||
| Warehousing and Storage | ||
| Value-added Services (Blast Freezing, Labeling, Inventory Management, etc.) | ||
| By Temperature-Control Type | Cold Chain | Ambient (15-25 °C) |
| Chilled (2-8 °C) | ||
| Frozen (Less than 0 °C) | ||
| Non Cold Chain | ||
| By End-Product Category | Meat, Seafood, and Poultry | |
| Dairy Products and Frozen Deserts (Milk, Ice-cream, Butter, etc.) | ||
| Horticulture (Fresh Fruits and Vegetables) | ||
| Processed Food Products | ||
| Pet Food | ||
| Others (Spreads, Seasoning, dressing, Specialty and Functional Foods, etc.) | ||
| By Country | Saudi Arabia | |
| United Arab Emirates | ||
| Qatar | ||
| Kuwait | ||
| Oman | ||
| Bahrain | ||
| Egypt | ||
| Rest of Middle East | ||


Key Questions Answered in the Report
What is the projected value of Middle East food logistics in 2031?
The sector is forecast to reach USD 31.41 billion by 2031 on a 7.46% CAGR trajectory.
Which service type is set to expand the fastest and why?
Value-added services are pacing at 10.03% CAGR because shippers increasingly favor bundled solutions such as blast-freezing, labeling, and customs documentation.
How large is the cold-chain segment and what fuels its growth?
Cold-chain activities already hold 69.54% share and are advancing at 8.89% CAGR, underpinned by tighter HACCP compliance, halal traceability rules, and rising demand for fresh foods.
Which country shows the strongest expansion outlook?
The United Arab Emirates leads with a 9.42% CAGR, driven by Jebel Ali’s gateway role, blockchain-enabled customs clearance, and Emirati agri-tech investments.
What hurdles slow new urban cold-storage construction?
Premium land prices in cities like Dubai and Riyadh and the capital intensity of insulated, refrigerant-compliant buildings inflate payback periods and deter smaller entrants.
How does the refrigerant phase-down affect logistics operators?
HFC price spikes and the need for costly CO₂-grade retrofits elevate fleet replacement budgets and require technicians trained on natural refrigerant systems.
Page last updated on:


