Market Overview
| Study Period | 2020 - 2031 |
|---|---|
| Forecast Data Period | 2026 - 2031 |
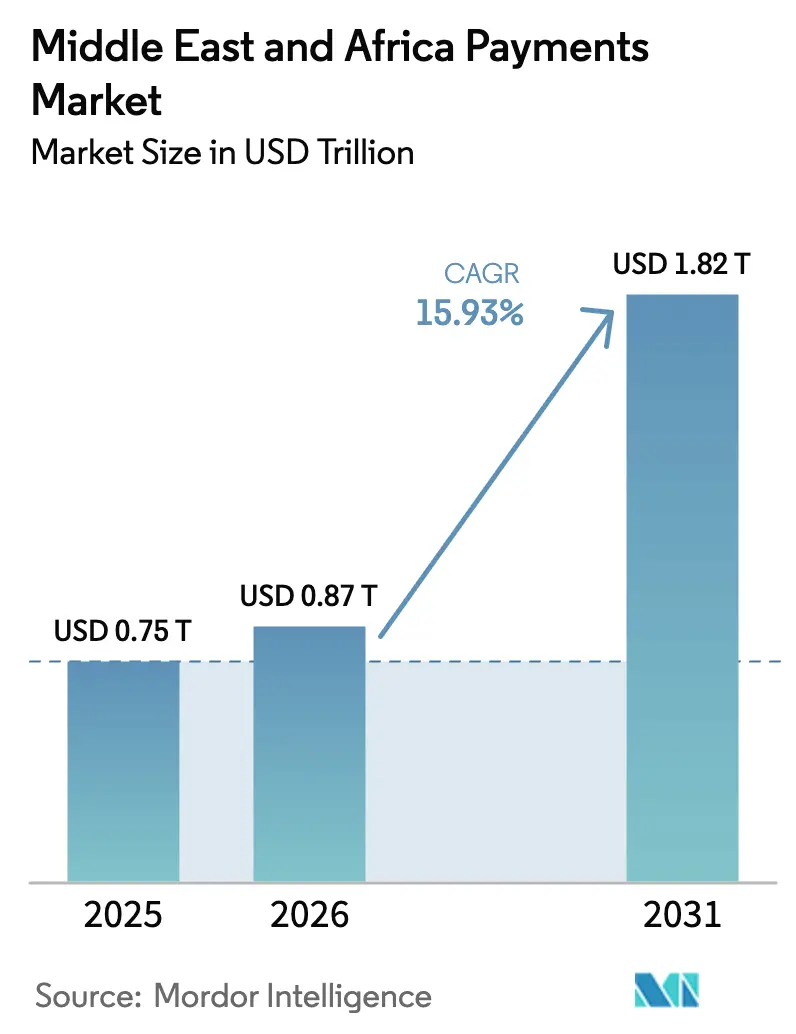
| Base Year Market Size (2025) | USD 0.75 Trillion |
| Market Size (2026) | USD 0.87 Trillion |
| Market Size (2031) | USD 1.82 Trillion |
| Growth Rate (2026 - 2031) | 15.93% CAGR |
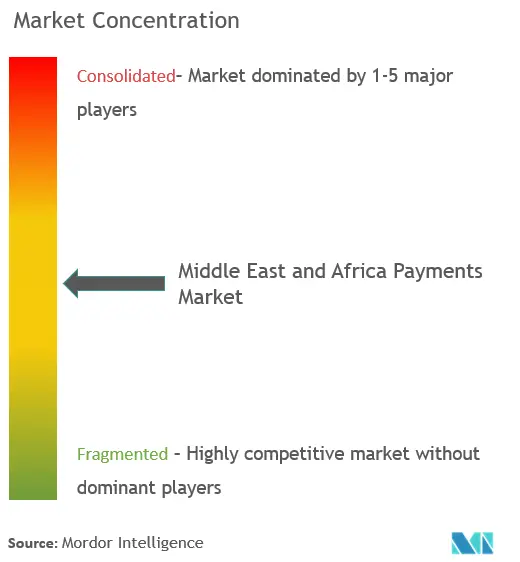
| Market Concentration | Medium |
Major Players *Disclaimer: Major Players sorted in no particular order Image © Mordor Intelligence. Reuse requires attribution under CC BY 4.0. | |
Middle East And Africa Payments Market Analysis by Mordor Intelligence
Middle East and Africa payments market size in 2026 is estimated at USD 0.87 trillion, growing from 2025 value of USD 0.75 trillion with 2031 projections showing USD 1.82 trillion, growing at 15.93% CAGR over 2026-2031. Cash-to-digital migration, smartphone ubiquity, and sovereign mandates that force merchants to accept electronic payments are combining to accelerate adoption across point-of-sale and remote channels. Governments are synchronizing fiscal-diversification agendas with investments in instant-payment rails, enabling fintech newcomers to bypass legacy banking infrastructure while creating fresh revenue pools for incumbent processors. Central-bank support for regional settlement platforms is lowering cross-border fees, which boosts small-business participation in e-commerce. Competitive intensity is rising as global card networks defend interchange revenue against direct-to-account alternatives that promise lower acceptance costs.
Key Report Takeaways
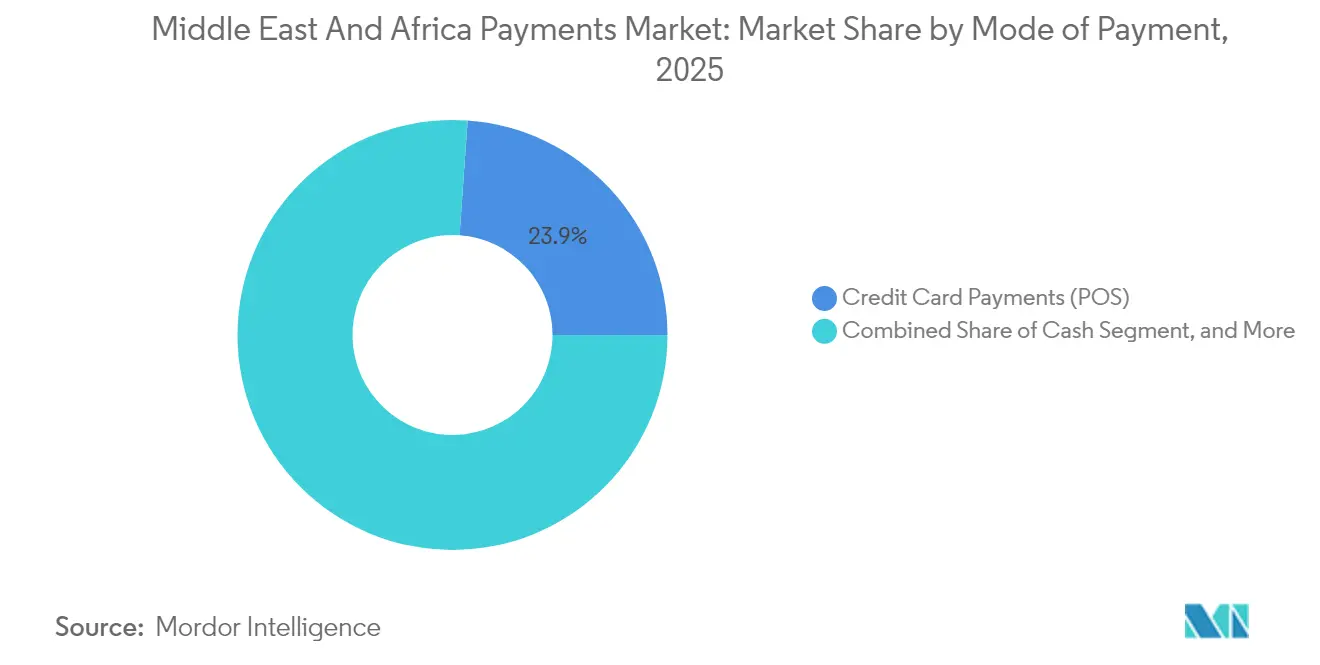
- By mode of payment, credit card payments led with 23.88% revenue share of the Middle East and Africa payments market in 2025; digital wallets are projected to expand at a 16.64% CAGR through 2031.
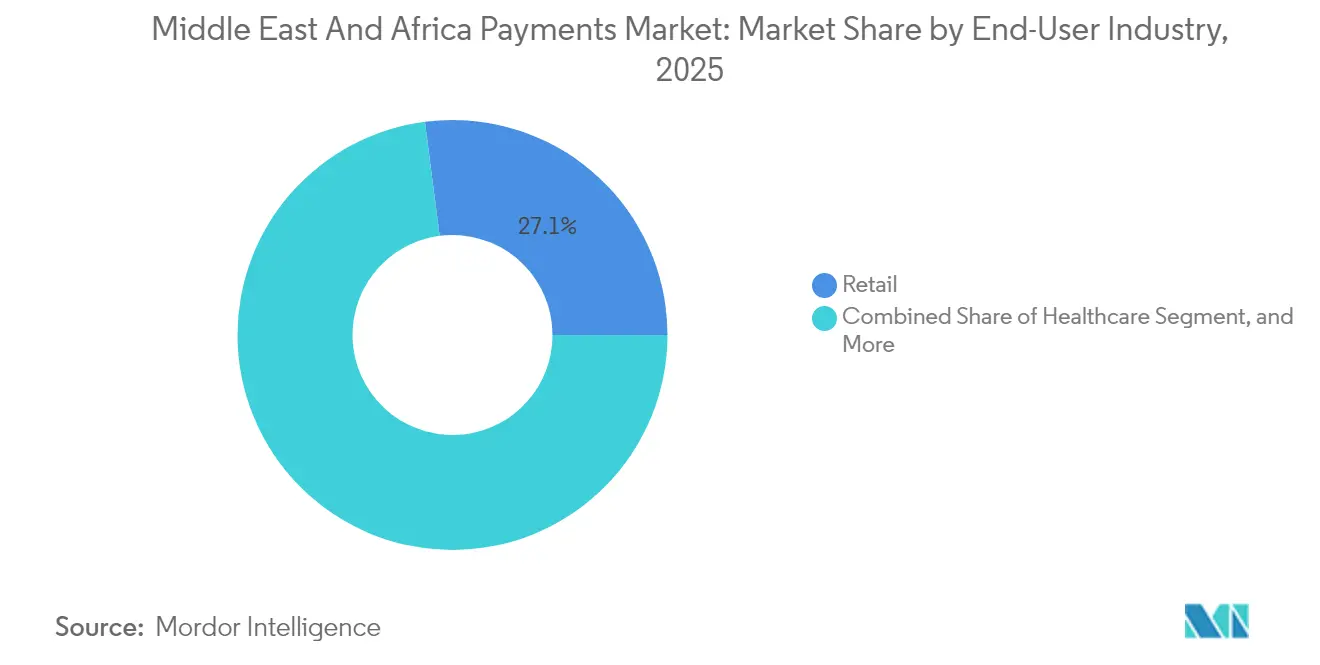
- By end-user industry, retail captured 27.05% revenue share of the Middle East and Africa payments market in 2025; healthcare is forecast to accelerate at a 16.58% CAGR to 2031.
- By country, Saudi Arabia held 29.10% of the Middle East and Africa payments market share in 2025, while the United Arab Emirates is set to rise at a 16.75% CAGR through 2031.
Note: Market size and forecast figures in this report are generated using Mordor Intelligence’s proprietary estimation framework, updated with the latest available data and insights as of 2026.
Middle East And Africa Payments Market Trends and Insights
Drivers Impact Analysis*
| Driver | (~) % Impact on CAGR Forecast | Geographic Relevance | Impact Timeline |
|---|---|---|---|
| Digital Adoption of POS and Mobile Channels | +3.2% | Global, with highest impact in GCC and South Africa | Medium term (2-4 years) |
| Retail and Government Digitization Programs | +2.8% | Saudi Arabia, UAE, Egypt, Nigeria | Long term (≥ 4 years) |
| Surge in Real-Time and BNPL Payments | +2.5% | GCC countries, South Africa | Short term (≤ 2 years) |
| Expansion of FinTech-Friendly Regulatory Sandboxes | +1.9% | UAE, Saudi Arabia, South Africa, Nigeria | Medium term (2-4 years) |
| Cross-Border E-Commerce Growth and Remittance Digitization | +2.1% | Pan-African and MENA corridors | Long term (≥ 4 years) |
| Tokenization and Contactless Card Issuance Acceleration | +1.8% | UAE, Saudi Arabia, Egypt | Medium term (2-4 years) |
| Source: Mordor Intelligence | |||
Digital Adoption of POS and Mobile Channels
Regulations that compel electronic acceptance are reshaping merchant economics across the Middle East and Africa payments market. The UAE’s mandate that all merchants offer digital options by 2026 and Egypt’s rollout of a national QR specification are expanding terminal density well beyond formal retail. Smartphone penetration above 80% in Gulf states turns mobile wallets into the default entry point for millions of unbanked consumers.[1]Mastercard Newsroom, “Mastercard Joins Buna, the Arab Regional Payment System,” mastercard.com Street-level vendors in Riyadh and informal kiosks in Lagos are turning to low-cost Android POS devices that support tap-to-phone functionality, closing the acceptance gap and multiplying transaction volumes. As consumer familiarity rises, issuers benefit from larger average ticket sizes versus cash, while governments capture richer audit trails that improve indirect-tax compliance. Somalia’s nationwide QR initiative illustrates how even low-income states can formalize micro-commerce without extensive card infrastructure.
Retail and Government Digitization Programs
Salary, subsidy, and pension flows are migrating to prepaid and account-based rails, converting captive user groups into habitual digital payers across the Middle East and Africa payments market. Egypt consolidated multiple welfare schemes onto a unified payment card in 2024, driving immediate volume for domestic processors.[2]Central Bank of Egypt, “CBE Joins Pan-African Payment and Settlement System,” cbe.org.eg Saudi Arabia anchors its Vision 2030 agenda on achieving 70% cashless transactions, a goal backed by fines for large retailers that refuse non-cash instruments. Because public-sector disbursements are predictable and high-frequency, processors gain guaranteed throughput that underwrites capital expenditure in acceptance infrastructure. Domestic data-localization clauses embedded in these programs keep sensitive credentials onshore, sheltering emerging fintechs from global competitors that lack licensed processing nodes.
Surge in Real-Time and BNPL Payments
Central banks in Saudi Arabia, the UAE, and South Africa launched instant-payment schemes that clear in seconds, allowing merchants to receive funds faster and cut working-capital buffers. Real-time rails underpin the explosive growth of BNPL platforms such as Tamara, whose Series C round raised USD 340 million in 2025. Younger consumers favor installment offers that align with Sharia compliance and transparent pricing. Processors like Network International now embed BNPL modules directly in POS firmware, broadening acceptance from e-commerce into grocery and fuel segments. Combined real-time settlement and pay-in-four models increase issuer interchange and lower charge-off risk, encouraging banks to underwrite co-branded programs that target Gen Z shoppers.
Expansion of FinTech-Friendly Regulatory Sandboxes
Regulators in Abu Dhabi, Riyadh, Johannesburg, and Lagos operate live sandboxes that let start-ups test products with limited licenses, shortening time-to-market for payment innovation in the Middle East and Africa payments market. The Saudi Central Bank has admitted more than 100 firms since 2018, ranging from API aggregators to digital asset platforms. Sandbox cohorts benefit from streamlined onboarding to national payment switches, reducing cost barriers that previously deterred foreign venture funding. Cross-border data-sharing through the Global Financial Innovation Network harmonizes disclosure formats, helping scale-ups to expand regionally without resetting compliance architectures. South Africa uses its sandbox to pilot distributed-ledger settlement for low-value remittances, signaling future regulatory openness toward tokenized deposits.
Restraints Impact Analysis*
| Restraint | (~) % Impact on CAGR Forecast | Geographic Relevance | Impact Timeline |
|---|---|---|---|
| Rising E-Commerce and Social-Engineering Fraud | -1.8% | Global, with highest impact in Nigeria, Kenya, South Africa | Short term (≤ 2 years) |
| Fragmented Cross-Border Payment Infrastructure | -1.5% | Pan-African corridors, MENA-Africa trade routes | Medium term (2-4 years) |
| Limited Financial Inclusion in Rural Areas | -1.2% | Sub-Saharan Africa, rural Egypt, Yemen | Long term (≥ 4 years) |
| Data-Privacy and Cyber-Security Compliance Costs | -0.9% | GCC countries, South Africa, Nigeria | Medium term (2-4 years) |
| Source: Mordor Intelligence | |||
Rising E-Commerce and Social-Engineering Fraud
Cybercrime rings are exploiting weaker KYC controls on wallet top-ups and BNPL applications, eroding consumer trust across the Middle East and Africa payments market. Nigeria, Kenya, and South Africa reported SIM-swap incidents that doubled between 2024 and 2025, forcing issuers to tighten real-time risk scoring. While large processors can absorb the cost of machine-learning fraud suites, smaller PSPs face margin pressure as they invest in token-based authentication and anomaly-detection tools.[3]IMF Staff, “Central Bank Digital Currencies Can Boost Middle East’s Financial Inclusion,” imf.org Merchants that prioritize one-click checkout sometimes defer multifactor prompts, creating vulnerabilities that fraudsters mine through credential-stuffing. Heightened regulatory scrutiny adds compliance overhead, especially as data-protection acts impose stiff penalties for breaches.
Fragmented Cross-Border Payment Infrastructure
Although PAPSS and BUNA promise seamless settlement, participation remains uneven, and many corridors still rely on expensive correspondent networks operated by global banks. Disparate message formats and divergent AML thresholds force PSPs to maintain multiple bank accounts, raising treasury costs that trickle down to SMEs. Volatile exchange rates in Angola, Egypt, and Ghana introduce hedging premiums that negate fee savings from digital channels. Technical outages on national switches occasionally delay reconciliation, undermining merchant confidence. Until interoperability improves, merchants and consumers may default to legacy rails despite higher charges, tempering the regional growth trajectory.
*Our forecasts treat driver/restraint impacts as directional, not additive. The impact forecasts reflect baseline growth, mix effects, and variable interactions.
Segment Analysis
By Mode of Payment: Digital Wallet Momentum Outpaces Card-Based Dominance
Credit cards secured 23.88% revenue share in 2025, anchoring the point-of-sale layer of the Middle East and Africa payments market as affluent shoppers continue to value rewards, chargeback protection, and widespread acceptance. The segment benefits from tokenized credentials that support omnichannel use cases, including in-app grocery ordering and subscription billing. However, wallet-based platforms are registering a 16.64% CAGR to 2031, translating into a projected USD 0.48 trillion slice of the Middle East and Africa payments market size by the end of the forecast period. Wallet attractiveness stems from seamless onboarding, fee-free peer transfers, and loyalty integrations; merchants reap lower MDRs and instant settlement through account-to-account back ends. NFC-enabled smartphones and wearables foster tap-to-pay convenience, while QR codes fill the gap in cash-heavy micro-merchant environments. Debit cards remain a transitional bridge, especially in markets where regulators cap interchange, making them cost-effective for everyday spending below USD 10. Alternative instruments such as push-payment links and pay-by-bank APIs address bill-payment and tuition niches, carving incremental volumes from cash-on-delivery, which is retreating as consumer confidence in refund logistics rises.
Digital wallets thrive in cross-border e-commerce, where embedded FX engines auto-convert checkout amounts into local currency, shielding shoppers from opaque issuer spreads. BNPL players embed themselves within wallets, offering instant eligibility checks that rely on open-banking data rather than bureau scores, an advantage in thin-file populations. Contactless card issuance, now standard in GCC markets, narrows the convenience gap but cannot replicate wallet ecosystem stickiness that bundles transit, event tickets, and micro-insurance. PSPs that aggregate both tokens and wallet handles deliver higher authorization rates and lower fraud through behavioral biometrics captured on device. Consequently, the digital-wallet cohort is expected to contribute more than 34.00% of incremental absolute transaction value between 2026 and 2031, shifting fee pools toward direct-to-account and interchange-free models.


By End-User Industry: Retail Scale Persists; Healthcare Growth Accelerates
Retail accounted for 27.05% of 2025 transaction value, equal to USD 0.2 trillion of Middle East and Africa payments market size. Supermarkets, hypermarkets, and convenience chains spearheaded POS terminal deployments that capture rich SKU-level data used to power targeted loyalty offers. The vertical’s sheer ticket velocity attracts acquirer competition, compressing merchant discount rates but driving acquirers into value-added analytics and lending to defend margins. E-commerce sub-segments, fashion, electronics, and marketplace platforms, benefit from one-click tokens and embedded BNPL, lifting average basket sizes by almost 30% compared with cash-on-delivery. As margins plateau, large retailers are forging closed-loop wallet programs that recirculate funds inside proprietary ecosystems, further magnifying transaction throughput.
Healthcare is forecast to post a 16.58% CAGR, lifting its contribution from USD 0.05 trillion in 2025 to USD 0.13 trillion by 2031, equal to a 7.15% slice of Middle East and Africa payments market share. Government projects to digitize insurance reimbursements, pharmacy claims, and clinic co-pays streamline legacy paper billing and reduce revenue-cycle delays. Nigeria’s nationwide shift to electronic salary payments for health workers funnels disposable income onto digital rails, reinforcing habit formation for everyday purchases. Egypt’s e-health card pilots illustrate how a single credential can cover eligibility verification, prescription fulfillment, and account-based payments in one workflow. Private hospital groups integrate point-of-care financing into patient portals, allowing pay-in-four options that mitigate out-of-pocket strain. Pharmaceutical distributors increasingly demand real-time settlement from pharmacies, using APIs that ride on instant-payment rails to curb credit exposure. These factors combine to elevate healthcare from a niche digital segment into one of the fastest volume contributors over the forecast horizon.
Geography Analysis
Saudi Arabia controlled 29.10% of 2025 transactional value, reflecting top-down policy alignment, a unified national switch, and concentrated merchant landscapes. The kingdom’s regulatory clarity, including mandatory non-cash acceptance and a sandbox that graduates fintechs into full licenses, underpins predictable revenue pools for processors. BNPL penetration is the highest in the region, with Tamara alone serving more than 6 million users and partnering with over 30,000 merchants. Domestic scheme “mada” secures local interchange, keeping fees within the economy and enabling aggressive cashback campaigns that nudge cash users toward cards. Growth remains solid yet moderated at sub-double-digit rates due to high baseline penetration.
The United Arab Emirates, though smaller, is outpacing its peers at a 16.75% CAGR, set to capture an incremental USD 0.22 trillion of Middle East and Africa payments market size by 2031. Dubai’s trade-hub status attracts cross-border acquirers and marketplace integrators, while federal mandates require every business to enable at least one digital acceptance channel by 2026. Project mBridge positions the UAE at the vanguard of multi-currency wholesale CBDC experimentation, promising to compress settlement windows for trade invoices from two days to minutes. Fintech-friendly licensing in Abu Dhabi Global Market lowers capital thresholds, drawing wallet start-ups that target remittances to India, Pakistan, and the Philippines. South Africa rounds out the top trio with a mature, card-centric base but slower expansion due to macro headwinds. Nevertheless, instant-payment scheme “PayShap” is enabling low-value peer-to-merchant flows that bypass card rails for under ZAR 1,000 (~USD 55). The Rest of MEA cluster features fast-growing Nigeria and Egypt, where mobile money and government card programs respectively anchor structural shifts away from cash.
Competitive Landscape
Competition in the Middle East and Africa payments market plays out across three layers, acquirers/gateways, card networks, and wallet ecosystems, with none exceeding a 10% pan-regional revenue share. Network International leverages deep Gulf regulatory links to anchor large merchants, while Interswitch dominates Nigerian card processing and now plugs into PAPSS to widen cross-border capabilities. Global card schemes defend interchange residua by rolling out tokenization, Click-to-Pay standards, and installment APIs that emulate BNPL flexibility. Wallet leaders such as M-Pesa, STC Pay, and Careem Pay rely on super-app strategies, bundling ride-hailing, bill pay, and micro-lending to heighten daily engagement and create embedded-finance moats.
Strategic moves signal accelerating consolidation. Rapyd’s USD 610 million purchase of PayU GPO in March 2025 adds Latin American and African gateway nodes, giving merchants a single API for 45 local payment methods. In Egypt, Basata’s stake increase in MadfoatCom positions the firm within government-collections flows, an attractive recurring-revenue niche. Processors are integrating fraud-analytics firms to differentiate on security; Network International’s 2024 tie-up with Visa’s Cybersource expands token-management services that reduce false positives. White-space remains in rural acceptance: startups deploy solar-powered POS devices with offline caching to withstand patchy connectivity, targeting 50 million micro-enterprises still trading in cash.
Technology stacks are evolving from monolithic data centers to microservice cloud deployments that cut onboarding from weeks to hours. API-first acquirers win fintech partnerships that embed checkout in super-apps and IoT devices. Regional incumbents respond by opening developer portals and offering revenue-share models to third-party ISVs. As cross-border volumes climb, processors capable of real-time FX and local-currency settlement capture higher take rates compared with USD-denominated gateways that suffer double conversion. Over the next five years, capital-rich players are poised to consolidate tier-2 acquirers, compressing unit economics but creating scale efficiencies needed to comply with heightening data-sovereignty laws.
Middle East And Africa Payments Industry Leaders
Jumia Technologies AG (JumiaPay)
Network International Holdings plc
PalmPay Technology Co., Ltd.
OPay Digital Services Ltd.
Interswitch Limited
- *Disclaimer: Major Players sorted in no particular order

Recent Industry Developments
- March 2025: Rapyd completed its USD 610 million acquisition of PayU GPO, significantly expanding its payment orchestration capabilities across Latin America and Africa.
- March 2025: Egyptian fintech startup Basata acquired an additional stake in Jordanian payments company MadfoatCom, indicating continued regional consolidation and cross-border investment within MENA digital payments.
- December 2024: Central Bank of Egypt officially joined the Pan-African Payment and Settlement System (PAPSS), expanding the network to 15 participating central banks and creating new payment corridors between North Africa and sub-Saharan markets.
- November 2024: Mastercard joined BUNA, the Arab Regional Payment System, as a direct participant to enable faster and lower-cost cross-border payments across MENA markets.


Middle East And Africa Payments Market Report Scope
The payments market is segmented by two modes of payment - POS and e-commerce. E-commerce payments include online purchases of goods and services such as purchases made on e-commerce websites and online booking of travel and accommodation. However, it does not include online purchases of motor vehicles, real estate, utility bill payments (such as water, heating, and electricity), mortgage payments, loans, credit card bills, or purchases of shares and bonds. As for POS, all transactions that occur at the physical point of sale are included in the market scope. It includes traditional in-store transactions and all face-to-face transactions regardless of where they take place. Cash is also considered for both cases (cash-on-delivery for e-commerce sales).
Mode of Payment
| Point of Sale | Debit Card Payments |
| Credit Card Payments | |
| A2A Payments | |
| Digital Wallet | |
| Cash | |
| Other Point-of-Sale Payment Mode | |
| Online Sale | Debit Card Payments |
| Credit Card Payments | |
| A2A Payments | |
| Digital Wallet | |
| Cash-on-Delivery | |
| Other Online-Sales Payment Mode |
End-User Industry
| Retail |
| Entertainment |
| Hospitality |
| Healthcare |
| Other End-User Industries |
Geography
| South Africa |
| United Arab Emirates |
| Saudi Arabia |
| Rest of Middle East and Africa |
| Mode of Payment | Point of Sale | Debit Card Payments |
| Credit Card Payments | ||
| A2A Payments | ||
| Digital Wallet | ||
| Cash | ||
| Other Point-of-Sale Payment Mode | ||
| Online Sale | Debit Card Payments | |
| Credit Card Payments | ||
| A2A Payments | ||
| Digital Wallet | ||
| Cash-on-Delivery | ||
| Other Online-Sales Payment Mode | ||
| End-User Industry | Retail | |
| Entertainment | ||
| Hospitality | ||
| Healthcare | ||
| Other End-User Industries | ||
| Geography | South Africa | |
| United Arab Emirates | ||
| Saudi Arabia | ||
| Rest of Middle East and Africa | ||


Key Questions Answered in the Report
How large is the Middle East and Africa payments space in 2026?
The Middle East and Africa payments market size reached USD 0.87 trillion in 2026 and is on track for USD 1.82 trillion by 2031 at a 15.93% CAGR.
Which country contributes most to digital payments volume?
Saudi Arabia leads with 29.10% of 2025 transaction value, driven by Vision 2030 targets and nationwide electronic-payment mandates.
What is driving the surge in BNPL usage?
Younger consumers prefer interest-free installments, and instant-payment rails enable platforms such as Tamara to offer rapid merchant settlement and seamless onboarding.
Why are cross-border fees falling for importers and remitters?
Regional settlement platforms like PAPSS and BUNA let banks clear in local currency within seconds, bypassing costly correspondent networks.
Which end-user vertical is growing fastest?
Healthcare payments are expanding at a 16.58% CAGR as governments digitize reimbursements and hospitals adopt pay-at-point-of-care financing.
Page last updated on:


