MEA Specialty Fertilizer Market Size

| Icons | Lable | Value |
|---|---|---|
|
|
Study Period | 2016 - 2030 |
|
|
Market Size (2024) | USD 4.54 Billion |
|
|
Market Size (2030) | USD 6.63 Billion |
|
|
Largest Share by Speciality Type | Liquid Fertilizer |
|
|
CAGR (2024 - 2030) | 6.51 % |
|
|
Largest Share by Country | South Africa |
Major Players |
||
|
|
||
|
*Disclaimer: Major Players sorted in no particular order |
MEA Specialty Fertilizer Market Analysis
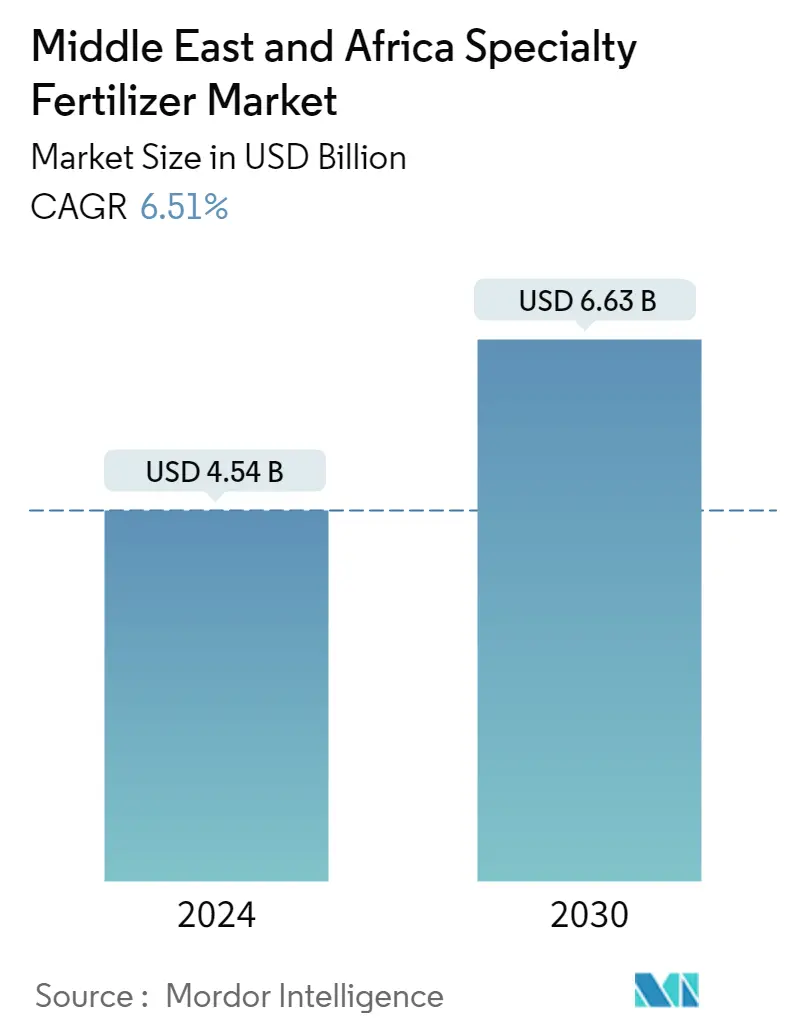
The Middle East & Africa Specialty Fertilizer Market size is estimated at USD 4.54 billion in 2024, and is expected to reach USD 6.63 billion by 2030, growing at a CAGR of 6.51% during the forecast period (2024-2030).
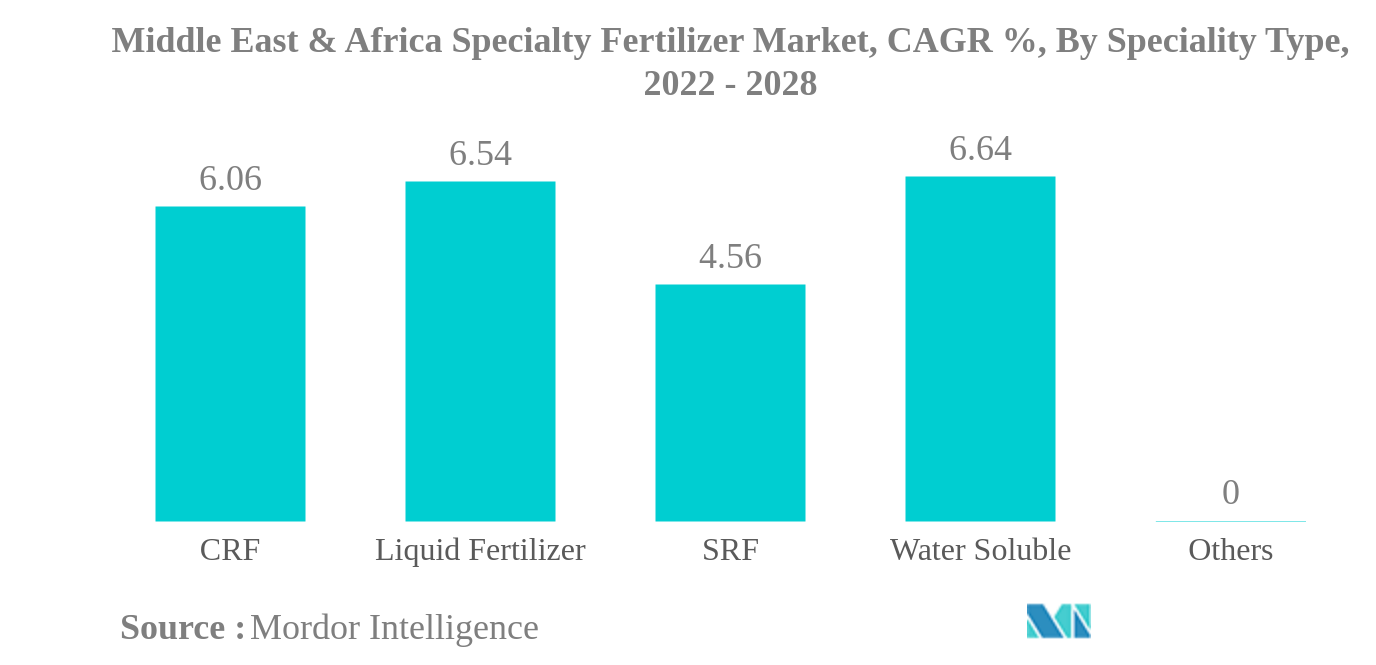
- Largest segment by Speciality Type - Liquid Fertilizer : The demand for liquid fertilizer in Middle East and Africa region keeps up, as the soils in the region are dry and liquid fertilizers ensure easy absorbtion by the plants
- Fastest growing by Speciality Type - Water Soluble : The watersoluble fertilizer absorption rate is more than double compared to conventional fertilizers reaching an efficiency of about 80-90% and reducing total fertilizer use.
- Largest Segment by Crop Type - Horticultural Crops : Specialty fertilizers in the region are mostly applied through fertigation in horticultural crops, this is because fertigation reduces cost and fertilizer use by 20-30%.
- Largest segment by Country - South Africa : Though arable land in the South Africa remained unchanged during the study period, nutrient consumption increased by 16.5% for N, 5.9% for P, and 56% for K, which denoted the increased fertilizer consumption in the country.
MEA Specialty Fertilizer Market Trends
This section covers the major market trends shaping the MEA Specialty Fertilizer Market according to our research experts:
Liquid Fertilizer is the largest segment by Speciality Type.
- The specialty fertilizers market in the Middle East & Africa accounted for 42.7% of the market studied in 2021, and it is estimated to grow at a CAGR of 5.44% during the forecast period.
- Rest of Middle East & Africa and Nigeria dominated the market studied, occupying 55.3% and 37.3%, respectively, in 2021. Due to their large populations, land availability, and government policies of fertilizer trials, Nigeria and countries in the Rest of Middle East & and Africa are being targeted by fertilizer manufacturing corporations, which is propelling market expansion.
- Liquid fertilizers accounted for 45.15% of the market studied in 2021 because growers in the Middle East & Africa became aware of the benefits of liquid fertilizers as they penetrate the soil easily and allow plants to absorb nutrients more quickly. They help in reducing fertilizer wastage, and they can be either ground applied or foliar applied. As a result, there is a huge opportunity for liquid fertilizers to expand in the Middle East & Africa during the forecast period.
- In 2021, water-soluble fertilizers accounted for 43.9% value of the Middle East & Africa specialty fertilizers market. Water-soluble fertilizers make nutrition management simple because nutrient levels are not affected by leaching or erosion.
- In recent years, increased awareness about specialized fertilizers among farmers and the rising demand for liquid and water-soluble fertilizers and controlled-release fertilizers are expected to drive the growth of the market studied.
South Africa is the largest segment by Country.
- In the Middle East & African specialty fertilizer market, Saudi Arabia held a share of 0.4% in 2021, and it is estimated to register a CAGR of 8.0% during the forecast period. According to the World Bank database, Saudi Arabia is the largest economy in the Middle East, and its GDP stood at USD 793 billion in 2019, which increased by 2.2% from 2018 and accounted for 2.2% in 2020.
- Nigeria accounted for 38.6% of the value of the Middle East & African specialty fertilizer market. In the Nigerian specialty fertilizers market, liquid fertilizers accounted for 49.5%, followed by water-soluble fertilizers at 48.40%, controlled-release fertilizers at 1.7%, and slow-release fertilizers at 0.2% of the total specialty fertilizers market in 2021.
- The South African specialty fertilizer market accounted for 42.9% of the country's fertilizer market in 2021. The fertigation application segment dominated the market, accounting for 46.5% of the total specialty fertilizer market in 2021. Fertigation is primarily used for the cultivation of plantation crops such as rubber and oil palm, which require larger quantities of fertilizer. The usage efficiency of the fertigation method ranges between 80.0% and 90.0%, allowing for a minimum 25.0% reduction in nutrient use.
- Turkey accounted for 4.7% of the Middle East & African specialty fertilizers market value in 2021. Water-soluble fertilizers accounted for the highest market share of 40.0%, followed by liquid fertilizers, accounting for a share of 36.2%, CRF - 18.1%, and SRF - 5.0% in 2021. Water-soluble fertilizers can either be foliar applied or ground applied through fertigation. Water-soluble fertilizers have gained significant popularity in recent years.

MEA Specialty Fertilizer Industry Overview
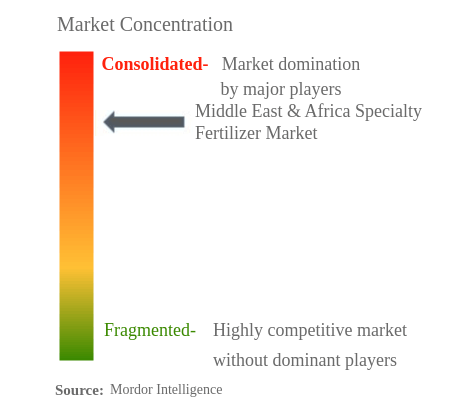
The Middle East & Africa Specialty Fertilizer Market is fairly consolidated, with the top five companies occupying 66.46%. The major players in this market are Foskor, ICL GROUP LTD, K+S AKTIENGESELLSCHAFT, Safsulphur and Yara International ASA, (sorted alphabetically).
MEA Specialty Fertilizer Market Leaders
Foskor
ICL GROUP LTD
K+S AKTIENGESELLSCHAFT
Safsulphur
Yara International ASA,
*Disclaimer: Major Players sorted in no particular order
MEA Specialty Fertilizer Market News
- April 2019: Kynoch announced Mergers & Acquisitions of Profert Fertilizer a major role player in the granular and liquid fertilizer industry. This transaction will give Kynoch access to new markets and additional production resources, ultimately contributing to their motto of enhancing efficiency through innovation.
- March 2019: Kynoch Fertilizer, a leading plant nutrient producer and distributor, announced the Mergers & Acquisitions of Sidi Parani to build a substantial position in the fertilizer market in South Africa and Africa.
- November 2018: ICL Fertilizers has developed a new line of premium fertilizers which help farmers feed their crops precisely. Polysulphate, ICLPotashpluS, and ICLPKpluS are manufactured from polyhalite, a mineral extracted at the ICL mine in Boulby, United Kingdom to meet the agricultural need for balanced, targeted nutrition.
MEA Specialty Fertilizer Market Report - Table of Contents
1. EXECUTIVE SUMMARY & KEY FINDINGS
2. REPORT OFFERS
3. INTRODUCTION
3.1. Study Assumptions & Market Definition
3.2. Scope of the Study
3.3. Research Methodology
4. KEY INDUSTRY TRENDS
4.1. Acreage Of Major Crop Types
4.2. Average Nutrient Application Rates
4.3. Regulatory Framework
4.4. Value Chain & Distribution Channel Analysis
5. MARKET SEGMENTATION
5.1. Speciality Type
5.1.1. CRF
5.1.1.1. Polymer Coated
5.1.1.2. Polymer-Sulfur Coated
5.1.1.3. Others
5.1.2. Liquid Fertilizer
5.1.3. SRF
5.1.4. Water Soluble
5.2. Application Mode
5.2.1. Fertigation
5.2.2. Foliar
5.2.3. Soil
5.3. Crop Type
5.3.1. Field Crops
5.3.2. Horticultural Crops
5.3.3. Turf & Ornamental
5.4. Country
5.4.1. Nigeria
5.4.2. Saudi Arabia
5.4.3. South Africa
5.4.4. Turkey
5.4.5. Rest Of Middle East & Africa
6. COMPETITIVE LANDSCAPE
6.1. Key Strategic Moves
6.2. Market Share Analysis
6.3. Company Landscape
6.4. Company Profiles
6.4.1. Azra Group AS
6.4.2. Foskor
6.4.3. Gavilon South Africa
6.4.4. ICL GROUP LTD
6.4.5. K+S AKTIENGESELLSCHAFT
6.4.6. Kynoch Fertilizer
6.4.7. Safsulphur
6.4.8. Unikeyterra Chemical
6.4.9. Yara International ASA,
7. KEY STRATEGIC QUESTIONS FOR FERTILIZER CEOS
8. APPENDIX
8.1. Global Overview
8.1.1. Overview
8.1.2. Porter's Five Forces Framework
8.1.3. Global Value Chain Analysis
8.1.4. Market Dynamics (DROs)
8.2. Sources & References
8.3. List of Tables & Figures
8.4. Primary Insights
8.5. Data Pack
8.6. Glossary of Terms
List of Tables & Figures
- Figure 1:
- MIDDLE EAST & AFRICA MARKET, AREA YOY GROWTH RATE, 2016 - 2021
- Figure 2:
- MIDDLE EAST & AFRICA MARKET, AREA YOY GROWTH RATE, 2016 - 2021
- Figure 3:
- MIDDLE EAST & AFRICA MARKET, VOLUME YOY GROWTH RATE, 2021 - 2021
- Figure 4:
- MIDDLE EAST & AFRICA MARKET, VOLUME YOY GROWTH RATE, 2021 - 2021
- Figure 5:
- MIDDLE EAST & AFRICA MARKET, VOLUME YOY GROWTH RATE, 2021 - 2021
- Figure 6:
- MIDDLE EAST & AFRICA MARKET, VOLUME YOY GROWTH RATE, 2021 - 2021
- Figure 7:
- MIDDLE EAST & AFRICA MARKET, VOLUME YOY GROWTH RATE, 2021 - 2021
- Figure 8:
- MIDDLE EAST & AFRICA MARKET, VOLUME YOY GROWTH RATE, 2021 - 2021
- Figure 9:
- MIDDLE EAST & AFRICA SPECIALTY FERTILIZER MARKET, VOLUME, METRIC TON, 2016 - 2028
- Figure 10:
- MIDDLE EAST & AFRICA SPECIALTY FERTILIZER MARKET, VALUE, USD, 2016 - 2028
- Figure 11:
- MIDDLE EAST & AFRICA SPECIALTY FERTILIZER MARKET, BY SPECIALITY TYPE, VOLUME, METRIC TON, 2016 - 2028
- Figure 12:
- MIDDLE EAST & AFRICA SPECIALTY FERTILIZER MARKET, BY SPECIALITY TYPE, VALUE, USD, 2016 - 2028
- Figure 13:
- MIDDLE EAST & AFRICA SPECIALTY FERTILIZER MARKET, VOLUME SHARE(%), BY SPECIALITY TYPE, 2016 - 2028
- Figure 14:
- MIDDLE EAST & AFRICA SPECIALTY FERTILIZER MARKET, VALUE SHARE(%), BY SPECIALITY TYPE, 2016 - 2028
- Figure 15:
- MIDDLE EAST & AFRICA SPECIALTY FERTILIZER MARKET, BY COATING TYPE, VOLUME, METRIC TON, 2016 - 2028
- Figure 16:
- MIDDLE EAST & AFRICA SPECIALTY FERTILIZER MARKET, BY COATING TYPE, VALUE, USD, 2016 - 2028
- Figure 17:
- MIDDLE EAST & AFRICA SPECIALTY FERTILIZER MARKET, VOLUME SHARE(%), BY COATING TYPE, 2016 - 2028
- Figure 18:
- MIDDLE EAST & AFRICA SPECIALTY FERTILIZER MARKET, VALUE SHARE(%), BY COATING TYPE, 2016 - 2028
- Figure 19:
- MIDDLE EAST & AFRICA SPECIALTY FERTILIZER MARKET, BY COATING TYPE, POLYMER COATED, METRIC TON, 2016 - 2028
- Figure 20:
- MIDDLE EAST & AFRICA SPECIALTY FERTILIZER MARKET, BY COATING TYPE, POLYMER COATED, USD, 2016 - 2028
- Figure 21:
- MIDDLE EAST & AFRICA SPECIALTY FERTILIZER MARKET, VALUE SHARE(%), BY CROP TYPE, 2016 - 2028
- Figure 22:
- MIDDLE EAST & AFRICA SPECIALTY FERTILIZER MARKET, BY COATING TYPE, POLYMER-SULFUR COATED, METRIC TON, 2016 - 2028
- Figure 23:
- MIDDLE EAST & AFRICA SPECIALTY FERTILIZER MARKET, BY COATING TYPE, POLYMER-SULFUR COATED, USD, 2016 - 2028
- Figure 24:
- MIDDLE EAST & AFRICA SPECIALTY FERTILIZER MARKET, VALUE SHARE(%), BY CROP TYPE, 2016 - 2028
- Figure 25:
- MIDDLE EAST & AFRICA SPECIALTY FERTILIZER MARKET, BY COATING TYPE, OTHERS, METRIC TON, 2016 - 2028
- Figure 26:
- MIDDLE EAST & AFRICA SPECIALTY FERTILIZER MARKET, BY COATING TYPE, OTHERS, USD, 2016 - 2028
- Figure 27:
- MIDDLE EAST & AFRICA SPECIALTY FERTILIZER MARKET, VALUE SHARE(%), BY CROP TYPE, 2016 - 2028
- Figure 28:
- MIDDLE EAST & AFRICA SPECIALTY FERTILIZER MARKET, BY SPECIALITY TYPE, LIQUID FERTILIZER, METRIC TON, 2016 - 2028
- Figure 29:
- MIDDLE EAST & AFRICA SPECIALTY FERTILIZER MARKET, BY SPECIALITY TYPE, LIQUID FERTILIZER, USD, 2016 - 2028
- Figure 30:
- MIDDLE EAST & AFRICA SPECIALTY FERTILIZER MARKET, VALUE SHARE(%), BY CROP TYPE, 2016 - 2028
- Figure 31:
- MIDDLE EAST & AFRICA SPECIALTY FERTILIZER MARKET, BY SPECIALITY TYPE, SRF, METRIC TON, 2017 - 2028
- Figure 32:
- MIDDLE EAST & AFRICA SPECIALTY FERTILIZER MARKET, BY SPECIALITY TYPE, SRF, USD, 2017 - 2028
- Figure 33:
- MIDDLE EAST & AFRICA SPECIALTY FERTILIZER MARKET, VALUE SHARE(%), BY CROP TYPE, 2017 - 2028
- Figure 34:
- MIDDLE EAST & AFRICA SPECIALTY FERTILIZER MARKET, BY SPECIALITY TYPE, WATER SOLUBLE, METRIC TON, 2016 - 2028
- Figure 35:
- MIDDLE EAST & AFRICA SPECIALTY FERTILIZER MARKET, BY SPECIALITY TYPE, WATER SOLUBLE, USD, 2016 - 2028
- Figure 36:
- MIDDLE EAST & AFRICA SPECIALTY FERTILIZER MARKET, VALUE SHARE(%), BY CROP TYPE, 2016 - 2028
- Figure 37:
- MIDDLE EAST & AFRICA SPECIALTY FERTILIZER MARKET, BY APPLICATION MODE, VOLUME, METRIC TON, 2016 - 2028
- Figure 38:
- MIDDLE EAST & AFRICA SPECIALTY FERTILIZER MARKET, BY APPLICATION MODE, VALUE, USD, 2016 - 2028
- Figure 39:
- MIDDLE EAST & AFRICA SPECIALTY FERTILIZER MARKET, VOLUME SHARE(%), BY APPLICATION MODE, 2016 - 2028
- Figure 40:
- MIDDLE EAST & AFRICA SPECIALTY FERTILIZER MARKET, VALUE SHARE(%), BY APPLICATION MODE, 2016 - 2028
- Figure 41:
- MIDDLE EAST & AFRICA SPECIALTY FERTILIZER MARKET, BY APPLICATION MODE, FERTIGATION, METRIC TON, 2016 - 2028
- Figure 42:
- MIDDLE EAST & AFRICA SPECIALTY FERTILIZER MARKET, BY APPLICATION MODE, FERTIGATION, USD, 2016 - 2028
- Figure 43:
- MIDDLE EAST & AFRICA SPECIALTY FERTILIZER MARKET, VALUE SHARE(%), BY SPECIALITY TYPE, 2016 - 2028
- Figure 44:
- MIDDLE EAST & AFRICA SPECIALTY FERTILIZER MARKET, BY APPLICATION MODE, FOLIAR, METRIC TON, 2016 - 2028
- Figure 45:
- MIDDLE EAST & AFRICA SPECIALTY FERTILIZER MARKET, BY APPLICATION MODE, FOLIAR, USD, 2016 - 2028
- Figure 46:
- MIDDLE EAST & AFRICA SPECIALTY FERTILIZER MARKET, VALUE SHARE(%), BY SPECIALITY TYPE, 2016 - 2028
- Figure 47:
- MIDDLE EAST & AFRICA SPECIALTY FERTILIZER MARKET, BY APPLICATION MODE, SOIL, METRIC TON, 2016 - 2028
- Figure 48:
- MIDDLE EAST & AFRICA SPECIALTY FERTILIZER MARKET, BY APPLICATION MODE, SOIL, USD, 2016 - 2028
- Figure 49:
- MIDDLE EAST & AFRICA SPECIALTY FERTILIZER MARKET, VALUE SHARE(%), BY SPECIALITY TYPE, 2016 - 2028
- Figure 50:
- MIDDLE EAST & AFRICA SPECIALTY FERTILIZER MARKET, BY CROP TYPE, VOLUME, METRIC TON, 2016 - 2028
- Figure 51:
- MIDDLE EAST & AFRICA SPECIALTY FERTILIZER MARKET, BY CROP TYPE, VALUE, USD, 2016 - 2028
- Figure 52:
- MIDDLE EAST & AFRICA SPECIALTY FERTILIZER MARKET, VOLUME SHARE(%), BY CROP TYPE, 2016 - 2028
- Figure 53:
- MIDDLE EAST & AFRICA SPECIALTY FERTILIZER MARKET, VALUE SHARE(%), BY CROP TYPE, 2016 - 2028
- Figure 54:
- MIDDLE EAST & AFRICA SPECIALTY FERTILIZER MARKET, BY CROP TYPE, FIELD CROPS, METRIC TON, 2016 - 2028
- Figure 55:
- MIDDLE EAST & AFRICA SPECIALTY FERTILIZER MARKET, BY CROP TYPE, FIELD CROPS, USD, 2016 - 2028
- Figure 56:
- MIDDLE EAST & AFRICA SPECIALTY FERTILIZER MARKET, VALUE SHARE(%), BY SPECIALITY TYPE, 2016 - 2028
- Figure 57:
- MIDDLE EAST & AFRICA SPECIALTY FERTILIZER MARKET, BY CROP TYPE, HORTICULTURAL CROPS, METRIC TON, 2016 - 2028
- Figure 58:
- MIDDLE EAST & AFRICA SPECIALTY FERTILIZER MARKET, BY CROP TYPE, HORTICULTURAL CROPS, USD, 2016 - 2028
- Figure 59:
- MIDDLE EAST & AFRICA SPECIALTY FERTILIZER MARKET, VALUE SHARE(%), BY SPECIALITY TYPE, 2016 - 2028
- Figure 60:
- MIDDLE EAST & AFRICA SPECIALTY FERTILIZER MARKET, BY CROP TYPE, TURF & ORNAMENTAL, METRIC TON, 2016 - 2028
- Figure 61:
- MIDDLE EAST & AFRICA SPECIALTY FERTILIZER MARKET, BY CROP TYPE, TURF & ORNAMENTAL, USD, 2016 - 2028
- Figure 62:
- MIDDLE EAST & AFRICA SPECIALTY FERTILIZER MARKET, VALUE SHARE(%), BY SPECIALITY TYPE, 2016 - 2028
- Figure 63:
- MIDDLE EAST & AFRICA SPECIALTY FERTILIZER MARKET, BY COUNTRY, VOLUME, METRIC TON, 2016 - 2028
- Figure 64:
- MIDDLE EAST & AFRICA SPECIALTY FERTILIZER MARKET, BY COUNTRY, VALUE, USD, 2016 - 2028
- Figure 65:
- MIDDLE EAST & AFRICA SPECIALTY FERTILIZER MARKET, VOLUME SHARE(%), BY COUNTRY, 2016 - 2028
- Figure 66:
- MIDDLE EAST & AFRICA SPECIALTY FERTILIZER MARKET, VALUE SHARE(%), BY COUNTRY, 2016 - 2028
- Figure 67:
- MIDDLE EAST & AFRICA SPECIALTY FERTILIZER MARKET, BY COUNTRY, NIGERIA, METRIC TON, 2016 - 2028
- Figure 68:
- MIDDLE EAST & AFRICA SPECIALTY FERTILIZER MARKET, BY COUNTRY, NIGERIA, USD, 2016 - 2028
- Figure 69:
- MIDDLE EAST & AFRICA SPECIALTY FERTILIZER MARKET, VALUE SHARE(%), BY CROP TYPE, 2016 - 2028
- Figure 70:
- MIDDLE EAST & AFRICA SPECIALTY FERTILIZER MARKET, BY COUNTRY, SAUDI ARABIA, METRIC TON, 2016 - 2028
- Figure 71:
- MIDDLE EAST & AFRICA SPECIALTY FERTILIZER MARKET, BY COUNTRY, SAUDI ARABIA, USD, 2016 - 2028
- Figure 72:
- MIDDLE EAST & AFRICA SPECIALTY FERTILIZER MARKET, VALUE SHARE(%), BY CROP TYPE, 2016 - 2028
- Figure 73:
- MIDDLE EAST & AFRICA SPECIALTY FERTILIZER MARKET, BY COUNTRY, SOUTH AFRICA, METRIC TON, 2016 - 2028
- Figure 74:
- MIDDLE EAST & AFRICA SPECIALTY FERTILIZER MARKET, BY COUNTRY, SOUTH AFRICA, USD, 2016 - 2028
- Figure 75:
- MIDDLE EAST & AFRICA SPECIALTY FERTILIZER MARKET, VALUE SHARE(%), BY CROP TYPE, 2016 - 2028
- Figure 76:
- MIDDLE EAST & AFRICA SPECIALTY FERTILIZER MARKET, BY COUNTRY, TURKEY, METRIC TON, 2016 - 2028
- Figure 77:
- MIDDLE EAST & AFRICA SPECIALTY FERTILIZER MARKET, BY COUNTRY, TURKEY, USD, 2016 - 2028
- Figure 78:
- MIDDLE EAST & AFRICA SPECIALTY FERTILIZER MARKET, VALUE SHARE(%), BY CROP TYPE, 2016 - 2028
- Figure 79:
- MIDDLE EAST & AFRICA SPECIALTY FERTILIZER MARKET, BY COUNTRY, REST OF MIDDLE EAST & AFRICA, METRIC TON, 2016 - 2028
- Figure 80:
- MIDDLE EAST & AFRICA SPECIALTY FERTILIZER MARKET, BY COUNTRY, REST OF MIDDLE EAST & AFRICA, USD, 2016 - 2028
- Figure 81:
- MIDDLE EAST & AFRICA SPECIALTY FERTILIZER MARKET, VALUE SHARE(%), BY CROP TYPE, 2016 - 2028
- Figure 82:
- MIDDLE EAST & AFRICA SPECIALTY FERTILIZER MARKET, MOST ACTIVE COMPANIES, BY NUMBER OF STRATEGIC MOVES, 2018 - 2021
- Figure 83:
- MIDDLE EAST & AFRICA SPECIALTY FERTILIZER MARKET, MOST ADOPTED STRATEGIES, 2018 - 2021
- Figure 84:
- MIDDLE EAST & AFRICA SPECIALTY FERTILIZER MARKET SHARE(%), BY MAJOR PLAYERS, 2021
MEA Specialty Fertilizer Industry Segmentation
CRF, Liquid Fertilizer, SRF, Water Soluble are covered as segments by Speciality Type. Fertigation, Foliar, Soil are covered as segments by Application Mode. Field Crops, Horticultural Crops, Turf & Ornamental are covered as segments by Crop Type. Nigeria, Saudi Arabia, South Africa, Turkey are covered as segments by Country.| Speciality Type | |||||
| |||||
| Liquid Fertilizer | |||||
| SRF | |||||
| Water Soluble |
| Application Mode | |
| Fertigation | |
| Foliar | |
| Soil |
| Crop Type | |
| Field Crops | |
| Horticultural Crops | |
| Turf & Ornamental |
| Country | |
| Nigeria | |
| Saudi Arabia | |
| South Africa | |
| Turkey | |
| Rest Of Middle East & Africa |
Market Definition
- AVERAGE NUTRIENT APPLICATION RATE - This refers to the average volume of nutrient consumed per hectare of farmland in each country.
- CROP TYPES COVERED - Field Crops: Cereals, Pulses, Oilseeds, Fiber Crops, and Forage Crops, Horticulture: Fruits, Vegetables, Plantation Crops and Spices, Turf Grass and Ornamentals
- MARKET ESTIMATION LEVEL - Market Estimations for various types of fertilizers has been done at the product-level and not at the nutrient-level.
- NUTRIENT TYPES COVERED - Primary Nutrients: N, P and K, Secondary Macronutrients: Ca, Mg and S, Micronutients: Zn, Mn, Cu, Fe, Mo, B, and Others
Research Methodology
Mordor Intelligence follows a four-step methodology in all our reports.
- Step-1: Identify Key Variables: In order to build a robust forecasting methodology, the variables and factors identified in Step-1 are tested against available historical market numbers. Through an iterative process, the variables required for market forecast are set and the model is built on the basis of these variables.
- Step-2: Build a Market Model: Market-size estimations for the forecast years are in nominal terms. Inflation is not a part of the pricing, and the average selling price (ASP) is kept constant throughout the forecast period for each country.
- Step-3: Validate and Finalize: In this important step, all market numbers, variables and analyst calls are validated through an extensive network of primary research experts from the market studied. The respondents are selected across levels and functions to generate a holistic picture of the market studied.
- Step-4: Research Outputs: Syndicated Reports, Custom Consulting Assignments, Databases & Subscription Platforms


