Anomaly Detection Market Size and Share
Market Overview
| Study Period | 2020 - 2031 |
|---|---|
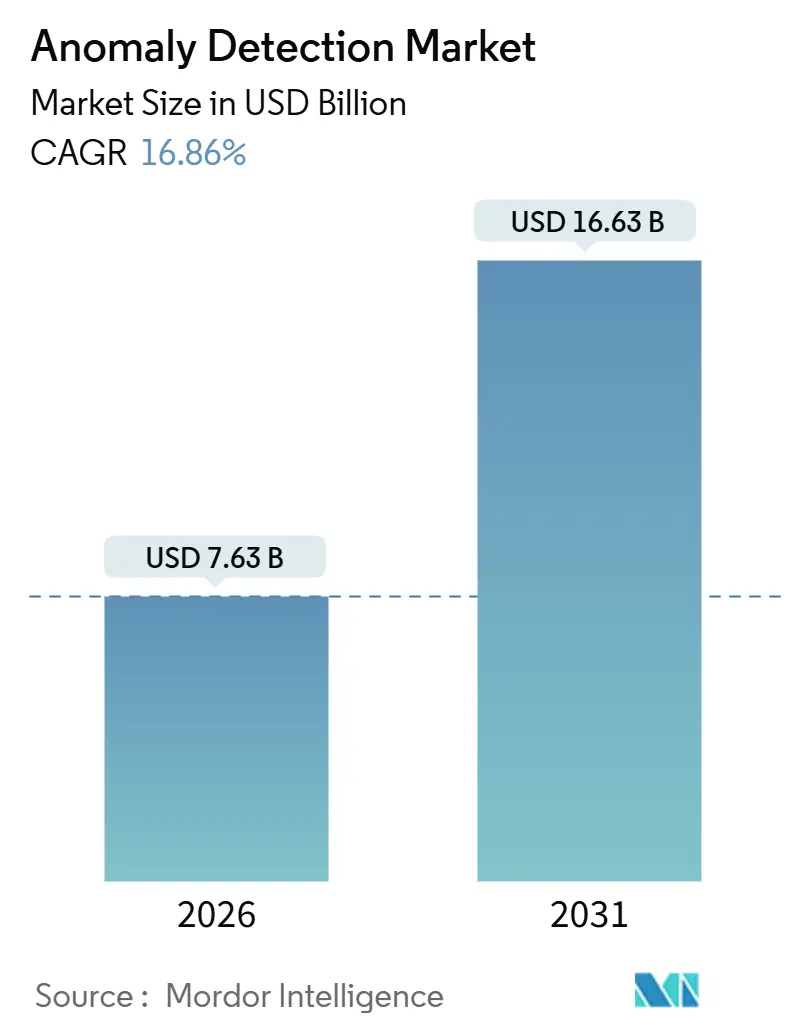
| Market Size (2026) | USD 7.63 Billion |
| Market Size (2031) | USD 16.63 Billion |
| Growth Rate (2026 - 2031) | 16.86% CAGR |
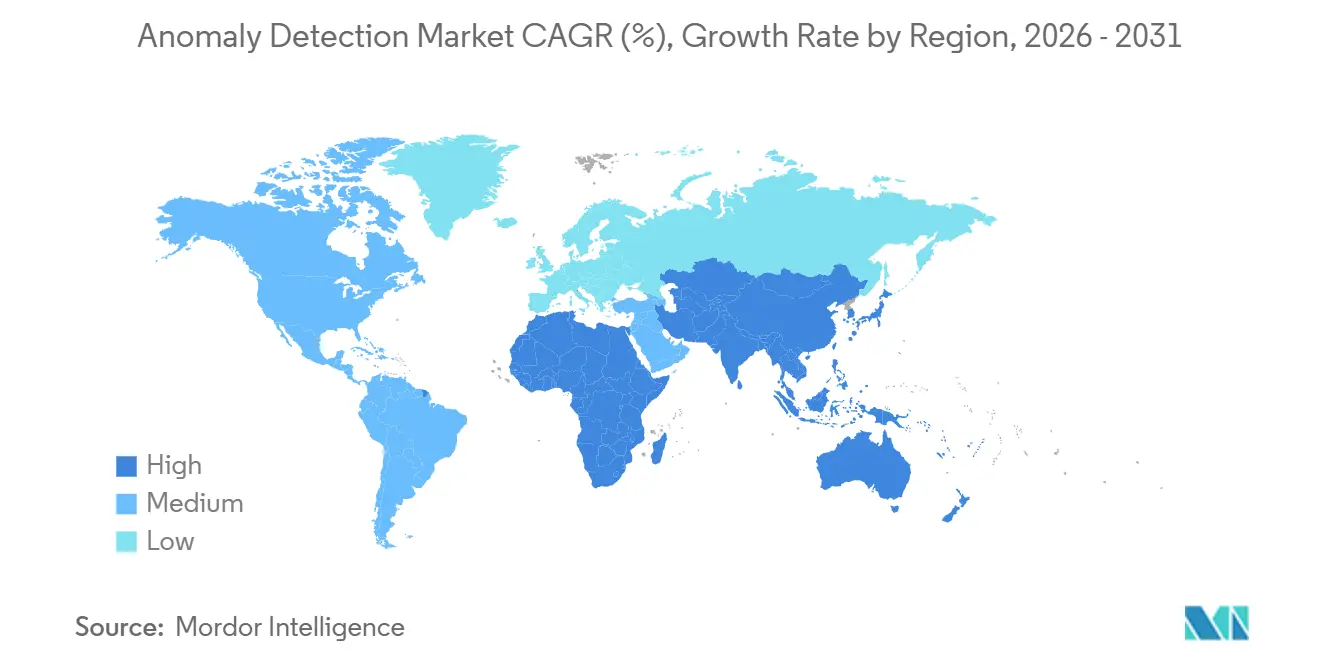
| Fastest Growing Market | Asia Pacific |
| Largest Market | North America |
| Market Concentration | Medium |
Major Players *Disclaimer: Major Players sorted in no particular order Image © Mordor Intelligence. Reuse requires attribution under CC BY 4.0. | |
Anomaly Detection Market Analysis by Mordor Intelligence
The anomaly detection market size reached USD 7.63 billion in 2026 and is projected to rise to USD 16.63 billion by 2031, translating into a robust 16.86% CAGR over the forecast period. This sustained expansion reflects the simultaneous impact of escalating cyberattacks on operational technology, government mandates embedding behavioral analytics into zero-trust programs, and new edge-AI chips that deliver millisecond-latency detection at the device layer. Demand is also reinforced by mounting fraud losses in banking and payment networks, the surge of connected sensors across smart factories and cities, and a shortage of skilled cybersecurity talent that pushes enterprises toward automated, AI-driven defenses. Competitive intensity is increasing as cloud hyperscalers weave anomaly detection into bundled platform services, squeezing standalone vendors on price while encouraging them to differentiate through managed services, privacy-preserving federated learning, and industry-specific content libraries.
Key Report Takeaways
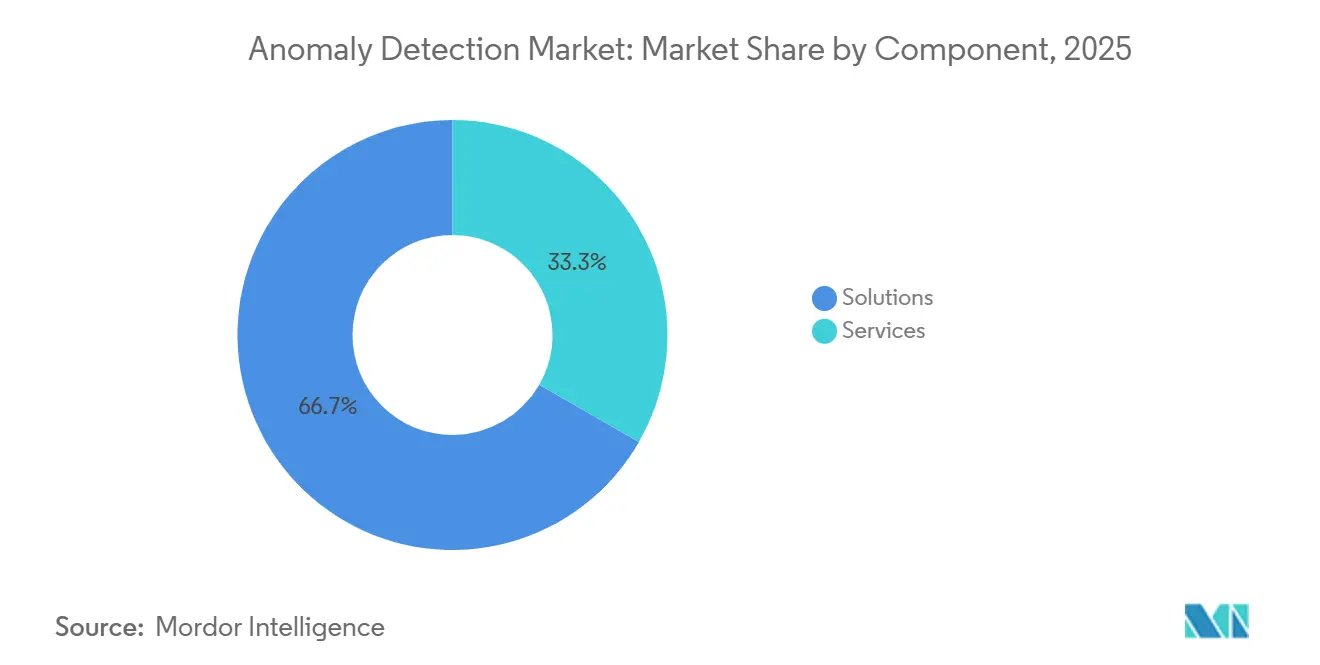
- By component, solutions led with 66.71% revenue share in 2025; services are expected to expand at a 17.11% CAGR through 2031.
- By deployment, cloud accounted for 58.91% of the anomaly detection market share in 2025, while hybrid models are poised to grow at a 17.39% CAGR over the same period.
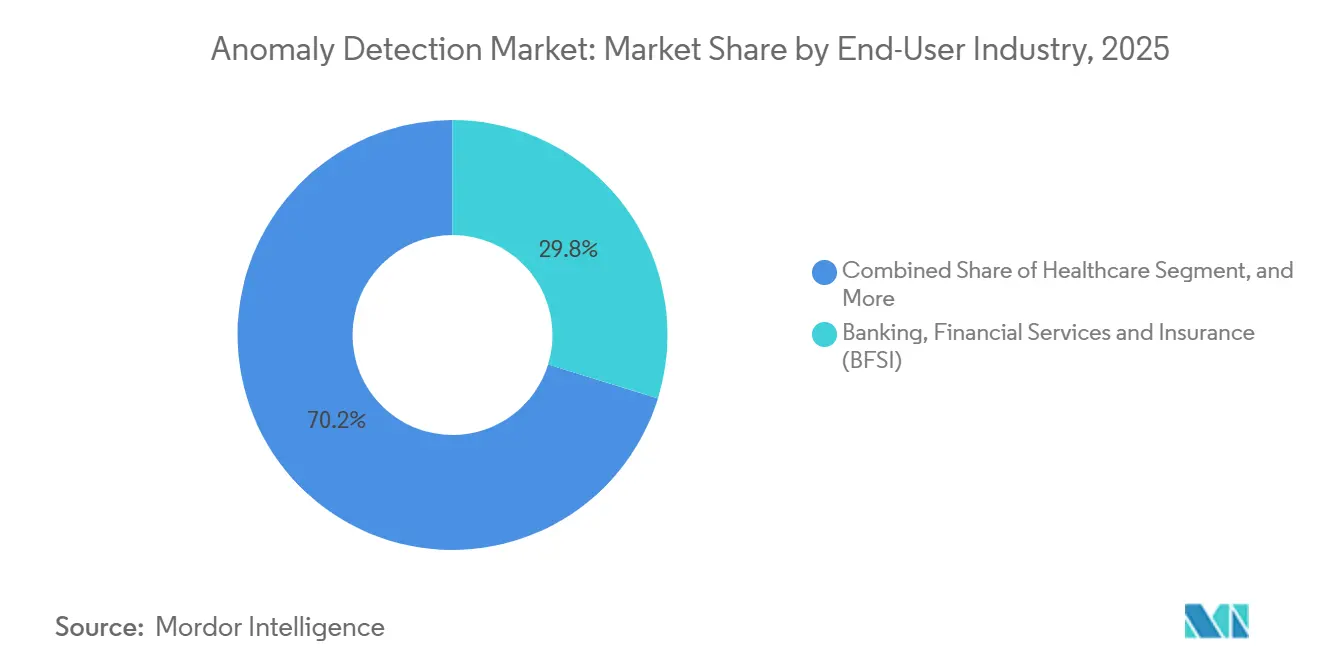
- By end-user industry, banking, financial services, and insurance captured a 29.78% share in 2025; healthcare is projected to register the fastest 17.93% CAGR to 2031.
- By technology, machine learning and artificial intelligence accounted for 47.83% in 2025 and are forecast to maintain a 17.57% CAGR during the outlook period.
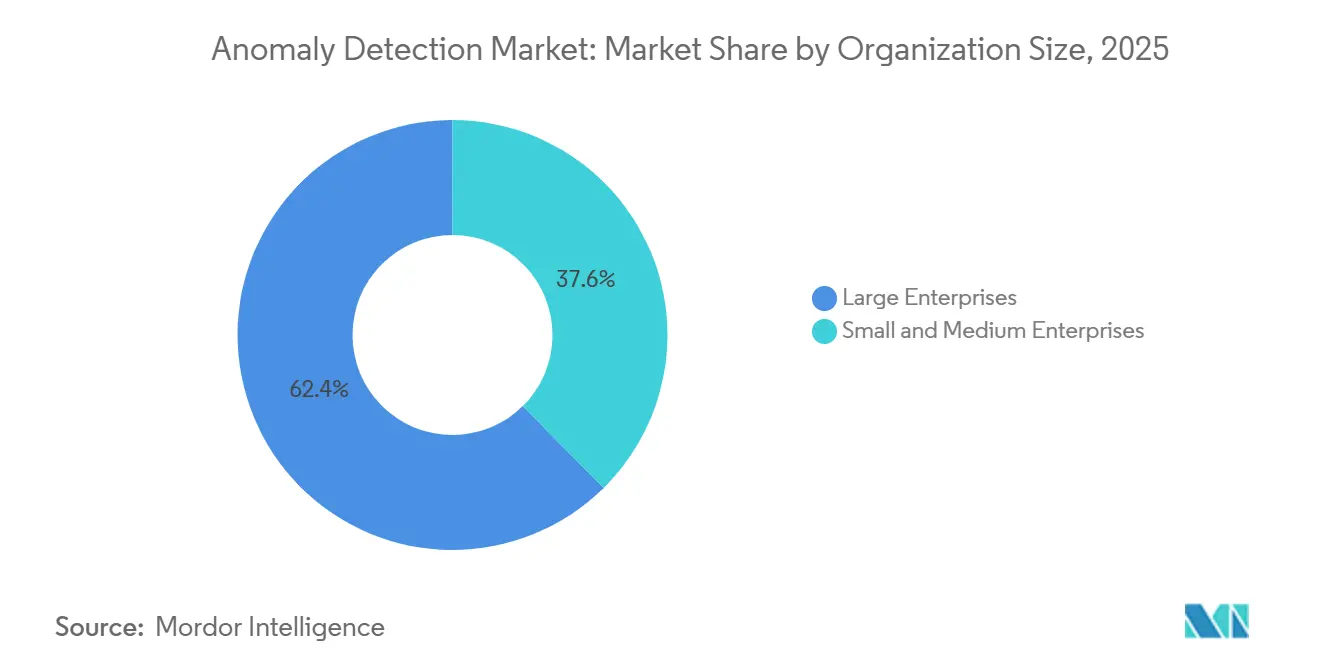
- By organization size, large enterprises held a 62.41% share in 2025, whereas small and medium enterprises are set to advance at a 17.16% CAGR through 2031.
- By application, fraud detection led with a 36.77% share in 2025; intrusion detection is anticipated to accelerate at a 17.89% CAGR through 2031.
- By geography, North America commanded a 39.83% share in 2025, and Asia-Pacific is expected to record the highest CAGR of 17.82% over the forecast horizon.
Note: Market size and forecast figures in this report are generated using Mordor Intelligence’s proprietary estimation framework, updated with the latest available data and insights as of January 2026.
Market Trends and Insights
Drivers Impact Analysis of Anomaly Detection Market*
| Driver | (~) % Impact on CAGR Forecast | Geographic Relevance | Impact Timeline |
|---|---|---|---|
| Increasing Number of Cyberattacks Targeting Critical Infrastructure | +3.2% | North America and Europe, expanding globally | Medium term (2-4 years) |
| Growing Adoption of Anomaly Detection in Fraud Prevention Across BFSI | +2.8% | North America and Asia-Pacific financial hubs | Short term (≤ 2 years) |
| Proliferation of IoT Devices Expanding Attack Surface | +2.4% | Asia-Pacific manufacturing corridors, North America smart cities | Medium term (2-4 years) |
| Convergence of AIOps with Anomaly Detection to Enable Autonomous Incident Response | +2.1% | North America and Europe enterprise IT estates | Long term (≥ 4 years) |
| Rise of Edge AI Chips Enabling Real-Time On-Device Anomaly Analytics | +1.9% | Asia-Pacific electronics supply chains, global automotive sector | Long term (≥ 4 years) |
| Mandatory Behavioral Monitoring in Zero-Trust Frameworks Rolled Out by Governments | +2.7% | U.S. federal agencies, EU member states | Short term (≤ 2 years) |
| Source: Mordor Intelligence | |||
Increasing Number of Cyberattacks Targeting Critical Infrastructure
Cyber adversaries shifted from IT to operational technology in 2024 and 2025, exploiting the convergence of plant-floor networks with enterprise systems. The U.S. Department of Energy logged 387 incidents against electric utilities in 2024, 41% higher than 2023, and 68% involved anomalous control commands that bypassed signature-based tools.[1]U.S. Department of Energy, “Cyber Incident Reporting for the Energy Sector,” DOE, energy.gov Subsequent directives from the Transportation Security Administration require pipeline operators to deploy continuous anomaly monitoring, accelerating uptake in sectors historically reliant on air-gapped defenses. Updated IEC 62443 guidance positions anomaly detection as a compensating control when patching legacy controllers is infeasible, driving new projects in utilities and manufacturing where equipment lifecycles exceed 20 years.
Growing Adoption of Anomaly Detection in Fraud Prevention Across BFSI
Instant payment schemes and open banking APIs widened the fraud surface, prompting banks to embrace behavioral analytics that flag deviations in device, geolocation, and transaction velocity. The FedNow service processed 74 million transactions worth USD 45 billion in 2025, and its irreversibility heightened institutions’ risk tolerance.[2]Board of Governors of the Federal Reserve System, “2025 Payments Fraud Survey,” Federal Reserve, federalreserve.gov JPMorgan Chase spent USD 2.1 billion on fraud-prevention technology in 2025, reporting a 34% drop in false positives after deploying anomaly-detection algorithms. Europe’s revised Payment Services Directive compels strong customer authentication with real-time risk scoring, further embedding anomaly detection in core banking platforms.
Proliferation of IoT Devices Expanding Attack Surface
The global installed base of connected devices hit 16.7 billion in 2025, 43% of which reside in industrial and smart-city settings. Many sensors lack the compute or memory to host traditional security agents, so network-level anomaly detection steps in to spot aberrant traffic from compromised endpoints. Siemens integrated such analytics into its MindSphere IoT platform and cited a 28% reduction in unplanned downtime on automotive assembly lines during 2025.[3]Siemens AG, “Annual Report 2025,” Siemens, siemens.com U.S. federal procurement guidance now lists continuous monitoring as a baseline requirement for IoT devices, pushing adoption across defense and public-sector fleets.
Convergence of AIOps with Anomaly Detection to Enable Autonomous Incident Response
Enterprises managing sprawling hybrid-cloud estates face alert fatigue, with legacy SIEMs generating thousands of daily events. AIOps platforms embed anomaly detection, automatically isolate impacted workloads, and roll back misconfigurations. Cisco reported that organizations using such integrated workflows cut mean time to remediation by 62% in 2025. The approach is especially valuable for Kubernetes clusters, where ephemeral containers give attackers transient footholds that evade static policies. Red Hat’s OpenShift 4.15 release instrumented eBPF hooks to surface microsecond-level anomalies in system calls, reinforcing the move from perimeter defense to runtime protection.
Restraints Impact Analysis of Anomaly Detection Market*
| Restraint | (~) % Impact on CAGR Forecast | Geographic Relevance | Impact Timeline |
|---|---|---|---|
| Availability of Robust Open-Source Anomaly Detection Libraries Reducing Paid License Uptake | -1.8% | Global, developer-centric SME segment | Short term (≤ 2 years) |
| Shortage of Skilled Data Scientists Capable of Tuning Models | -2.3% | Emerging markets and mid-sized enterprises worldwide | Medium term (2-4 years) |
| Model Drift in Dynamic Data Environments Increasing Maintenance Costs | -1.6% | Cloud-native finance and trading firms | Long term (≥ 4 years) |
| Privacy Regulations Limiting Access to High-Granularity Data for Behavioral Analytics | -1.4% | EU under GDPR, California under CCPA | Medium term (2-4 years) |
| Source: Mordor Intelligence | |||
Availability of Robust Open-Source Anomaly Detection Libraries Reducing Paid License Uptake
Production-ready frameworks such as PyOD and Alibi Detect amassed a broad developer following, with PyOD surpassing 8,200 GitHub stars by December 2025. Small firms with lean budgets increasingly opt for these tools, especially for performance monitoring and predictive maintenance. Although open-source lacks enterprise support and compliance certifications, community contributions keep pace with proprietary feature sets, compressing vendor pricing at the lower end of the market. The Linux Foundation’s Adversarial Robustness Toolbox, launched in 2024, further commoditizes baseline anomaly detection and exerts downward pressure on license revenues.
Shortage of Skilled Data Scientists Capable of Tuning Models
Deploying anomaly detection in production demands expertise in feature engineering and continuous retraining. The U.S. Bureau of Labor Statistics expects demand for data scientists to grow 36% between 2023 and 2033, outstripping supply, with median salaries reaching USD 142,000 in 2025. Mid-sized enterprises struggle to match compensation packages offered by hyperscalers and banks, leading to under-tuned models that generate excessive false positives and degrade analyst trust. Managed security providers help fill the gap but introduce latency and data-sovereignty issues in regulated sectors such as healthcare and defense.
*Our forecasts treat driver/restraint impacts as directional, not additive. The impact forecasts reflect baseline growth, mix effects, and variable interactions.
Anomaly Detection Market Segment Analysis
By Component:
Services Gain as Model Complexity Outpaces Internal ExpertiseSolutions dominated the anomaly detection market with a 66.71% share in 2025, reflecting widespread deployment of network behavior analytics and user behavior analytics across cloud and on-premises environments. However, services revenue is rising at a 17.11% CAGR through 2031 as organizations seek external expertise to fine-tune algorithms, integrate outputs into security orchestration and response playbooks, and combat model drift. Professional services became a strategic revenue stream for platform vendors; Splunk recorded 22% year-over-year growth in its services line during 2025. Managed services appeal to small and medium enterprises lacking security operations centers, offering 24/7 monitoring on a subscription basis.
Demand for operational support stems from rising model complexity. Transformer-based detectors require domain-specific feature engineering, hyperparameter tuning, and periodic retraining to handle evolving traffic patterns. Enterprises increasingly bundle ongoing advisory contracts with initial software purchases, elevating the importance of services in total contract value. The trend favors vendors able to provide certified personnel and outcome-based service-level agreements, thereby locking in recurring revenue while customers focus on core business priorities.


By Deployment:
Hybrid Architectures Balance Compliance and ScalabilityCloud deployments held 58.91% of the anomaly detection market share in 2025 because elastic compute enables petabyte-scale model training. Yet hybrid architectures, expanding at a 17.39% CAGR, are emerging as the default among regulated industries that must retain sensitive telemetry on-premises. The European Union’s Digital Operational Resilience Act obliges financial firms to ensure continuity even if a cloud vendor fails, prompting rollouts in which inference engines run on local appliances and aggregated features are sent to the cloud for model development.
This pattern optimizes latency and cost by eliminating raw-data egress while exploiting cloud-scale learning. Manufacturers with high-frequency sensor caches keep operational data in factories, train models in regional cloud zones, and then push compressed weights back to edge gateways. Such workflows help organizations comply with data-sovereignty statutes in India, Germany, and Canada, while maintaining access to advanced AI frameworks available only in public clouds.
By End-User Industry:
Healthcare Acceleration Driven by Regulation and RansomwareBFSI maintained the largest share of the anomaly detection market at 29.78% in 2025, driven by escalating fraud, anti-money laundering scrutiny, and open banking exposures. Healthcare is the fastest-growing vertical at a 17.93% CAGR. Ransomware encrypted patient records at 46 U.S. hospitals during 2024, triggering tighter HIPAA security-rule amendments that require real-time monitoring of electronic health-record access. Providers adopt user behavior analytics to curb insider misuse and pre-empt data exfiltration, generating sizable opportunities for vendors fluent in clinical workflows.
Manufacturing leverages anomaly detection for predictive maintenance, flagging sensor telemetry that signals impending machinery failure. Government and defense agencies employ high-assurance deployments to detect insider threats on classified networks, while retail and e-commerce firms focus on payment fraud and credential stuffing ahead of PCI-DSS 4.0 enforcement in 2025. Cross-industry demand is expanding as smart buildings, connected vehicles, and energy grids converge IT with operational technology, creating unified threat surfaces that require behavioral analytics for early warning.

By Technology:
Machine Learning Dominance Reflects Accuracy GainsMachine learning and artificial intelligence technologies accounted for 47.83% of 2025 revenue and are forecast to grow at a 17.57% CAGR, outpacing statistical methods. Transformer architectures excel at high-dimensional time-series analysis, detecting subtle deviations in seasonally variable baselines. Google’s Vertex AI anomaly detection model achieved 94% precision on benchmark datasets in 2025, demonstrating enterprise-ready accuracy.
Statistical techniques remain relevant when compute or memory constraints limit model size, as in embedded controllers. Big data platforms ingest multiterabit pipelines from IoT and cloud logs to feed training clusters, while explainable AI adds transparency demanded by safety-critical sectors under the IEEE 2830-2021 standard. Vendors integrate causal analysis and narrative summaries to help analysts swiftly validate alerts, mitigating fatigue and enabling lean security teams to prioritize high-risk deviations.
By Organization Size:
SME Growth Fueled by Managed Services and Consumption PricingLarge enterprises held 62.41% of the anomaly detection market share in 2025, thanks to their sizable budgets and 24/7 security operations centers. Small and medium enterprises are closing the gap, adopting at a 17.16% CAGR thanks to consumption-based pricing models from managed detection and response providers. Cisco SecureX bundles anomaly detection, threat intelligence, and incident response under per-user subscriptions, allowing firms with fewer than 500 employees to access enterprise-grade defenses without capital expenditure.
The U.S. Small Business Administration noted that 43% of cyberattacks in 2024 targeted small businesses, yet only 14% had continuous monitoring in place. Cloud-delivered analytics and remote SOC services democratize adoption, though data-sovereignty and latency considerations still prompt some SMEs in finance and healthcare to keep critical telemetry on-premises, favoring hybrid service models.
By Application:
Intrusion Detection Surge Reflects Proactive Threat HuntingFraud detection led with 36.77% market share in 2025, but intrusion detection is accelerating at a 17.89% CAGR as organizations adopt threat-hunting practices that target adversaries during reconnaissance rather than post-breach. Aligning detections to MITRE ATT&CK techniques helps analysts correlate anomalous process execution, lateral movement, and privilege escalation into cohesive attack stories.
Fault detection supports predictive maintenance in manufacturing, while data-exfiltration analytics protect intellectual property in pharmaceuticals and semiconductors. Supply-chain monitoring and insider-threat programs constitute emerging applications as geopolitical tensions and hybrid work expand risk perimeters. The NSA’s 2024 advisory elevated anomaly detection to a recommended primary control for insider-threat mitigation in federal systems.
Geography Analysis
North America Anomaly Detection Market
North America accounted for 39.83% of the anomaly detection market share in 2025, driven by stringent breach-notification laws and mature threat intelligence networks. U.S. federal agencies must deploy behavioral analytics in accordance with OMB Memorandum 22-09 by fiscal 2026. Canada’s amended privacy act imposes similar obligations on financial services and healthcare providers, expanding domestic demand.
APAC Anomaly Detection Market
Asia-Pacific is the fastest-growing region at a 17.82% CAGR. China’s 2024 cybersecurity law amendments require critical information infrastructure operators to install anomaly detection systems, while India’s Digital Personal Data Protection Act mandates behavioral monitoring for cross-border transfers. Japan’s Ministry of Economy, Trade, and Industry issued connected-industry guidelines recommending the use of anomaly detection in automotive and electronics plants. South Korea’s privacy regulator levied USD 6.1 million in fines during 2025 for inadequate monitoring, prompting broader adoption in telecommunications and e-commerce.
Europe Anomaly Detection Market
Europe balances strong privacy protections with growing cyber-resilience mandates. NIS2 requires essential-service operators to build continuous monitoring, yet GDPR’s data-minimization principle restricts access to granular behavioral logs, spurring the development of on-premises and federated learning models. Germany’s BSI guidelines recognize anomaly detection as a compensating control for legacy industrial controllers, thereby boosting adoption in chemical and automotive clusters. The U.K. National Cyber Security Centre reported 68% of large firms had deployed anomaly detection by 2025, up from 54% in 2024.
MEA and South America Anomaly Detection Market
The Middle East and Africa, along with South America, represent emerging pockets of demand tied to national cybersecurity strategies. The United Arab Emirates and Saudi Arabia mandate continuous monitoring for critical infrastructure, accelerating projects in energy and transportation. Brazil’s data-protection authority published guidance in 2024 that endorses behavioral analytics for unauthorized-access detection, catalyzing deployments in banking and healthcare.

Competitive Landscape
The anomaly detection market is moderately fragmented. Cloud hyperscalers Amazon Web Services, Microsoft, and Google embed anomaly detection into infrastructure security suites, leveraging scale economics that pressure specialized vendors on price. Traditional security suppliers such as IBM, Cisco, and Broadcom integrate behavioral analytics into SIEM and network-monitoring stacks, courting enterprises with entrenched vendor relationships.
Specialists, including Splunk, Darktrace, and Securonix, differentiate through advanced algorithms, verticalized content packs, and managed detection and response services. Open-source libraries commoditize baseline capabilities, compelling vendors to innovate on explainability, low-code customization, and privacy-preserving federated learning. IBM’s 2024 patent on decentralized model training exemplifies this pivot toward privacy-centric architectures.
Mergers and acquisitions intensify competitive realignment. Cisco’s USD 28 billion purchase of Splunk in September 2025 merges deep security telemetry with network visibility, while Microsoft’s Security Copilot layers large-language-model explanations onto anomaly findings. Edge-AI startups target automotive and industrial IoT with lightweight inference engines that cut cloud dependency. Collectively, these moves underscore a market where value shifts from detection algorithms to integrated, automated response and regulatory compliance.
Anomaly Detection Industry Leaders
IBM Corporation
Cisco Systems Inc.
Microsoft Corporation
Broadcom Inc.
SAS Institute Inc.
- *Disclaimer: Major Players sorted in no particular order

Anomaly Detection Market Companies Covered in this Report
- IBM Corporation
- Cisco Systems Inc.
- Microsoft Corporation
- Splunk Inc.
- Broadcom Inc.
- SAS Institute Inc.
- Trend Micro Incorporated
- Wipro Limited
- Verint Systems Inc.
- Guardian Analytics Inc.
- Securonix Inc.
- Gurucul Solutions, LLC
- Anodot Ltd.
- Happiest Minds Technologies Pvt. Ltd.
- Hewlett Packard Enterprise Company
- Dell Technologies Inc.
- Google LLC
- Amazon Web Services Inc.
- Rapid7 Inc.
- Micro Focus International plc
- LogRhythm Inc.

Recent Industry Developments in Anomaly Detection Market
- October 2025: Microsoft released Security Copilot’s anomaly detection update that pairs large-language models with behavioral analytics to accelerate root-cause triage.
- September 2025: Cisco closed its USD 28 billion acquisition of Splunk, pledging rapid integration between Splunk Enterprise Security and Cisco Talos threat-intelligence feeds.
- August 2025: Amazon Web Services introduced GuardDuty Malware Protection for S3, combining machine-learning-based anomaly detection with signature scans for cloud object storage.
- July 2025: IBM enhanced QRadar SIEM with federated user behavior analytics to meet data-sovereignty requirements in multi-cloud environments.


Global Anomaly Detection Market Report Scope
The Anomaly Detection Market Report is Segmented by Component (Solutions, and Services), Deployment (On-Premise, Cloud, Hybrid), End-user Industry (Banking, Financial Services and Insurance (BFSI), Manufacturing, Healthcare, IT and Telecommunications, Government and Defense, Retail and Ecommerce), Technology (Machine Learning and Artificial Intelligence, Big Data Analytics, Data Mining and Business Intelligence, Statistical Methods), Organization Size (Small and Medium Enterprises, and Large Enterprises), Application (Fraud Detection, Intrusion Detection, Fault Detection and Monitoring, Data Exfiltration Detection, Other Applications), and Geography (North America, Europe, Asia-Pacific, Middle East and Africa, South America). Market Forecasts are Provided in Terms of Value (USD).
Segmentation Overview
| Solutions | Network Behavior Anomaly Detection |
| User Behavior Anomaly Detection | |
| Services | Professional Services |
| Managed Services |
| On-Premise |
| Cloud |
| Hybrid |
| Banking, Financial Services and Insurance (BFSI) |
| Manufacturing |
| Healthcare |
| IT and Telecommunications |
| Government and Defense |
| Retail and Ecommerce |
| Machine Learning and Artificial Intelligence |
| Big Data Analytics |
| Data Mining and Business Intelligence |
| Statistical Methods |
| Small and Medium Enterprises |
| Large Enterprises |
| Fraud Detection |
| Intrusion Detection |
| Fault Detection and Monitoring |
| Data Exfiltration Detection |
| Other Applications |
| North America | United States | |
| Canada | ||
| Mexico | ||
| Europe | Germany | |
| United Kingdom | ||
| France | ||
| Russia | ||
| Rest of Europe | ||
| Asia-Pacific | China | |
| Japan | ||
| India | ||
| South Korea | ||
| Australia | ||
| Rest of Asia-Pacific | ||
| Middle East and Africa | Middle East | Saudi Arabia |
| United Arab Emirates | ||
| Rest of Middle East | ||
| Africa | South Africa | |
| Egypt | ||
| Rest of Africa | ||
| South America | Brazil | |
| Argentina | ||
| Rest of South America | ||
| By Component | Solutions | Network Behavior Anomaly Detection | |
| User Behavior Anomaly Detection | |||
| Services | Professional Services | ||
| Managed Services | |||
| By Deployment | On-Premise | ||
| Cloud | |||
| Hybrid | |||
| By End-user Industry | Banking, Financial Services and Insurance (BFSI) | ||
| Manufacturing | |||
| Healthcare | |||
| IT and Telecommunications | |||
| Government and Defense | |||
| Retail and Ecommerce | |||
| By Technology | Machine Learning and Artificial Intelligence | ||
| Big Data Analytics | |||
| Data Mining and Business Intelligence | |||
| Statistical Methods | |||
| By Organization Size | Small and Medium Enterprises | ||
| Large Enterprises | |||
| By Application | Fraud Detection | ||
| Intrusion Detection | |||
| Fault Detection and Monitoring | |||
| Data Exfiltration Detection | |||
| Other Applications | |||
| By Geography | North America | United States | |
| Canada | |||
| Mexico | |||
| Europe | Germany | ||
| United Kingdom | |||
| France | |||
| Russia | |||
| Rest of Europe | |||
| Asia-Pacific | China | ||
| Japan | |||
| India | |||
| South Korea | |||
| Australia | |||
| Rest of Asia-Pacific | |||
| Middle East and Africa | Middle East | Saudi Arabia | |
| United Arab Emirates | |||
| Rest of Middle East | |||
| Africa | South Africa | ||
| Egypt | |||
| Rest of Africa | |||
| South America | Brazil | ||
| Argentina | |||
| Rest of South America | |||


Key Questions Answered in the Report
What is the projected value of the anomaly detection market by 2031?
The anomaly detection market is forecast to reach USD 16.63 billion by 2031, reflecting a 16.86% CAGR.
Which end-user sector is expanding the fastest?
Healthcare leads growth at a 17.93% CAGR due to ransomware pressures and stricter HIPAA monitoring mandates.
Why are hybrid deployments gaining traction?
Hybrid models satisfy data-sovereignty rules by keeping raw telemetry on-premises while using cloud resources for model training, resulting in a 17.39% CAGR.
How are SMEs adopting anomaly detection despite limited budgets?
Managed detection and response providers offer subscription pricing that lowers upfront costs, driving SME adoption at a 17.16% CAGR.
What is driving the surge in intrusion-detection applications?
Organizations are shifting to proactive threat hunting with MITRE ATT&CK-aligned analytics, pushing intrusion detection to a 17.89% CAGR.
Which region is expected to grow the fastest?
Asia-Pacific is set to expand at 17.82% CAGR, propelled by new cybersecurity mandates in China, India, and Japan.
Page last updated on:


