Market Overview
| Study Period | 2021 - 2031 |
|---|---|
| Forecast Data Period | 2026 - 2031 |
| Base Year Market Size (2025) | USD 3.21 Billion |
| Market Size (2026) | USD 3.58 Billion |
| Market Size (2031) | USD 5.48 Billion |
| Growth Rate (2026 - 2031) | 8.89% CAGR |
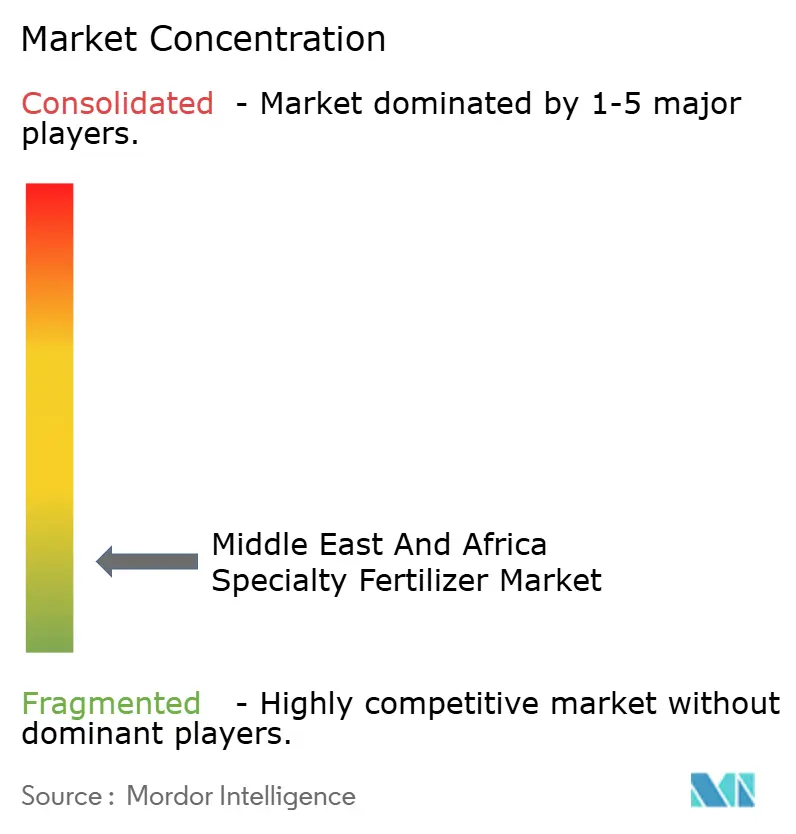
| Market Concentration | Low |
Major Players*Disclaimer: Major Players sorted in no particular order Image © Mordor Intelligence. Reuse requires attribution under CC BY 4.0. | |

Middle East and Africa Specialty Fertilizer Market Analysis by Mordor Intelligence
The Middle East and Africa specialty fertilizer market size is projected to grow from USD 3.21 billion in 2025 to USD 3.58 billion in 2026 and is forecast to reach USD 5.48 billion by 2031, registering a CAGR of 8.89% during 2026–2031. Robust public-sector food-security programs, rapid adoption of controlled-environment agriculture, and rising investment in fertigation infrastructure jointly sustain this growth outlook. The specialty fertilizer market continues to benefit from Saudi Vision 2030, Morocco’s downstream phosphate strategy, and South Africa’s climate-smart farming incentives. Liquid formulations dominate current demand because they align with automated delivery equipment, while next-generation polymer-coated products gain momentum as growers seek longer nutrient release and lower labor inputs. Competitive rivalry remains intense due to limited entry barriers and fast technology diffusion, yet regional integration of mining, green ammonia, and downstream blending offers cost advantages for vertically integrated players.
Key Report Takeaways
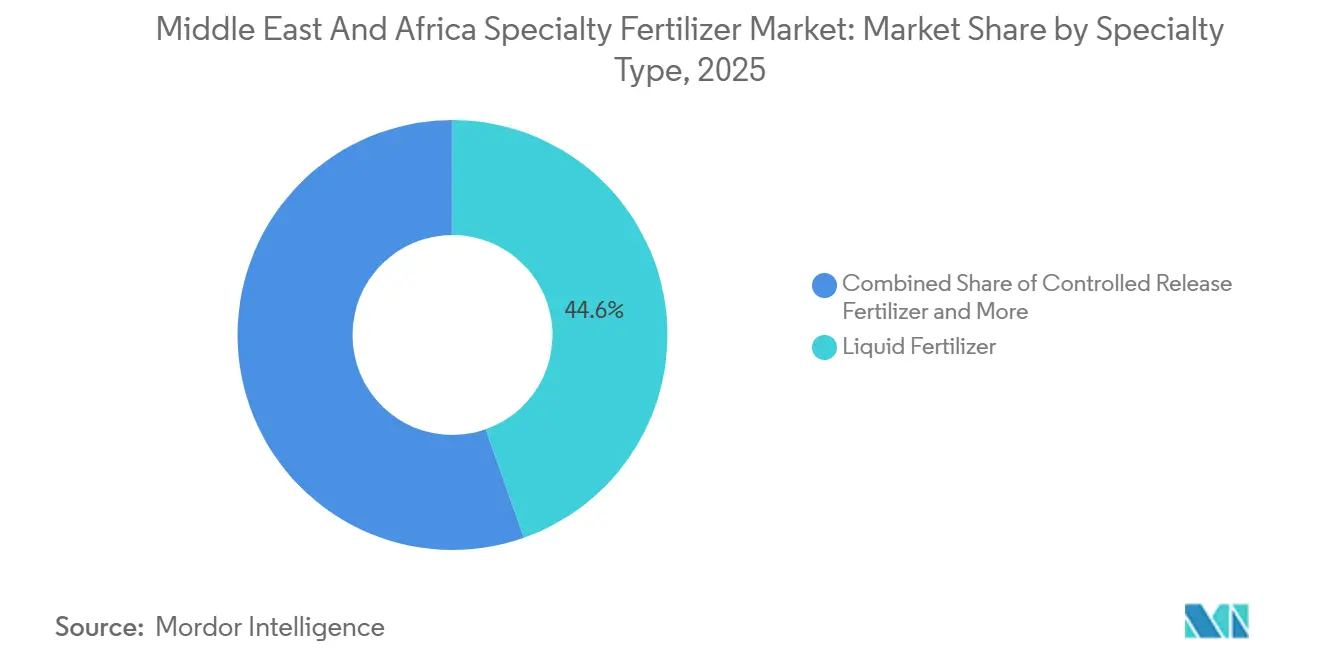
- By specialty type, liquid fertilizers led with a 44.6% of the Middle East and Africa specialty fertilizer market share in 2025, while polymer-coated controlled-release fertilizers are projected to be the fastest-growing segment, registering a CAGR of 9.3% during 2026–2031.
- By application mode, fertigation accounted for the largest Middle East and Africa specialty fertilizer market size, representing 46.1% of the market in 2025, while soil application is forecast to be the fastest-growing segment, expanding at a CAGR of 8.4% through 2031.
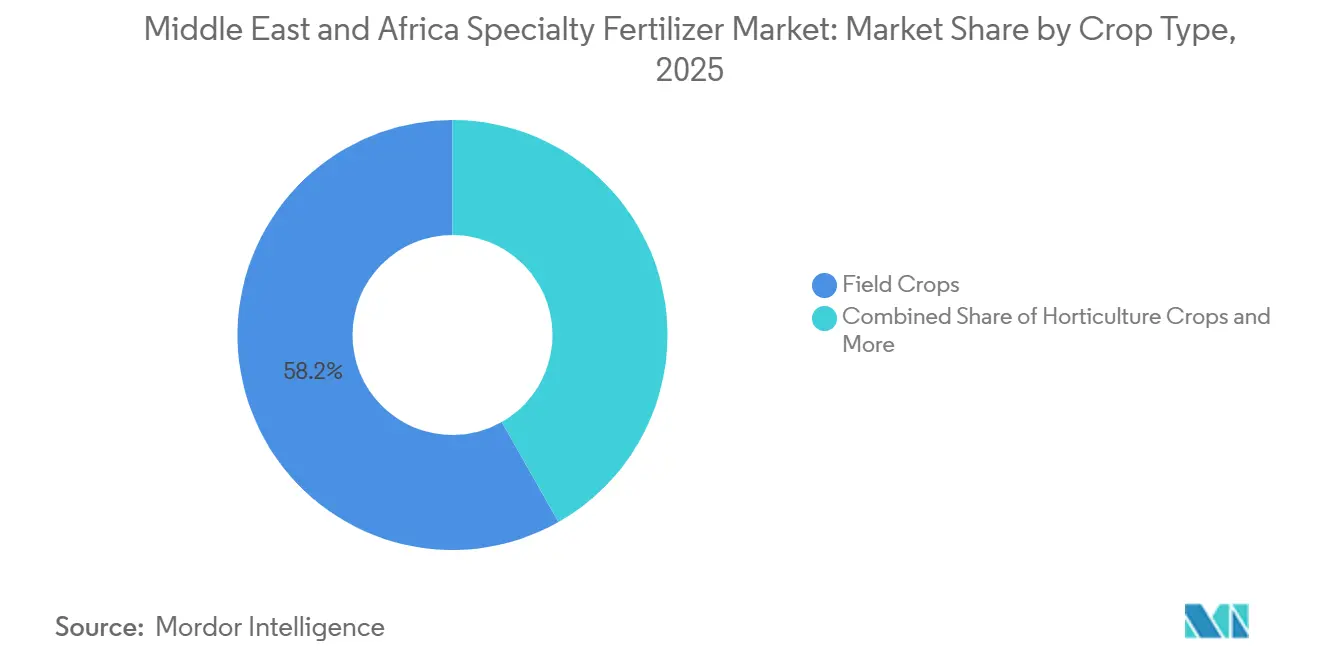
- By crop type, field crops held the largest market share, accounting for 58.2% of the market in 2025. Horticultural crops are projected to be the fastest-growing segment, registering a CAGR of 9.0% during 2026–2031.
- By geography, South Africa led the market, accounting for 11.4% of market revenue in 2025, and is projected to grow at a CAGR of 8.7% during 2026–2031.
Note: Market size and forecast figures in this report are generated using Mordor Intelligence’s proprietary estimation framework, updated with the latest available data and insights as of 2026.
Middle East and Africa Specialty Fertilizer Market Trends and Insights
Drivers Impact Analysis*
| Driver | (~) % Impact on CAGR Forecast | Geographic Relevance | Impact Timeline |
|---|---|---|---|
| Surge in protected cultivation acreage | +1.2% | Gulf states, South Africa, Morocco | Medium term (2–4 years) |
| Government food-security programs | +1.8% | Saudi Arabia, United Arab Emirates (UAE), Egypt, Nigeria | Long term (≥ 4 years) |
| Rising adoption of fertigation systems | +1.1% | Core Middle East and North Africa (MENA), expanding Sub-Saharan | Medium term (2–4 years) |
| Desalination-linked nutrient delivery pilots | +0.7% | Gulf states, Morocco coastal areas | Long term (≥ 4 years) |
| Carbon-credit incentives for precision fertilization | +0.4% | South Africa, Morocco, United Arab Emirates (UAE) | Long term (≥ 4 years) |
| Rapid expansion of controlled-environment date farming | +0.6% | Saudi Arabia, United Arab Emirates (UAE), Algeria | Medium term (2–4 years) |
| Source: Mordor Intelligence | |||
Surge in Protected Cultivation Acreage
Protected cultivation acreage in Saudi Arabia increased 35% between 2022 and 2024 as Vision 2030 targets self-sufficiency in high-value produce. These facilities depend on water-soluble and liquid grades that deliver precise nutrient ratios through automated systems, sharply raising premium fertilizer demand. South Africa mirrors this pattern in Western Cape greenhouse clusters, where specialty fertilizer consumption in such structures jumped 40% per year since 2023. Growers leverage optimal nutrient timing to maximize output per square meter, making price premiums viable and supporting continual uptake of controlled-release and chelated micronutrient blends.
Government Food-Security Programs
Saudi Arabia earmarked USD 20 billion for agricultural transformation initiatives that bundle subsidies, technology transfer, and specialty fertilizer adoption, reinforcing domestic value addition to safeguard food supply. Egypt’s National Food Security Strategy and Nigeria’s Agricultural Transformation Agenda introduce similar incentives, often tying input support to local content agreements. Morocco integrates its phosphate endowment into a downstream value chain that backs export-oriented specialty grades, strengthening regional supply resilience and attracting private-sector capital[1]Source: Saudi Vision 2030, “National Agricultural Transformation Goals,” vision2030.gov.sa.
Rising Adoption of Fertigation Systems
Installed fertigation units in the Gulf states expanded 60% year on year in 2024, supported by extensive desalination projects and precision-agriculture grants. These systems require highly soluble formulations with low salt index to protect irrigation emitters and reduce soil salinity. Turkey’s manufacturing base supplies pumps, filters, and injection units to neighboring markets, accelerating diffusion. South African wine and citrus estates demonstrate return on investment through yield lifts and reduced water use, prompting replication across maize and soybean farms.
Desalination-Linked Nutrient Delivery Pilots
UAE pilot plants convert minerals in desalination concentrate into customized fertilizer blends that offset brine disposal costs. Morocco partners with ENGIE to scale similar schemes, aligning water security with nutrient access. Such circular models demand advanced formulation R&D to balance beneficial elements with potential salt toxicity, creating a niche for companies with strong chemistry capabilities. Saudi Arabia’s NEOM envisions related integrated complexes, contingent on energy pricing and supportive regulation.
Restraints Impact Analysis*
| Restraint | (~) % Impact on CAGR Forecast | Geographic Relevance | Impact Timeline |
|---|---|---|---|
| Price volatility of specialty raw materials | -0.9% | All Middle East and Africa markets | Short term (≤ 2 years) |
| Limited distributor networks in Sub-Saharan Africa | -1.1% | Nigeria, Kenya, Ethiopia | Medium term (2–4 years) |
| Salinity build-up risks in arid soils | -0.6% | Gulf states, North Africa | Long term (≥ 4 years) |
| Regulatory delays on nano-nutrient registration | -0.4% | Region-wide | Medium term (2–4 years) |
| Source: Mordor Intelligence | |||
Price Volatility of Specialty Raw Materials
Polymer coatings essential for controlled-release fertilizers rose 45% in 2024 amid petrochemical supply disruptions, squeezing producer margins. Zinc sulfate and iron chelate costs followed similar trajectories due to mining consolidation and geopolitical constraints, forcing manufacturers to adopt flexible pricing clauses and hedge inventory exposure. Vertically integrated phosphate majors holding internal sulfuric acid and ammonia capacity maintain a competitive edge during volatile periods[2]Source: International Energy Agency, “Global Critical Minerals Outlook 2025,” iea.org.
Limited Distributor Networks in Sub-Saharan Africa
Specialty fertilizer penetration in Nigeria covers under 30% of cultivated land because rural dealers face road bottlenecks, limited cold storage, and high working-capital requirements. Knowledge gaps also curtail adoption, as many retailers lack technical staff to guide application protocols. Kenya and Ethiopia experience parallel constraints, though cooperative purchasing and e-commerce trials show promise in reducing last-mile costs[3]Source: AKADEMIYA2063 and IFPRI, “Africa Agriculture Trade Monitor 2023,” cgspace.cgiar.org .
*Our forecasts treat driver/restraint impacts as directional, not additive. The impact forecasts reflect baseline growth, mix effects, and variable interactions.
Segment Analysis
By Specialty Type: Liquid Solutions Drive Market Evolution
Liquid fertilizers account for 44.6% of the Middle East and Africa specialty fertilizer market size in 2025 because it integrates seamlessly with drip and sprinkler delivery hardware prevalent in modern farms. Growers appreciate quick nutrient uptake, uniform distribution, and reduced labor relative to granular products. Polymer-coated controlled-release fertilizers are projected to be the fastest-growing segment, with a forecast CAGR of 9.3% from 2026 to 2031, driven by polymer innovations that withstand high regional temperatures. These products cut application frequency and conserve water, benefits aligned with sustainability mandates. The specialty fertilizer market for controlled-release variants is on track to surpass USD 2.12 billion by 2031 if current adoption rates continue.
Liquid blends span balanced NPK solutions, calcium nitrate mixes, and trace-element chelates tailored to greenhouse vegetables, floriculture, and hydroponics. Demand surges during peak summer because liquids avoid salt precipitation that clogs emitters. Manufacturers also bundle biostimulants and acidifiers to differentiate offerings. Conversely, polymer-coated urea and polymer-sulfur-coated NPK products appeal to date palm, citrus, and broad-acre wheat growers by cutting weekly top-dressings to two or three seasonal applications. ICL Group’s temperature-responsive coatings show 25% slower nutrient release at 40 °C versus legacy technology, meeting arid-zone needs. Suppliers anticipate integrating biodegradable coatings derived from lignin and polysaccharides within five years, though price competitiveness remains under review.


By Application Mode: Fertigation Systems Reshape Delivery
Fertigation is anticipated to hold the largest share, represented 46.1% of the specialty fertilizer market in 2025, due to public incentives that link irrigation modernization with crop-yield targets. Systemic drip lines and pivots allow continuous micro-dosing, optimizing nutrient concentration per growth stage and elevating use efficiency above 90%. Soil application is projected to be the fastest-growing mode, with an estimated CAGR of 8.4% through 2031, as polymer-coated grades gain traction among cereal and fodder growers who favor conventional spreaders. Specialty foliar mixes maintain relevance for micronutrient correction and stress mitigation in high-value grapes, berries, and cut flowers.
Fertigation drives logistical shifts: suppliers must invest in tank farms, in-house blending stations, and tanker trucks rather than bagged distribution. This model suits regional hubs like Jebel Ali and Tanger Med, which provide liquid bulk storage integrated with export lanes. On-farm, growers adopt cloud-connected injection pumps that adjust dose in real time based on sensor feedback, generating service revenue for agritech firms that partner with fertilizer blenders. Soil application’s revival rests on conservation tillage and minimum-pass systems where extended-release granules cut fuel and labor. Such practices dovetail with carbon-credit frameworks, creating compound incentives for conversion.
By Crop Type: Horticultural Expansion Drives Premium Demand
Field crops dominated the specialty fertilizer market, accounting for 58.2% of the Middle East and Africa specialty fertilizer market share in 2025, but horticultural crops will capture incremental gains as greenhouse vegetables, soft fruits, and ornamentals scale across climate zones. Horticultural crops are forecasted to be the fastest-growing segment, with a CAGR of 9.0% through 2031, leveraging export opportunities to Europe and Gulf retail chains. Date palm estates illustrate the shift: customized micro-nutrient and calcium nitrate programs raise fruit grade premiums by 18%, outweighing higher input costs. Turf and ornamental demand anchors in Gulf urban landscaping and hospitality projects, providing a steady baseline volume for slow-release and coated products.
Smallholder tobacco, coffee, and cocoa growers in East Africa also test liquid NPK and chelated blends to raise leaf quality and bean size, indicating latent cross-crop spillovers. Yet knowledge transfer remains key; demonstration plots and mobile extension apps underpin adoption. Meanwhile, cereal growers experiment with polymer-coated urea to curtail volatilization losses amid rising urea prices. Such diversification stabilizes supplier revenue streams and positions the specialty fertilizer market to weather commodity cycles.
Geography Analysis
South Africa led the market, accounting for 11.4% of Middle East and Africa specialty fertilizer market revenue in 2025, and is projected to grow at a CAGR of 8.7% during 2026–2031. Growth is being driven by increasing adoption of precision agriculture across maize, citrus, and vineyard operations. Well-developed cooperatives and retail distribution networks facilitate farmer education, while local chemical companies continue to invest in controlled-release fertilizer blending facilities. Research organizations such as the Agricultural Research Council collaborate with suppliers on field trials that demonstrate economic returns, further supporting market demand. South Africa is also exploring carbon-credit mechanisms that reward improvements in nitrogen-use efficiency, encouraging greater adoption of specialty fertilizers.
Egypt's extensive irrigated agricultural areas, Algeria's greenhouse expansion, and Kenya's ongoing smallholder modernization are creating additional growth opportunities across the region. Many countries within this cluster continue to record fertilizer application rates below 25 kg per hectare, indicating substantial potential for specialty fertilizer penetration. Moroccan producers benefit from integrated phosphate processing capabilities that help reduce logistics costs and improve competitiveness across North and West Africa. Meanwhile, Egypt's investment in reclaimed desert land and drip-irrigated fruit orchards is supporting demand for water-soluble fertilizers, including calcium nitrate and magnesium sulfate products.
Saudi Arabia maintains a significant market position through Vision 2030 initiatives that support liquid fertilizer infrastructure within protected-cultivation systems. Growers benefit from financing programs that facilitate the adoption of fertigation technologies integrated with desalinated water supplies. High-temperature-tolerant coated fertilizers are increasingly used in cereal production areas such as Al-Qassim and date-growing regions such as Al Madinah Province. Turkey serves as a major manufacturing and distribution hub, supplying soluble NPK, boron, and zinc fertilizer blends across the Levant and Iraq while leveraging proximity to European quality and regulatory standards to strengthen market acceptance.
Competitive Landscape
The specialty fertilizer market in the Middle East and Africa remains highly fragmented, as the five largest suppliers controlled a majority share in 2024. Yara International ASA retained leadership due to broad distribution, technical advisory services, and branded soluble NPK lines. ICL Group Ltd. followed, focusing on controlled-release technology adapted for high heat. OCP Group, though primarily a phosphate bulk player, accelerated downstream specialty capacity through USD 14 billion investments that integrate green ammonia and Industry 5.0 automation to secure feedstock and energy visibility, enhancing its regional competitiveness.
Competitive strategy centers on vertical integration, climate-adapted R and D, and strategic partnerships. OCP Group’s alliances with ENGIE and Fortescue target renewable power and hydrogen inputs to cut production emissions, addressing customer sustainability requirements. Yara Clean Ammonia links Egyptian renewable plants with European offtakers, capturing green-premium segments. Regional firms such as Ma’aden leverage brownfield phosphate assets and rail infrastructure to ship soluble MAP and specialty blends across the GCC and East Africa. Consolidation potential exists as smaller blenders lack capital to upgrade coating lines; larger players may pursue tuck-in acquisitions to expand distribution in Nigeria and Kenya.
Service differentiation grows more important: suppliers now bundle soil analytics, fertigation system calibration, and smartphone agronomy platforms. Companies with data ecosystems gain loyalty and can upsell micronutrient packages. Price volatility in inputs encourages long-term offtake contracts indexed to benchmark polymers and metals, a practice pioneered by multinational suppliers and gradually adopted by local producers. Nonetheless, regulatory uncertainty around nano-nutrients and bio-stimulant claims continues to shape competitive positioning, favoring companies with robust compliance departments.
Middle East and Africa Specialty Fertilizer Industry Leaders
ICL Group Ltd
K+S Aktiengesellschaft
Safsulphur
Unikeyterra Chemical
Yara International ASA
- *Disclaimer: Major Players sorted in no particular order

Recent Industry Developments
- March 2025: OCP Nutricrops launched Strategic Program Mzinda-Meskala to add 9 million tonnes capacity by 2028, focused on Triple Superphosphate and TSP+ grades, powered entirely by renewable energy.
- October 2024: OCP Group and ENGIE entered a joint development agreement covering renewable power, green ammonia, and desalination for agricultural use.
- July 2024: Yara Clean Ammonia, Scatec, ECHEM, and MOPCO signed offtake terms for up to 150,000 tonnes of renewable ammonia per year from Egypt.


Middle East and Africa Specialty Fertilizer Market Report Scope
CRF, Liquid Fertilizer, SRF, Water Soluble are covered as segments by Speciality Type. Fertigation, Foliar, Soil are covered as segments by Application Mode. Field Crops, Horticultural Crops, Turf & Ornamental are covered as segments by Crop Type. Nigeria, Saudi Arabia, South Africa, Turkey are covered as segments by Country.By Specialty Type
| Controlled-Release Fertilizer (CRF) | Polymer-Coated |
| Polymer Sulfur-Coated | |
| Others | |
| Slow-Release Fertilizer (SRF) | |
| Liquid Fertilizer | |
| Water-Soluble Fertilizer |
By Application Mode
| Soil |
| Foliar |
| Fertigation |
By Crop Type
| Field Crops |
| Horticultural Crops |
| Turf and Ornamental |
By Geography
| South Africa |
| Nigeria |
| Saudi Arabia |
| Turkey |
| Rest of Middle East and Africa |
| By Specialty Type | Controlled-Release Fertilizer (CRF) | Polymer-Coated |
| Polymer Sulfur-Coated | ||
| Others | ||
| Slow-Release Fertilizer (SRF) | ||
| Liquid Fertilizer | ||
| Water-Soluble Fertilizer | ||
| By Application Mode | Soil | |
| Foliar | ||
| Fertigation | ||
| By Crop Type | Field Crops | |
| Horticultural Crops | ||
| Turf and Ornamental | ||
| By Geography | South Africa | |
| Nigeria | ||
| Saudi Arabia | ||
| Turkey | ||
| Rest of Middle East and Africa |


Market Definition
- MARKET ESTIMATION LEVEL - Market Estimations for various types of fertilizers has been done at the product-level and not at the nutrient-level.
- NUTRIENT TYPES COVERED - Primary Nutrients: N, P and K, Secondary Macronutrients: Ca, Mg and S, Micronutients: Zn, Mn, Cu, Fe, Mo, B, and Others
- AVERAGE NUTRIENT APPLICATION RATE - This refers to the average volume of nutrient consumed per hectare of farmland in each country.
- CROP TYPES COVERED - Field Crops: Cereals, Pulses, Oilseeds, and Fiber Crops Horticulture: Fruits, Vegetables, Plantation Crops and Spices, Turf Grass and Ornamentals
| Keyword | Definition |
|---|---|
| Fertilizer | Chemical substance applied to crops to ensure nutritional requirements, available in various forms such as granules, powders, liquid, water soluble, etc. |
| Specialty Fertilizer | Used for enhanced efficiency and nutrient availability applied through soil, foliar, and fertigation. Includes CRF, SRF, liquid fertilizer, and water soluble fertilizers. |
| Controlled-Release Fertilizers (CRF) | Coated with materials such as polymer, polymer-sulfur, and other materials such as resins to ensure nutrient availability to the crop for its entire life cycle. |
| Slow-Release Fertilizers (SRF) | Coated with materials such as sulfur, neem, etc., to ensure nutrient availability to the crop for a longer period. |
| Foliar Fertilizers | Consist of both liquid and water soluble fertilizers applied through foliar application. |
| Water-Soluble Fertilizers | Available in various forms including liquid, powder, etc., used in foliar and fertigation mode of fertilizer application. |
| Fertigation | Fertilizers applied through different irrigation systems such as drip irrigation, micro irrigation, sprinkler irrigation, etc. |
| Anhydrous Ammonia | Used as fertilizer, directly injected into the soil, available in gaseous liquid form. |
| Single Super Phosphate (SSP) | Phosphorus fertilizer containing only phosphorus which has lesser than or equal to 35%. |
| Triple Super Phosphate (TSP) | Phosphorus fertilizer containing only phosphorus greater than 35%. |
| Enhanced Efficiency Fertilizers | Fertilizers coated or treated with additional layers of various ingredients to make it more efficient compared to other fertilizers. |
| Conventional Fertilizer | Fertilizers applied to crops through traditional methods including broadcasting, row placement, ploughing soil placement, etc. |
| Chelated Micronutrients | Micronutrient fertilizers coated with chelating agents such as EDTA, EDDHA, DTPA, HEDTA, etc. |
| Liquid Fertilizers | Available in liquid form, majorly used for application of fertilizers to crops through foliar and fertigation. |


Research Methodology
Mordor Intelligence follows a four-step methodology in all our reports.
- Step-1: IDENTIFY KEY VARIABLES: In order to build a robust forecasting methodology, the variables and factors identified in Step-1 are tested against available historical market numbers. Through an iterative process, the variables required for market forecast are set and the model is built on the basis of these variables.
- Step-2: Build a Market Model: Market-size estimations for the forecast years are in nominal terms. Inflation is not a part of the pricing, and the average selling price (ASP) is kept constant throughout the forecast period for each country.
- Step-3: Validate and Finalize: In this important step, all market numbers, variables and analyst calls are validated through an extensive network of primary research experts from the market studied. The respondents are selected across levels and functions to generate a holistic picture of the market studied.
- Step-4: Research Outputs: Syndicated Reports, Custom Consulting Assignments, Databases & Subscription Platforms


