Massive MIMO Market Size and Share
Market Overview
| Study Period | 2020 - 2031 |
|---|---|
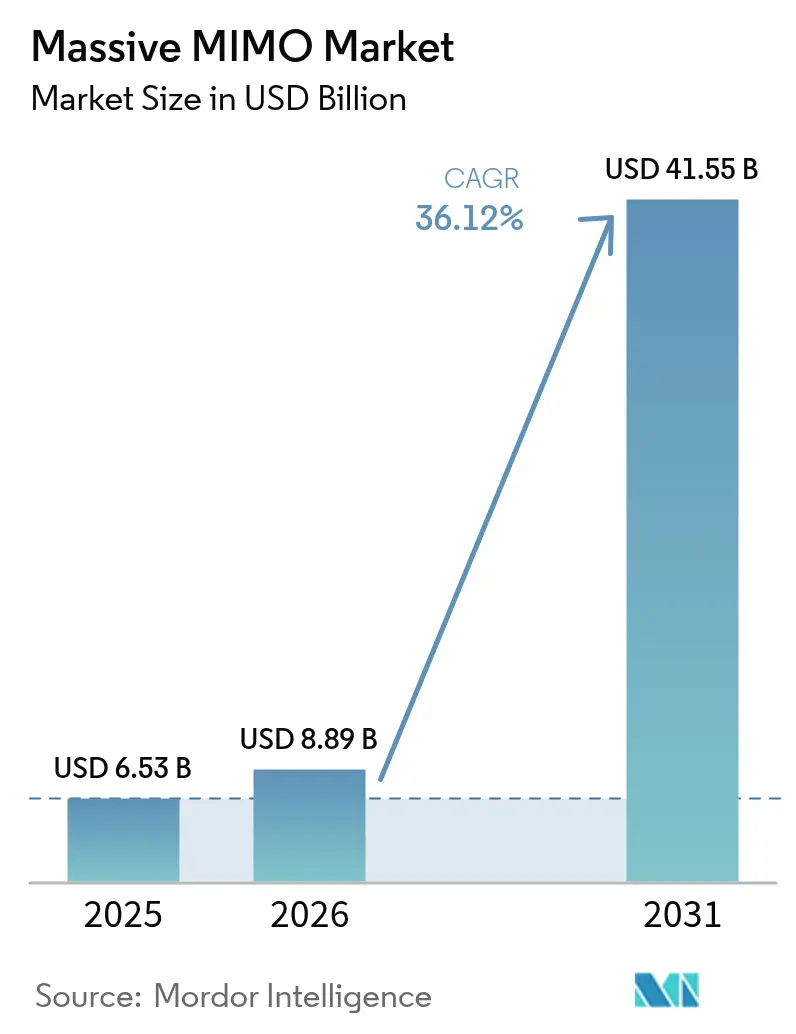
| Market Size (2026) | USD 8.89 Billion |
| Market Size (2031) | USD 41.55 Billion |
| Growth Rate (2026 - 2031) | 36.12% CAGR |
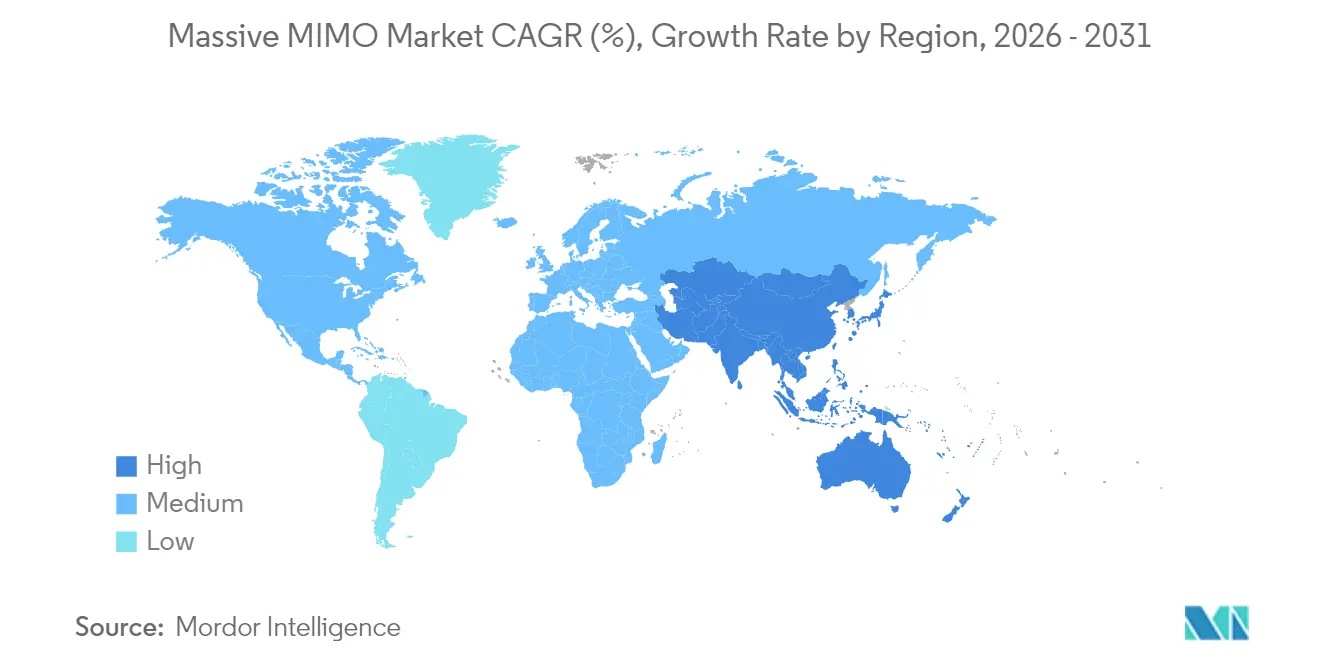
| Fastest Growing Market | Asia Pacific |
| Largest Market | North America |
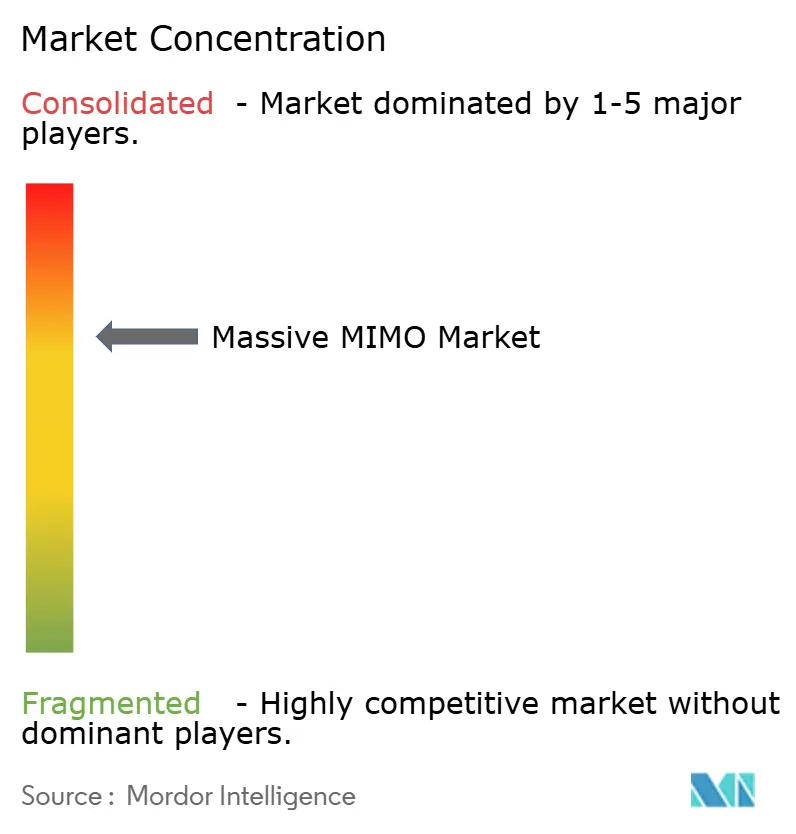
| Market Concentration | Medium |
Major Players *Disclaimer: Major Players sorted in no particular order Image © Mordor Intelligence. Reuse requires attribution under CC BY 4.0. | |
Massive MIMO Market Analysis by Mordor Intelligence
The massive MIMO market size is expected to grow from USD 6.53 billion in 2025 to USD 8.89 billion in 2026 and is forecast to reach USD 41.55 billion by 2031 at 36.12% CAGR over 2026-2031.[1]Fredrik Jejdling, “Ericsson Mobility Report 2025,” ericsson.comSteady operator migration from broad-coverage roll-outs toward capacity-oriented urban deployments is amplifying demand, because beamforming increases spectral efficiency and lifts average revenue per user. The massive MIMO market receives additional momentum from an installed base headed toward 8.3 billion global 5G subscriptions by 2029, greater adoption of private 5G networks, and policy support for Open RAN architectures that encourage multi-vendor ecosystems. Hardware vendors are also moving to higher-order 128T128R and 512T512R arrays, which multiply throughput per site, while operators deploy AI-native energy-saving software to meet net-zero goals. Emerging industrial IoT and fixed-wireless-access use cases add incremental site demand, ensuring that the technology remains the backbone of network densification strategies over the forecast period.
Key Report Takeaways
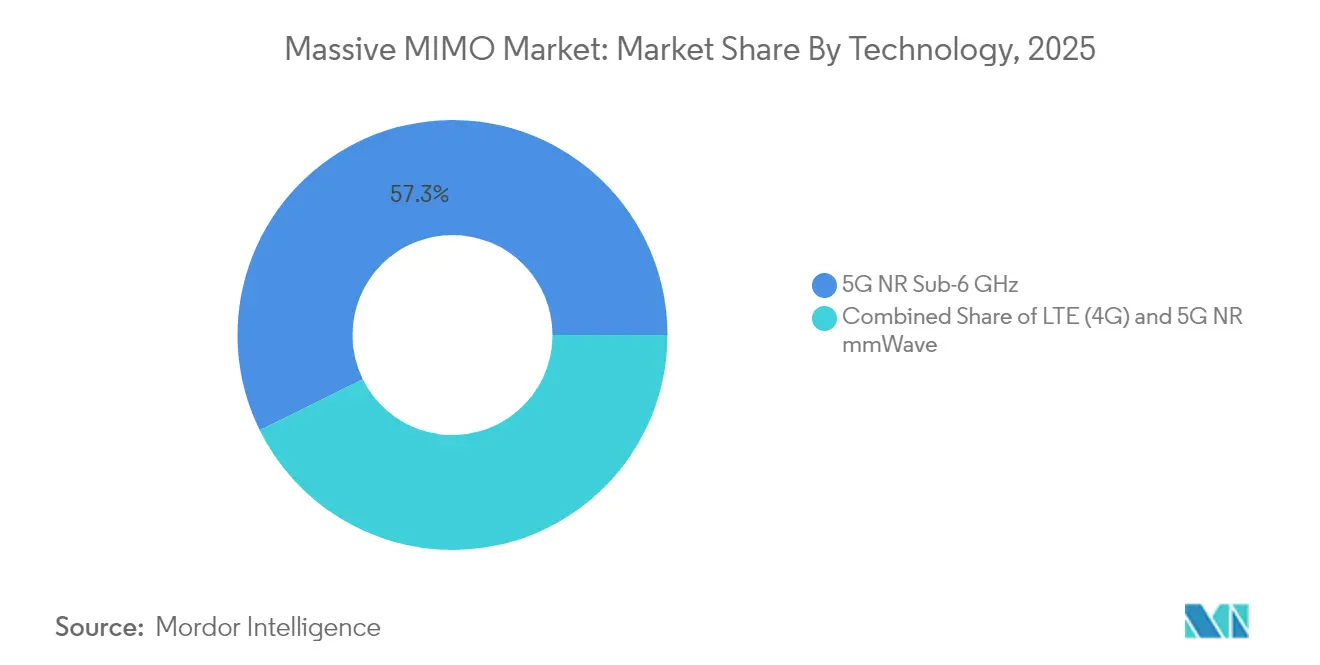
- By technology, 5G NR Sub-6 GHz accounted for 57.30% revenue in 2025, while the 5G NR mmWave segment is forecast to grow at a 39.05% CAGR through 2031.
- By antenna configuration, 64T64R systems captured 38.25% of the massive MIMO market share in 2025, whereas 128T128R and above arrays are poised to expand at a 40.15% CAGR to 2031.
- By deployment model, centralized C-RAN held 45.20% revenue share in 2025, yet Open RAN is projected to rise at a 37.65% CAGR between 2026 and 2031.
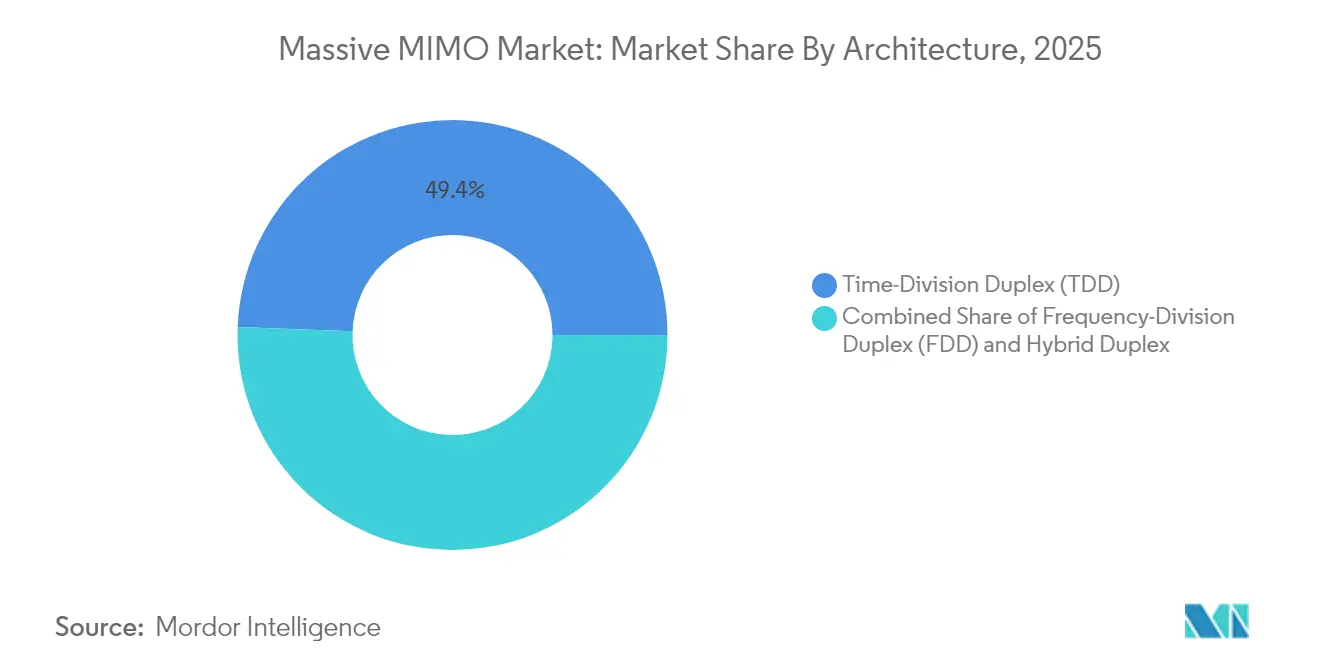
- By architecture, TDD solutions commanded 49.40% revenue in 2025 and are set to register a 37.60% CAGR through 2031.
- By end user, mobile-network operators controlled 73.10% of the massive MIMO market size in 2025, while enterprise and private-network deployments are advancing at a 37.20% CAGR to 2031.
- By geography, North America led with 39.50% revenue share in 2025, whereas Asia Pacific is projected to grow fastest at a 36.95% CAGR through 2031.
Note: Market size and forecast figures in this report are generated using Mordor Intelligence’s proprietary estimation framework, updated with the latest available data and insights as of 2026.
Global Massive MIMO Market Trends and Insights
Drivers Impact Analysis*
| Driver | (~) Impact on CAGR Forecast (~%) | Geographic Relevance | Impact Timeline |
|---|---|---|---|
| Surging mobile-data traffic and device density | +12.5% | Global with peak impact in Asia-Pacific urban centers | Medium term (2-4 years) |
| Rapid global roll-out of 5G NR | +10.2% | North America and Europe leading, Asia-Pacific scaling | Short term (≤ 2 years) |
| Operator CAPEX savings via beamforming efficiency | +8.7% | Global, strongest in cost-sensitive emerging markets | Long term (≥ 4 years) |
| Open RAN catalysts enabling multi-vendor massive MIMO | +6.1% | North America and Europe regulatory push | Medium term (2-4 years) |
| AI-assisted cell-edge beam-optimization | +4.3% | Advanced markets with AI infrastructure readiness | Long term (≥ 4 years) |
| Source: Mordor Intelligence | |||
Surging Mobile-Data Traffic and Device Density
China expects mobile data traffic to quadruple by 2030, creating density levels that legacy cell-splitting strategies cannot manage cost-effectively. Fixed-wireless-access lines are forecast to climb from 160 million in 2024 to 350 million by 2030, with 80% serviced by 5 G-Advanced networks anchored by massive MIMO radio arrays, ZTE. Industrial IoT adds further load; China targets 10,000 wireless-enabled factories by 2027, each placing tight performance constraints on network capacity. As 5G penetration exceeds 75.9% in leading markets, congestion at the cell edge intensifies, making beamforming vital for sustaining a consistent user experience. The massive MIMO market, therefore, aligns directly with traffic growth, positioning operators to meet throughput needs without proportional site expansion.
Rapid Global Roll-out of 5G NR (Sub-6 GHz and mmWave)
Standalone 5G subscriptions reached 1.2 billion worldwide by end-2024 and are forecast to touch 3.6 billion by 2030, according to Ericsson. China plans to add 4.5 million new 5G base stations by 2025, mandating massive MIMO as the default antenna system for fresh sites. India achieved nationwide 5G coverage by October 2024, accelerating demand for high-order arrays during back-haul upgrades. mmWave economics improved in 2025 when Ericsson, NBN Co, and Qualcomm demonstrated 14 km gigabit links that rely on advanced beamforming, according to Ericsson. Private 5G saw over 40% RAN revenue growth in 2024, and interference-managed radios are indispensable for guaranteed service-level agreements.
Operator CAPEX Savings via Beamforming Efficiency
Massive MIMO allows operators to attain 60% greater coverage with 32T32R arrays versus legacy 8T8R panels, cutting site leasing fees and civil works in rural and peri-urban zones. AI-driven energy-saving software trialed by Verizon exhibits efficiency gains up to 20%, allowing carriers to shrink opex without compromising performance. Qualcomm’s Giga-MIMO prototype, scaling to 4,096 elements, promises further cost per bit reduction by pushing fiber upgrades deeper into the planning cycle. Enterprise examples reinforce the case: CJ Logistics’ private 5G implementation cut initial capital outlay by 15% compared with wired options while lifting workflow productivity by 20%, according to Ericsson. Such economics persuade CFOs to prioritize massive MIMO over traditional sector-splitting for mid-band expansion.
Open RAN Catalysts Enabling Multi-vendor Massive MIMO
Samsung and Vodafone completed the first Open RAN data call using AMD processors in 2025, underscoring how disaggregated networks welcome specialized radio vendors.[2]Samsung Electronics, “64T64R Massive MIMO for Open RAN,” samsung.com AT&T intends to route 70% of 5G traffic through open hardware by late 2026, a policy that broadens the addressable massive MIMO market for independent suppliers. The U.S. Department of Defense will retrofit 800 bases with Open RAN, creating a scale opportunity for interoperable 64T64R and 128T128R radios.[3]Light Reading Staff, “Huawei 2024 Results,” lightreading.com Standardization via the O-RAN Alliance reduces integration cost, encouraging additional operators to decouple hardware and software choices. Multi-vendor tendering erodes incumbent lock-in, accelerating price competition and innovation cycles within the massive MIMO market.
Restraints Impact Analysis*
| Restraint | (~) Impact on CAGR Forecast (~%) | Geographic Relevance | Impact Timeline |
|---|---|---|---|
| High unit cost and power consumption of RF front-end | -6.8% | Global, most acute in price-sensitive markets | Short term (≤ 2 years) |
| Complex site-level deployment and maintenance | -4.2% | Developed markets with labor shortages | Medium term (2-4 years) |
| Semiconductor-grade gallium nitride (GaN) supply risk | -3.5% | Global, particularly North America and Europe dependent on Chinese supply | Long term (≥ 4 years) |
| EMF-exposure and urban footprint opposition | -2.1% | Europe and North America regulatory environments, selective urban areas | Medium term (2-4 years) |
| Source: Mordor Intelligence | |||
High Unit Cost and Power-Consumption of RF Front-end
China controls 98% of gallium nitride wafer output, raising supply-security and pricing concerns for RF front-end modules essential in high-order arrays.[4]Center for Strategic & International Studies, “Securing the Gallium Nitride Supply Chain,” csis.org Component maker Qorvo recorded a 12.4% sales decline in Q3 2025 as handset demand softened, hinting that vendor margins already feel pressure from cost-push inflation. AI-enabled power-saving algorithms can trim radio energy draw by up to 80%, but they require additional silicon, raising bill-of-materials until volume scales. The U.S. Defense Department has funded domestic gallium processing pilots, yet commercial volumes will lag beyond 2027, leaving operators exposed to currency swings and export controls. These factors restrain near-term adoption in cost-sensitive geographies and encourage deferred upgrades.
Complex Site-level Deployment and Maintenance
Massive MIMO installation calls for advanced RF calibration and phase-alignment skills that remain scarce in many regions. The University of Wisconsin – Milwaukee required extensive vendor-led optimization to activate its private 5G testbed, illustrating the learning curve facing enterprises. Over-the-air validation equipment, mandatory for beamforming arrays, adds cost that older sector antennas avoided. Open RAN environments multiply integration scenarios; AutoRAN research shows that automated intent-based provisioning is still immature, prolonging deployment cycles. Field technicians must also address higher thermal loads, and Samsung’s 64T64R roll-out with O2 Telefónica showed that pre-deployment optimization extends project schedules versus traditional panels. Such operational complexity curtails the speed of scale in markets with limited high-skill workforces.
*Our forecasts treat driver/restraint impacts as directional, not additive. The impact forecasts reflect baseline growth, mix effects, and variable interactions.
Segment Analysis
By Technology: mmWave Gains Momentum Despite Sub-6 Dominance
5G NR Sub-6 GHz technology commanded 57.30% revenue in 2025 because its propagation traits support wide-area coverage and indoor penetration, making it the default option for early 5G launches. The segment benefited from harmonized mid-band allocations across several regions, which streamlined device ecosystems and reduced radio costs. In contrast, 5G NR mmWave occupies only premium use cases today, but its 39.05% CAGR indicates accelerating take-up in fixed wireless access and stadium hotspots. The massive MIMO market size for mmWave is projected to widen significantly as operators replicate the 14 km rural link success in Australia, proving high-frequency economics for non-urban broadband.
The Sub-6 layer nevertheless remains essential for control-plane anchoring, giving carriers a balanced spectrum strategy that marries coverage and capacity. Reliance Jio’s AirFiber trials show mmWave FWA cutting last-mile rollout times compared with fiber. Japan’s private 5G licensing landscape still favors Sub-6, but early mmWave projects in warehouses hint at forthcoming diversification. Once device costs fall and propagation enhancements mature under 5G-Advanced, the mmWave share should climb, contributing a rising portion of the massive MIMO market revenue through 2031.


By Antenna Type: Advanced Configurations Drive Innovation
64T64R panels held 38.25% volume share in 2025 by balancing high cell-edge throughput with manageable weight and power draw. Operators favor this format when upgrading macro sites in dense metros because installation requires minimal structural reinforcement. The 128T128R and larger class will register a 40.15% CAGR as vendors improve heat-sink efficiency and as AI tools mitigate beam calibration overhead. Research at Georgia Tech demonstrates receiver architectures that support substantial element counts across 27-41 GHz bands, signaling practical viability for extremely large-scale arrays.
As applications migrate toward XR and industrial robotics, demand for consistent multi-gigabit throughput climbs, prompting carriers to test 256-element prototypes. The massive MIMO market size for 128T128R systems is projected to reach USD 14.88 billion by 2031, equal to 35.80% of overall sales. Qualcomm’s 4,096-element Giga-MIMO concept underlines the runway for step-function capacity gains, although commercial adoption is likely after 2028 when power-amplifier efficiency improves. Near-term, 32T32R arrays still serve rural and cost-sensitive deployments where tower loading limits preclude heavier panels, preserving a multi-tier market structure.
By Deployment Type: Open RAN Disrupts Traditional Models
Centralized C-RAN absorbed 45.20% of 2025 deployments because pooling baseband resources cuts capital expenditure and simplifies version control across clusters. Operators with dense fiber backhaul find virtualized centralized sites straightforward to scale, especially when automating slice management. Still, the Open RAN segment will post a 37.65% CAGR through 2031 as policymakers and tier-1 carriers promote multi-vendor supply resilience. The U.S. military’s 800-base program alone creates a large addressable massive MIMO market for radios certified to O-RAN specifications.
Dell and Ericsson’s collaboration on Cloud RAN illustrates convergence: established suppliers now incorporate disaggregation while retaining performance parity with integrated alternatives. Samsung anticipates 53,000 commercial vRAN sites by 2025, proving that virtualized radios can satisfy live-traffic reliability benchmarks. Centralized and distributed models thus coexist; latency-critical applications such as remote surgery may favor edge-hosted processing, whereas cost-centric rural deployments embrace pooled compute for economies of scale. The massive MIMO market revenue split will therefore evolve toward a roughly one-third share for Open RAN by 2031.
By Architecture: TDD Dominance Reflects Spectrum Realities
TDD systems represented 49.40% sales in 2025 and are forecast to post a 37.60% CAGR, a trajectory driven by global mid-band allocations in 2.5 GHz, 3.5 GHz, and 4.9 GHz ranges. Reciprocity between uplink and downlink halves sounding overhead, allowing precise beamforming without dedicated feedback channels. FDD massive MIMO nevertheless retains a niche where low-band coverage fills indoor gaps or where regulators have not refarmed paired spectrum. Huawei’s 32T32R FDD portfolio shows sustained vendor innovation for carriers locked into legacy allocations.
Hybrid duplex options emerge under 5G-Advanced, which aggregates TDD mid-band with FDD low-band to boost cell-edge rates. Such flexibility helps operators maximize spectrum utilization across diverse holdings, expanding the addressable massive MIMO market share for dual-mode radios. As auctions release additional upper-mid frequencies, TDD’s cost advantage will persist, yet FDD adoption will follow where coverage obligations dominate national broadband agendas.
By End-user Application: Enterprise Adoption Accelerates
Mobile network operators commanded 73.10% market revenue in 2025; public macro networks remain the primary channel for massive MIMO shipments. However, enterprise and private-network demand is rising at a 37.20% CAGR as factories, ports, and logistics hubs pursue deterministic wireless connectivity. Cummins’ U.S. plant is now covered by a Verizon neutral-host network that leverages 64T64R radios to support both corporate LTE and private 5G slices.
China’s target of 10,000 smart factories by 2027 illustrates the scale potential, while Europe’s energy-intensive process industries value beamforming for enhanced reliability in high-EMI settings. Public safety agencies also migrate mission-critical voice to broadband, requiring multi-layered massive MIMO coverage. The massive MIMO market size tied to enterprise applications is expected to surpass USD 6.95 billion by 2031, aided by simplified equipment-as-a-service models that lower entry costs. Vendors now bundle AI orchestration platforms to automate QoS enforcement, a prerequisite for Industry 4.0 adoption.
Geography Analysis
North America generated 39.50% of global revenue in 2025 on the back of aggressive C-band roll-outs, enterprise FWA adoption, and favorable policy toward Open RAN. Verizon plans USD 17.5-18.5 billion in 2025 capital outlays, a sizable share earmarked for 64T64R sector upgrades that keep per-subscriber throughput competitive. Canada’s TELUS is partnering with Samsung to deploy the first nationwide virtualized RAN, underscoring regional appetite for software-defined radios. FCC reforms around 70/80/90 GHz backhaul and 37 GHz sharing further broaden mmWave business cases for rural broadband.
Asia Pacific is the fastest-growing territory, forecast at 36.95% CAGR to 2031 as China surpasses 4.4 million 5G sites by March 2025 and commits to 4.5 million additional base stations within the year. India reached nationwide 5G coverage in late 2024, with Reliance Jio responsible for 85% of active cells, creating a sizable procurement funnel for 32T32R and 64T64R radios. Government programs such as Bharat 6G emphasize indigenous R&D, potentially reshaping regional vendor shares. China Unicom’s 5G-Advanced coverage across 300 cities by end-2025 further raises antenna order volumes, providing economies of scale that exert downward price pressure globally.
Europe shows measured expansion as operators juggle capital efficiency and regulatory scrutiny over vendor diversification. Samsung and O2 Telefónica activated Germany’s first commercial vRAN site with 64T64R radios in 2024, signaling market willingness to test disaggregated stacks. Ericsson and MasOrange demonstrated an open programmable network in Spain, focusing on automation and energy optimization rather than raw capacity. Spectrum auctions in France and Italy favored contiguous 3.4-3.8 GHz blocks, reinforcing TDD dominance. The European massive MIMO market therefore emphasizes performance per watt and supply-chain resilience, supporting gradual but firm growth.

Regulatory Landscape
Massive MIMO deployments are shaped primarily by national spectrum frameworks and international technical specifications that set coexistence conditions and performance validation requirements for multi-antenna radios. In the United States, FCC actions on the 6 GHz band expanded the role of automated frequency coordination (AFC) in early 2026, including a Third Further Notice of Proposed Rulemaking (February 2026) on how AFC systems can incorporate building entry loss assumptions for composite indoor and standard-power devices, affecting how dense radio deployments are engineered around incumbent protection requirements.
On the compliance side, conformance testing requirements for beamforming and active antenna systems are being tightened through updated 5G specifications aligned to 3GPP Release 18 (5G-Advanced) work. ETSI published several 2026 updates relevant to Massive MIMO verification, including TS 137 145-1 V18.8.0 (February 2026) for Active Antenna System base station conducted conformance testing and TS 138 141-2 V18.13.0 (April 2026) for 5G NR base station radiated conformance testing, which includes MIMO-related constructs such as channel correlation considerations; these updates increase the importance of OTA and radiated test readiness for vendors shipping high-order arrays.
Value Chain Analysis
The Massive MIMO value chain covers RF materials and semiconductors (including GaN power amplifiers, transceivers, beamforming ICs, and filters), radio and baseband platforms, active antenna system integration, and operator-facing delivery that includes site engineering, calibration, and acceptance testing. Tier-1 OEMs such as Ericsson, Nokia, and Huawei combine proprietary radio designs and software with critical merchant components supplied by analog and RF specialists such as Analog Devices, MaxLinear, and Skyworks, supporting Open RAN radio-unit architectures and specialized form factors.
Manufacturing and logistics resilience is a key swing factor because radios incorporate complex multi-sourced electronics and thermal subsystems; for example, Ericsson operates a 5G Smart Factory in Lewisville, Texas, producing Massive MIMO radios using roughly 2,000 unique components. Late-2025 component constraints and longer lead times for foundational electronics have elevated the role of buffering, approved-vendor-list diversification, and vendor-managed inventory programs, while shipping disruptions and rerouting that add weeks to inbound deliveries can cascade into delayed RAN deliveries and staggered site turn-ups, particularly for high-volume macro modernization programs.
Competitive Landscape
Established infrastructure providers face rising competition as the massive MIMO market embraces open interfaces, AI-native optimization, and specialized enterprise use cases. Samsung became the 2024 global leader in virtualized RAN shipments, targeting 53,000 live sites by end-2025, and integrates cloud-native beamforming algorithms that lower energy draw by 16% on average. Ericsson saw a 5% annual sales dip but retained a robust software revenue stream from its Intelligent RAN services, underpinning recurring margins. Huawei posted 22% top-line growth to CNY 860 billion in 2024, buoyed by consumer devices but maintaining investment in ultra-large-scale arrays
Patent filings illustrate competitive priorities. Qualcomm’s recent disclosures on XR latency mitigation and link reliability underscore the pursuit of application-specific differentiation. ZTE reported revenue of CNY 121.30 billion in 2024 and highlighted AI integration across its 5G-Advanced portfolio, aiming at autonomous cell-edge optimization. Smaller specialists target white-space niches; Mavenir bundles containerized radios with private-network cores, while Airspan offers CBRS-band arrays for U.S. enterprises.
Open RAN tender wins are shifting leverage toward integrators skilled in multitier certification. AT&T’s multivendor roadmap, T-Mobile’s AI-RAN Innovation Center with NVIDIA, and Vodafone’s disaggregated pilots in Europe all intensify pressure on single-stack incumbents. Supply-chain risk around gallium nitride amplifiers could reorder vendor alliances; Western carriers may diversify toward Japanese or U.S. chipmakers to hedge geopolitical exposure. Overall, rivalry pivots on software intelligence, energy efficiency, and ecosystem openness rather than hardware price alone.
Massive MIMO Industry Leaders
Samsung Electronics Co. Ltd
Huawei Technologies Co. Ltd
Nokia Corporation
ZTE Corporation
Ericsson
- *Disclaimer: Major Players sorted in no particular order

Market Opportunities and Future Outlook
A major whitespace is opening around low-band (sub-1 GHz) Massive MIMO, where operators use advanced FDD beamforming to improve indoor coverage and extend spectral efficiency on legacy spectrum assets alongside the established mid-band TDD macro upgrade cycle. This is supported by commercial deployments highlighted in 2026, including MTN Nigeria and Huawei activating a commercial sub-1 GHz Massive MIMO site (reported with a 104% increase in low-band LTE traffic and a 28% uplift in downlink user-perceived rates) and rain South Africa executing a multi-thousand-site sub-1 GHz Massive MIMO 5G rollout. These programs broaden the addressable use cases beyond dense urban mid-band capacity and link Massive MIMO to coverage-led modernization and refarming strategies.
A second opportunity is the expansion of interoperable Massive MIMO in Open RAN and virtualized RAN supply chains, where operators procure radios that meet open interface and conformance expectations while maintaining beamforming performance and energy efficiency. Rakuten Mobile in Japan began deploying 3,000 32T32R Massive MIMO O-RAN radios using Fujitsu 1Finity units and Qualcomm QRU100 platforms in February 2026 to increase capacity in high-traffic zones, illustrating a demand path for merchant silicon and multi-vendor radio ecosystems. In parallel, standards and test specifications progressing in 2026 (ETSI updates for NR radiated and OTA conformance) reinforce an implementation roadmap where vendors that can pass OTA validation at scale and integrate AI-oriented uplink/downlink optimization features can compete across operator macro upgrades and enterprise or private-network builds.
Recent Industry Developments
- July 2026: rain South Africa and Huawei announced a multi-thousand-site sub-1 GHz Massive MIMO 5G deployment. The rollout extends Massive MIMO beyond mid-band capacity layers into low-band coverage and indoor penetration use cases, widening the addressable footprint for active antenna systems across macro networks.
- June 2026: Samsung and MediaTek reported a 3Tx 5-layer uplink demonstration using Samsung Massive MIMO radios and virtualized RAN, reaching 670 Mbps total uplink throughput. The milestone highlights the move toward uplink-centric performance for mobile AI and user-generated content, reinforcing demand for advanced multi-antenna radio architectures and software-defined RAN stacks.
- March 2025: Ericsson, NBN Co, and Qualcomm demonstrated extended 5G mmWave range to 14 km with multi-gigabit throughput for rural fixed wireless access in Australia. The result strengthens the mmWave Massive MIMO business case outside dense hotspots by supporting longer-reach FWA deployments that can defer fiber buildouts while improving broadband availability.


Research Methodology Framework and Report Scope
Market Definition and Coverage
This market is defined as revenue generated from massive MIMO base station radio units used in cellular networks, where the radio supports more than 16 active transceiver paths and is sold with the embedded control software needed to run it.
Scope exclusions: We exclude smaller MIMO radios at 8T8R class, Wi-Fi access points, passive antenna retrofit kits, and ongoing managed services tied to rollout and operations.
Segmentation Overview
- By Technology
- LTE (4G)
- 5G NR Sub-6 GHz
- 5G NR mmWave
- By Antenna Type
- 16T16R
- 32T32R
- 64T64R
- 128T128R and Above
- By Deployment Type
- Centralised (C-RAN)
- Distributed RAN
- Open RAN
- By Architecture
- Time-Division Duplex (TDD)
- Frequency-Division Duplex (FDD)
- Hybrid Duplex
- By End-user Application
- Mobile Network Operators
- Enterprises and Private Networks
- Public Safety and Defence
- Fixed Wireless Access (FWA)
- By Geography
- North America
- United States
- Canada
- Mexico
- South America
- Brazil
- Rest of South America
- Europe
- Germany
- United Kingdom
- France
- Russia
- Rest of Europe
- Asia Pacific
- China
- India
- Japan
- South Korea
- ASEAN
- Rest of Asia Pacific
- Middle East and Africa
- Middle East
- Saudi Arabia
- UAE
- Turkey
- Rest of Middle East
- Africa
- South Africa
- Nigeria
- Rest of Africa
- Middle East
- North America
Data Sources, Market Sizing, and Validation
Desk Research
Desk research was used to set the market boundaries and to build the first set of demand signals that can be checked year over year. We relied on public telecom and spectrum references such as ITU releases, 3GPP specifications, national telecom regulator publications, and operator coverage and rollout updates, which help clarify what qualifies as massive MIMO in live networks.
To anchor the model in observable activity, we also reviewed operator annual reports and investor decks, network equipment shipment commentary in reputable press, and trade association dashboards on 5G adoption. Select paid subscriptions were used only for company financials and news intelligence, plus patent databases to track technology focus areas that often precede product ramps. These examples are not exhaustive, and many other public sources were also used for collection, validation, and clarification during the work.
Primary Interviews and Surveys
Primary discussions were run with people close to radio access network planning and procurement, as well as teams involved in hardware design, channel distribution, and integration. Because massive MIMO demand shifts with spectrum band, site type, and rollout stage, inputs were validated across APAC, EMEA, and the Americas to keep our unit mix and pricing assumptions from skewing toward one geography.
Distribution of primary research fieldwork respondents
| Company type | Respondent position | Region |
|---|---|---|
| Top tier: 34% | CXOs: 14% | APAC: 44% |
| Mid tier: 45% | Functional/Unit leaders: 36% | EMEA: 34% |
| Smaller Players: 21% | Managers: 50% | Americas: 22% |
Market-Sizing & Forecasting
Sizing is built mainly through a top-down demand pool reconstruction that starts from macro and operator-level rollout signals, and then converts those signals into addressable radio requirements by year. In practice, we map 5G macro expansion, spectrum band direction (sub-6 GHz versus mmWave), and the expected share of sites that need high-capacity radios into a count of massive MIMO unit opportunities.
The model is then cross-checked with selective bottom-up approximations, where sampled average selling prices are multiplied by plausible unit shipments, followed by channel checks on mix shifts by antenna configuration. Inputs that matter most include the active transceiver path thresholds used in procurement, the typical antenna configuration mix (for example, 32T32R, 64T64R and above), operator capex intensity, urban traffic growth indicators, and the timing of coverage obligations linked to spectrum awards. For forecasting, scenario analysis is used with a base case, conservative case, and accelerated rollout case, and the choice among cases is guided by what primary respondents expect for rollout pace and pricing progression. Where gaps appear in unit visibility by region, ratios are inferred from similar rollout markets and then adjusted using consistency checks against macro site growth and equipment spending trends.
Data Validation & Update Cycle
Validation is done through multiple passes so the final totals align with real-world signals. Model outputs are compared with independent indicators such as operator RAN capex direction, stated rollout targets, and shifts in spectrum usage, and then variance outliers are reviewed before sign-off.
If a number moves beyond a reasonable band, we revisit assumptions and re-contact relevant interviewees to confirm whether the change is real or an input error. Reports are refreshed on an annual cycle, and interim updates are made when major events occur such as spectrum policy changes, large rollout pauses, or sudden price shifts. Before delivery, one more pass is completed so clients receive the latest updated view rather than an older snapshot.
Mordor Intelligence's Massive Multiple Input Multiple Output Mimo Market Size Measured Against Other Published Estimates
Published market sizes for massive MIMO do not always match because firms often count different items and do not always align on which year is treated as the current estimate. Differences usually come from what is included with the radio hardware, how smaller versus massive configurations are separated, and whether services and broader network infrastructure are bundled in.
Another driver is how pricing and mix changes are handled as networks shift from early 5G coverage to capacity upgrades, since the unit share of higher-path radios can rise quickly in dense areas. Some estimates also stretch the definition to include software, services, or even non-cellular use cases, which can lift totals without a clear link to base station radio shipments. In these cases, roll-forward assumptions may not be re-checked against operator capex and spectrum rollout timing.
Benchmark comparison
| Source | Market Size | Gaps in Research Methodology |
|---|---|---|
| Mordor Intelligence | USD 8.89 B (2026) | |
| Global Consultancy A | USD 6.12 B (2025) | Uses a broader technology narrative that can blend massive MIMO across multiple wireless standards and timeframes, and the year alignment differs, which makes like-for-like comparison harder when mix and pricing are shifting. |
| Industry Publisher B | USD 7.98 B (2025) | Often expands scope to include services and adjacent software lines, and may not consistently separate sub-16 transceiver products from massive configurations, which can change the counted revenue base. |
The spread is mostly explained by whether the estimate stays tied to newly manufactured base-station radios above the 16-path threshold and whether add-on services are kept out, which is the scope choice applied by Mordor Intelligence. When the inputs are anchored to rollout pace, spectrum direction, and realistic pricing and mix shifts, the resulting market number becomes easier to trace, repeat, and update as new signals come in.


Key Questions Answered in the Report
What is driving the rapid expansion of the massive MIMO market?
Rising mobile-data traffic, operator pursuit of spectrum efficiency, and the global transition to 5G Standalone networks are the main catalysts, pushing the market toward a 36.12% CAGR through 2031.
How large will the massive MIMO market size be by 2031?
The massive MIMO market size is projected to reach USD 41.55 billion by 2031, up from USD 8.89 billion in 2026.
Which technology segment is growing fastest within the massive MIMO market?
5G NR mmWave radios are the fastest, forecast to expand at a 39.05% CAGR as operators adopt them for fixed wireless access and high-capacity hotspots.
Why is Asia Pacific the fastest-growing region for massive MIMO?
Massive nationwide 5G build-outs in China and India, government funding, and early moves toward 5G-Advanced give Asia Pacific a 36.95% CAGR outlook.
How does Open RAN influence vendor competition in the massive MIMO market?
Open RAN disaggregation lowers entry barriers, enabling specialized radio vendors to compete with incumbents and driving multi-vendor procurement, which accelerates innovation and price competition.
What are the main challenges restraining massive MIMO adoption?
High RF front-end costs linked to gallium nitride dependency and the complexity of site-level deployment, including calibration and maintenance, presently moderate uptake in cost-sensitive regions.
Page last updated on:


