Market Overview
| Study Period | 2020 - 2031 |
|---|---|
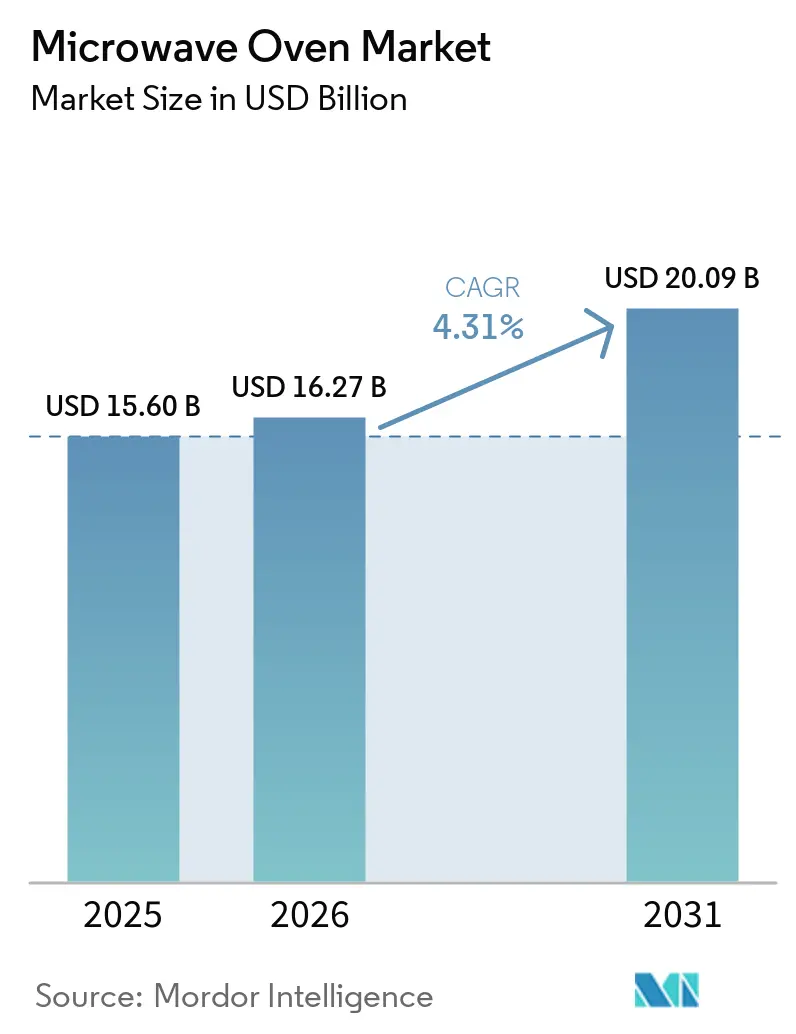
| Market Size (2026) | USD 16.27 Billion |
| Market Size (2031) | USD 20.09 Billion |
| Growth Rate (2026 - 2031) | 4.31% CAGR |
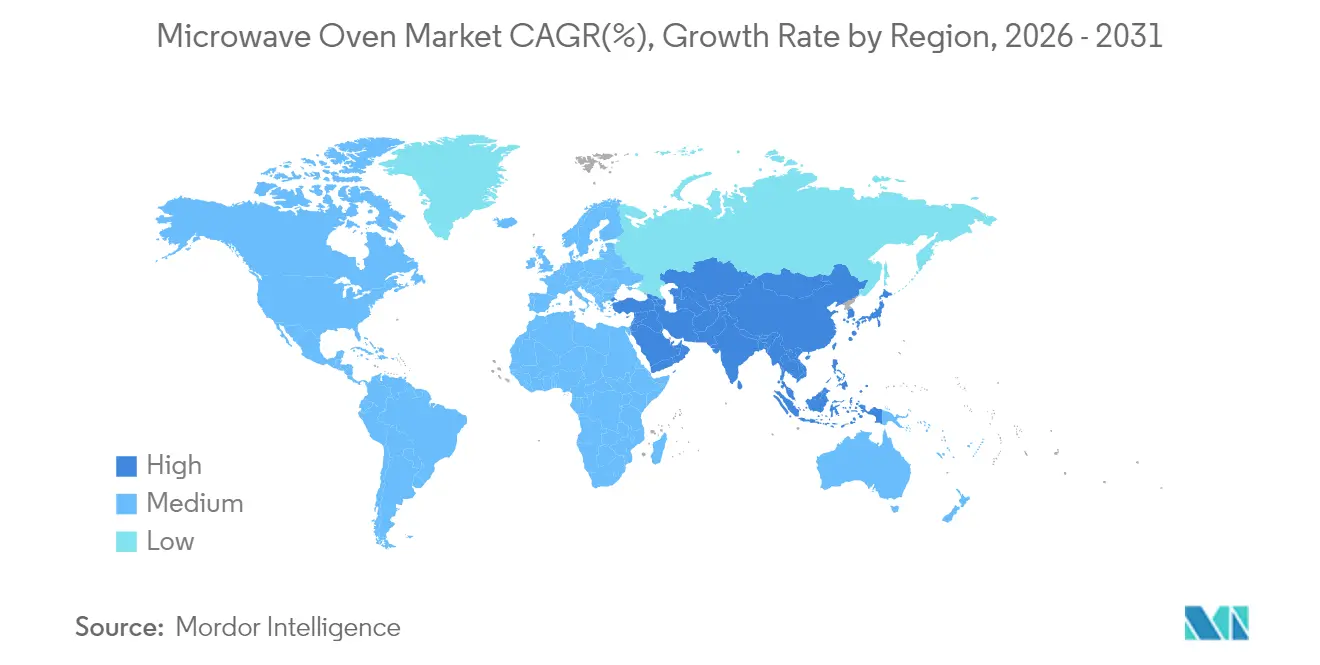
| Fastest Growing Market | Asia Pacific |
| Largest Market | Asia Pacific |
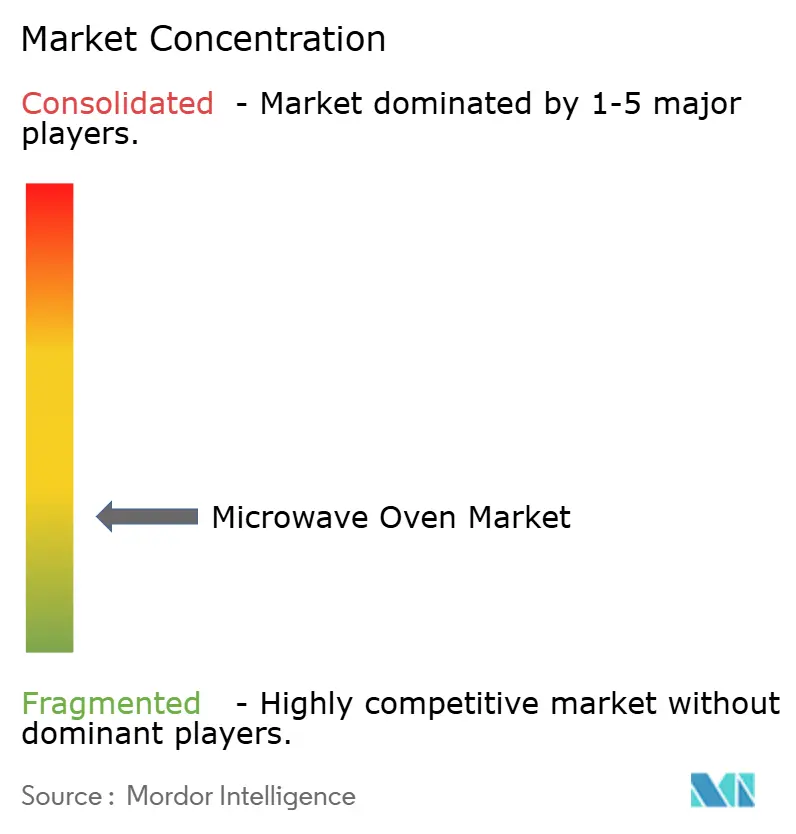
| Market Concentration | Low |
Major Players *Disclaimer: Major Players sorted in no particular order Image © Mordor Intelligence. Reuse requires attribution under CC BY 4.0. | |
Microwave Oven Market Analysis by Mordor Intelligence
The microwave oven market size was valued at USD 15.60 billion in 2025 and estimated to grow from USD 16.27 billion in 2026 to reach USD 20.09 billion by 2031, at a CAGR of 4.31% during the forecast period (2026-2031). Growth reflects steady replacement demand triggered by stricter energy-efficiency mandates, premium kitchen renovations, and the roll-out of smart-home platforms. Penetration in the United States is already mature at 96% of households, so value gains now hinge on higher average selling prices rather than first-time purchases. Forthcoming U.S. Department of Energy rules that cap standby draw at 0.6 W (microwave-only) and 1.0 W (convection) from June 2026 are expected to save consumers USD 1.6 billion in utility costs over 30 years, accelerating the shift toward compliant models [1]U.S. Department of Energy – “Energy Conservation Standards for Cooking Products”. Asia–Pacific retains the largest regional share, aided by China’s USD 27.9 billion trade-in subsidy program, which had benefited 29.64 million customers by December 2024. Globally, demand is also buoyed by rising frozen-meal consumption, the expansion of ghost kitchens, and growing preference for space-efficient appliances in nuclear households.
Key Report Takeaways
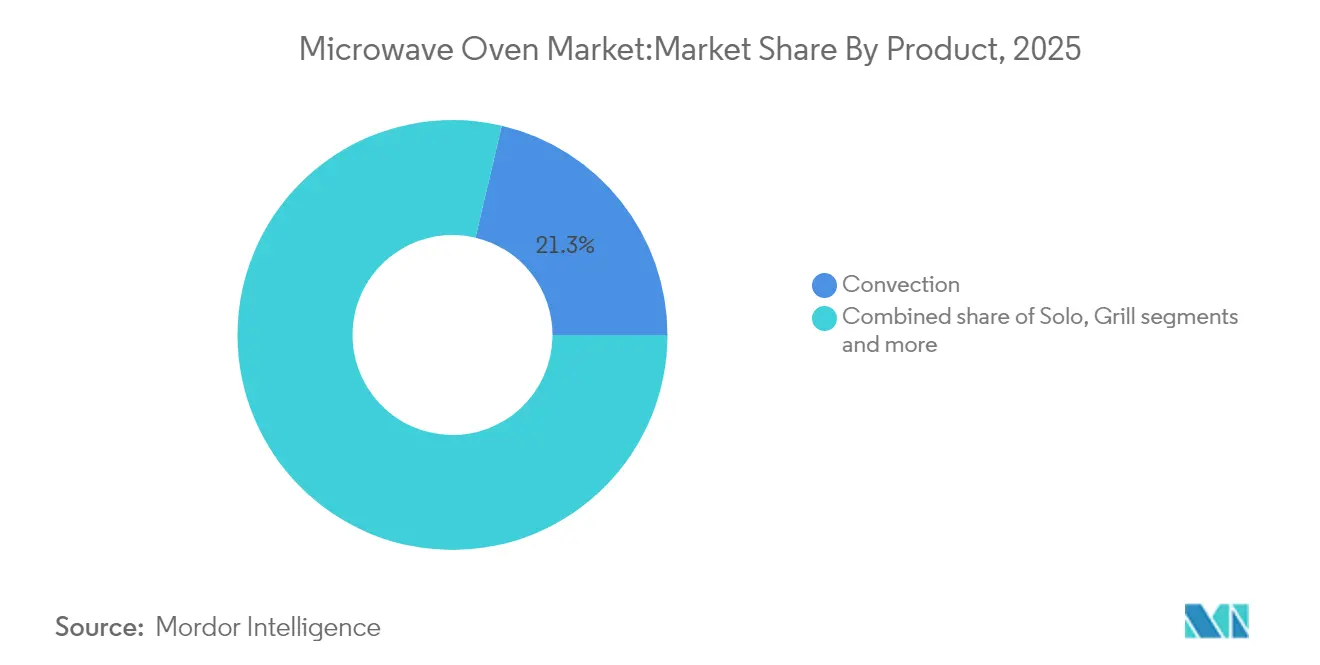
- By product type, convection microwaves led with 21.32% microwave oven market share in 2025, while grill units posted the fastest 5.63% CAGR through 2031.
- By structure, countertop models held 54.35% of 2025 revenue, yet built-in formats deliver the highest 5.88% CAGR to 2031.
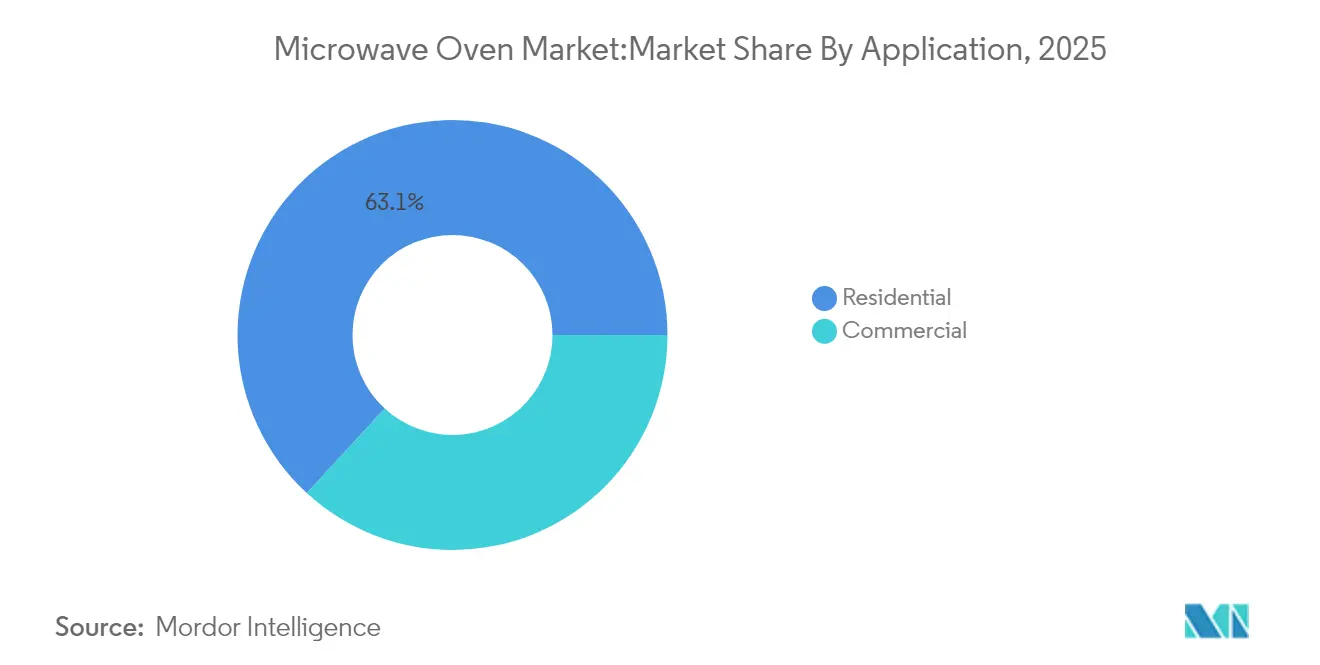
- By application, residential users accounted for 63.15% of the microwave oven market size in 2025 and will advance at a 5.44% CAGR.
- By distribution channel, multi-brand stores captured 37.62% of 2025 sales, whereas online outlets expanded at a 6.26% CAGR.
- By geography, Asia–Pacific commanded 33.74% of 2025 revenue and is expected to grow at 5.96% CAGR to 2031.
- Top 5 players such as Samsung, LG, Whirlpool, Panasonic, and Midea/Galanz hold major market share in 2024.
Note: Market size and forecast figures in this report are generated using Mordor Intelligence’s proprietary estimation framework, updated with the latest available data and insights as of 2026.
Global Microwave Oven Market Trends and Insights
Drivers Impact Analysis*
| Driver | (~) % Impact on CAGR Forecast | Geographic Relevance | Impact Timeline |
|---|---|---|---|
| Rising Disposable Income & Kitchen Renovation Trends | +1.2% | Global, with concentration in North America & Europe | Medium term (2-4 years) |
| Growing Demand for Ready-To-Eat Meals & Convenience Cooking | +0.8% | Global, strongest in Asia-Pacific urban centers | Long term (≥ 4 years) |
| Rapid Urbanization & Nuclear Households in Emerging Markets | +0.9% | Asia-Pacific core, spill-over to Latin America & MEA | Long term (≥ 4 years) |
| Utility-Sponsored Rebates for Ultra-Low-Standby-Power Models | +0.4% | North America & EU regulatory zones | Short term (≤ 2 years) |
| Ghost-Kitchen Adoption of High-Wattage Inverter Microwaves | +0.3% | Urban centers globally, led by North America & Asia | Medium term (2-4 years) |
| Source: Mordor Intelligence | |||
Rising Disposable Income & Kitchen Renovation Trends
The shift toward integrated kitchen designs favors built-in and over-the-range models, which command higher margins and align with smart home ecosystems. Rising disposable incomes in emerging markets are democratizing access to premium features previously confined to developed economies. The top decile of remodelers spends more than USD 180,000, supporting premium replacements that lift margins. As incomes rise, consumers opt for convection or grill variants that combine speed with browning, reinforcing an upscale trajectory for the microwave oven market.
Growing Demand for Ready-to-Eat Meals & Convenience Cooking
Convenience cooking is becoming a lifestyle necessity rather than a luxury, driven by urbanization, longer working hours, and changing household structures. According to a Houzz survey of 1,620 U.S. homeowners, sixty-five percent of households want sensor reheat or automated cooking programs, prompting brands to embed AI assistants, for instance, Panasonic’s HomeCHEF 4-in-1 platform. Convenience culture, longer working hours, and micro-families anchor a durable appetite for quick-serve appliances—traits directly boosting the microwave oven market.
Rapid Urbanization & Nuclear Households in Emerging Markets
Nuclear households, characterized by smaller family sizes and independent living arrangements, require compact yet versatile cooking solutions that microwaves uniquely provide. The factors such as higher income, urbanization, and smaller household sizes contribute to increased appliance adoption, with urban households in Eastern China expected to own most appliances by 2050. Chinese manufacturers adopt original-brand strategies to seize margin uplift in Southeast Asia and Latin America while servicing urban customers at home.
Utility-Sponsored Rebates for Ultra-Low-Standby-Power Models
Energy efficiency regulations are creating new market dynamics as the U.S. Department of Energy's standards limit standby power to 0.6 watts for microwave-only models and 1.0 watts for built-in convection units manufactured after June 22, 2026. The U.S. efficiency rule is complemented by utility rebates that lower purchase prices for compliant units. The Alliance to Save Energy projects cumulative consumer savings of USD 3 billion by 2030, motivating fast uptake. Canada has harmonized its rules, reinforcing a North American block of demand for next-generation, energy-lite ovens.
Restraints Impact Analysis*
| Restraint | (~) % Impact on CAGR Forecast | Geographic Relevance | Impact Timeline |
|---|---|---|---|
| Intense Price Competition Compressing Manufacturer Margins | -0.7% | Global, most severe in Asia-Pacific manufacturing hubs | Short term (≤ 2 years) |
| Consumer Health Concerns Over Nutrient Loss & Radiation Myths | -0.3% | Developed markets with high health consciousness | Medium term (2-4 years) |
| Raw Material Price Volatility Inflating BOM (Bill of Materials) Costs | -0.5% | Global supply chains, concentrated impact in Asia | Short term (≤ 2 years) |
| Source: Mordor Intelligence | |||
Intense Price Competition Compressing Manufacturer Margins
The competitive pressure stems from multiple sources, like Chinese manufacturers expanding globally with cost-competitive products, tariff impacts that raise input costs, and consumer resistance to price increases amid economic uncertainty. LG's record revenue of KRW 87.73 trillion (USD 61.4 billion) in 2024, despite operating profit declines, demonstrates how volume growth cannot compensate for margin erosion.
Consumer Health Concerns Over Nutrient Loss & Radiation Myths
Despite ARPANSA and CSIRO findings that microwaves retain nutrients and pose no radiation risk, myths linger, slowing premium adoption in wellness-focused segments. The Australian Radiation Protection and Nuclear Safety Agency (ARPANSA) confirms that microwave ovens are safe when used according to manufacturer instructions, with no evidence of health risks if maintained properly[2]Australian Radiation Protection and Nuclear Safety Agency, “Microwave Oven Safety,” arpansa.gov.au. . Still, pockets of misinformation suppress demand for premium units, especially among wellness-centred consumers.
*Our forecasts treat driver/restraint impacts as directional, not additive. The impact forecasts reflect baseline growth, mix effects, and variable interactions.
Segment Analysis
By Product: Convection Models Dominate Feature Upsell
Convection units held 21.32% of 2025 revenue. This slice of the microwave oven market appeals to households wanting traditional browning without a separate oven. Grill variants post the top 5.63% CAGR as crispy finishing gains favor with younger foodies. Solo ovens remain vital entry products for price-sensitive sectors and quick-service restaurants that prioritize reliability.
High-end sellers embed Wi-Fi diagnostics and firmware updates through Samsung’s Smart Forward ecosystem, keeping models current by software rather than hardware swaps. Other products, including compact and specialty models, serve niche applications but face pressure from multifunctional alternatives that offer better value propositions.


By Structure: Countertop Leads but Built-In Surges on Renovations
Countertop designs commanded 54.35% revenue in 2025 due to low installation barriers. Yet, built-in ovens grow 5.88% CAGR as remodelers favor unified cabinetry lines and flush aesthetics. Manufacturers standardize chassis dimensions, so the same internal platforms suit both placements, lowering tooling costs while widening model counts.
Housing trends and consumer lifestyle changes increasingly influence structural preferences. Samsung's showcase of built-in kitchen appliances at EuroCucina 2024, emphasizing connectivity and AI capabilities, illustrates how manufacturers are positioning integrated models as premium solutions. However, the rental market's growth, driven by high mortgage rates affecting home purchases, supports continued demand for portable countertop models that tenants can relocate.
By Control Feature: Button Panels Anchor Digital Shift
Button interfaces owned 71.02% share in 2025, aided by touch-sensitive membranes that enable multi-stage programming. Dial variants retreat to institutional niches needing glove-friendly hardware. GE Profile’s showcase at KBIS 2025 linked ovens to smart-speaker ecosystems so users can launch presets by voice.
Enhanced UIs feed data into energy dashboards, letting households optimize cycles for off-peak tariffs—a selling point heightened by utility rebate programs. Overall, the microwave oven market benefits from a control-panel arms race that lifts perceived value without major bill-of-materials inflation.

By Capacity: Mid-Range 25–29 Liter Units Remain Sweet Spot
The 25–29 liter class held 35.07% of 2025 shipments, balancing family-meal scope with counter depth. Meanwhile, 20–24 liter models grow 5.39% CAGR, favored by urban couples living in compact apartments. Appliance adoption studies link higher income and urban density to these mid-range cavities, reinforcing their primacy.
Internal volume gains come from slimmer magnetrons and top-mounted vents, letting brands market “bigger inside, same outside” upgrades. The microwave oven market share for 20–24 liter units reached 34.62% in 2025, reflecting rapid acceptance among first-time owners in Asia. Manufacturers are responding by optimizing internal cavity designs to maximize usable space within popular capacity ranges while maintaining external dimensions suitable for standard kitchen configurations.
By Application: Residential Sales Drive Innovation
Residential customers generated 63.15% of 2025 revenue and will post a 5.44% CAGR as smart-home bundles proliferate. LG reported KRW 33.2 trillion (USD 23.2 billion) in 2024 appliance revenue, with subscription models accounting for 36.2% of Korean unit sales. Such services marry hardware to consumables, elevating lifetime customer value.
Commercial demand—restaurants, hospitals, ghost kitchens—requires rugged builds and longer duty cycles. Although smaller, this slice of the microwave oven market yields steady orders because foodservice operators refresh fleets on fixed schedules. Manufacturers now adapt inverter technology from residential lines to meet commercial throughput criteria.
By Distribution Channel: Online Gains as Logistics Improve
Multi-brand stores still own 37.62% of 2025 sales due to in-person demos, but online channels post a 6.26% CAGR as carriers master appliance-grade delivery. LG’s direct-to-consumer portal bundles extended warranties and subscription billing, capturing margin otherwise ceded to retailers. Transparent pricing pressures physical stores to emphasize same-day pickup and financing.
Warehouse clubs and home-improvement chains cater to value shoppers and contractors. Exclusive brand boutiques bolster premium positioning, though they remain location-limited. The microwave oven market benefits from omnichannel strategies that unify inventories, promotions, and after-sales service.
Geography Analysis
Asia-Pacific retained 33.74% of the global microwave oven market revenue in 2025 and is forecast to have a 5.96% CAGR through 2031. China’s trade-in stimulus catalyzes replacements, while rising urban middle classes in India, Indonesia, and Vietnam embrace compact convection variants. Manufacturers such as Haier and Midea convert domestic cost leadership into export strength, deepening original-brand penetration in Latin America and Africa.
North America is a replacement-heavy territory with 96% household penetration, focusing growth on premium connected ovens and ultra-low-standby designs. The DOE standard taking effect in 2028 underpins a new cycle of compliant appliances expected to cut consumer energy outlays by USD 1.6 billion. At the same time, tariffs on imported finished goods raised average appliance prices 4.3% in May 2025 and could climb a further 19–31% if new duties are enacted. Manufacturers respond by concentrating on higher-margin SKUs, which remain widely available even as budget lines thin out
Europe posts steady gains as smart-home ecosystems and stringent energy labels steer buyers to built-in AI-ready ovens showcased at EuroCucina 2024. Utility rebates in Germany, France, and the Nordics reward ultra-low-standby designs, accelerating turnover. Latin America, the Middle East, and Africa offer emerging potential. Urban migration and electrification raise first-time ownership, while e-commerce addresses distribution gaps. These regions add incremental volume that supports global economies of scale within the microwave oven market.

Competitive Landscape
Five multinationals—Samsung, LG, Whirlpool, Panasonic, and Midea/Galanz—anchor a moderately concentrated field. Their combined strength is tempered by fast-growing regional challengers and retailer private labels that compete aggressively on price. LG booked 75% growth in subscription contracts, illustrating how service models offset hardware commoditization. Samsung’s Smart Forward firmware keeps installed units current, extending product lifecycles.
Strategic deals reshape scale and geography. Midea’s April 2025 acquisition of Küppersbusch’s parent strengthens its European footprint. Bosch explored Whirlpool acquisition to cement North American manufacturing. Panasonic’s AI alliance with Fresco accelerates software innovation, allowing differentiated cooking algorithms without owning all R&D in-house.
Compliance with tighter energy and safety codes raises entry hurdles, favoring capital-rich brands. Yet local companies exploit cultural familiarity and agile logistics to capture sub-national niches. Market leaders, therefore, invest in modular platforms that tailor control languages and recipe libraries for region-specific diets, balancing global scale with local nuance across the microwave oven market.
Microwave Oven Industry Leaders
Samsung Electronics Co. Ltd.
LG Electronics Inc.
Whirlpool Corporation
Panasonic Holdings Corporation
Midea Group / Galanz
- *Disclaimer: Major Players sorted in no particular order

Recent Industry Developments
- April 2025: Midea acquired the parent of Küppersbusch, bolstering its premium built-in range and European channel access.
- February 2025: GE Profile introduced a connected appliance suite at KBIS 2025, emphasizing whole-home interoperability.
- August 2024: Samsung rolled out Smart Forward updates, adding energy-saving modes and safety diagnostics across connected microwaves.


Research Methodology Framework and Report Scope
Market Definitions and Key Coverage
Our study defines the microwave oven market as the sale of new, factory-assembled electric ovens that heat food through dielectric heating at 300 MHz to 300 GHz, covering solo, grill, and convection units supplied to residential and commercial end users worldwide.
After careful review, portable magnetron spares, second-hand units, and industrial microwave tunnels for non-food processing lie outside this scope.
Segmentation Overview
- By Product
- Solo
- Grill
- Convection
- Other Products
- By Structure
- Countertop
- Built-in / Wall
- Over-the-Range
- By Control Feature
- Button Controls
- Dial Controls
- By Capacity
- Up to 19 litres
- 20 to 24 litres
- 25 to 29 litres
- 30 litres & above
- By Application
- Residential
- Commercial
- By Distribution Channel
- B2C/Retail
- Multi-brand Stores
- Exclusive Brand Outlets
- Online
- Other Distribution Channels
- B2B/Directly from the Manufacturers
- B2C/Retail
- By Geography
- North America
- Canada
- United States
- Mexico
- South America
- Brazil
- Peru
- Chile
- Argentina
- Rest of South America
- Europe
- United Kingdom
- Germany
- France
- Spain
- Italy
- BENELUX (Belgium, Netherlands, and Luxembourg)
- NORDICS (Denmark, Finland, Iceland, Norway, and Sweden)
- Rest of Europe
- Aisa Pacific
- India
- China
- Japan
- Australia
- South Korea
- South East Asia (Singapore, Malaysia, Thailand, Indonesia, Vietnam, and Philippines)
- Rest of Asia Pacific
- Middle East And Africa
- United Arab of Emirates
- Saudi Arabia
- South Africa
- Nigeria
- Rest of Middle East And Africa
- North America
Detailed Research Methodology and Data Validation
Primary Research
Telephone and web interviews with appliance OEM engineers, regional distributors, leading e-commerce merchandisers, and service technicians across Asia Pacific, North America, and Europe validate shipment assumptions, typical replacement cycles, and emerging smart-oven features.
Feedback loops let Mordor analysts resolve data gaps on gray imports, discounting patterns, and commercial kitchen retrofits.
Desk Research
Our analysts first mapped supply and demand using freely available datasets such as UN Comtrade shipment codes, the World Bank's household consumption tables, Eurostat retail indices, and customs records from the US Census Bureau; these establish baseline trade flow, pricing, and penetration signals.
Association sites such as AHAM and China Household Electrical Appliances Association enrich volume splits by product type, while patent filings (Questel) help track feature diffusion.
Next, company filings, IPO prospectuses, quarterly presentations, and news archives in D&B Hoovers and Dow Jones Factiva reveal brand strategies, channel share shifts, and average selling price (ASP) trajectories that feed directly into our model.
The sources cited above illustrate the range consulted; many additional public and subscription datasets were reviewed for completeness.
Market-Sizing & Forecasting
A top-down demand pool is established from household stock counts, urban household formation, and out-of-home food service outlet growth, which are then multiplied by observed replacement and first-time adoption rates.
Results are cross-checked through selective bottom-up supplier roll-ups (sampled unit shipments multiplied by channel-specific ASP) to fine-tune totals.
Key variables include disposable income per capita, electricity tariff trends, convection share migration, smart feature attach rates, and average product lifespan.
Multivariate regression, coupled with scenario analysis around energy efficiency regulation, projects values through 2030, while gap handling rules cap variance where data scarcity exists.
Data Validation & Update Cycle
Outputs pass anomaly checks, senior analyst peer review, and variance reconciliation versus import duties and retail scanner data.
Mordor refreshes numbers annually, triggering interim updates after material events such as regulatory shifts or major OEM recalls.
Why Mordor's Microwave Oven Baseline Elicits High Confidence
Published estimates often differ because firms vary product mix, include spare parts, or apply distinct currency conversions.
Key gap drivers here center on whether countertop units sold via gray channels are counted, if commercial combi ovens are blended into totals, and the cadence at which ASP erosion is refreshed. Mordor reports only verified factory-built ovens, reflects quarterly ASP shifts, and aligns all figures to constant 2024 USD before forecasting; other publishers may retain list prices or wider appliance bundles, leading to spread.
Benchmark comparison
| Market Size | Anonymized source | Primary gap driver |
|---|---|---|
| USD 15.60 B (2025) | Mordor Intelligence | - |
| USD 16.22 B (2024) | Global Consultancy A | Includes countertop gray market imports and rounded retail prices |
| USD 11.86 B (2024) | Trade Journal B | Excludes commercial ovens and uses limited customs data |
| USD 10.50 B (2024) | Industry Association C | Counts only units above 20 L capacity and omits online sales |
These comparisons show that once scope, price base, and update cadence are aligned, Mordor's disciplined blend of verified shipments and timely ASPs offers decision makers the most balanced, transparent baseline.


Key Questions Answered in the Report
What is the projected size of the microwave oven market by 2031?
The microwave oven market is forecast to reach USD 20.09 billion by 2031, up from USD 16.27 billion in 2026.
Which product type currently dominates microwave sales?
Convection models hold the largest 21.32% share, reflecting consumer desire for browning and baking capabilities.
Who are the key players in Microwave Oven Market?
LG Electronics Inc., Panasonic Corporation, Midea Group / Galanz, Samsung Electronics Co. Ltd. are the major companies operating in the Microwave Oven Market.
Why are built-in microwaves growing faster than countertop units?
Kitchen renovations prioritize seamless cabinetry and smart-home integration, pushing built-in models to a 5.88% CAGR.
How will new U.S. energy rules influence microwave purchases?
Standby-power caps effective in 2026–2028 will trigger a replacement cycle projected to save households USD 1.6 billion in electricity.
What strategies help manufacturers offset margin compression?
Firms focus on premium connectivity, AI cooking guides, and subscription services while pursuing selective acquisitions to build scale.
Page last updated on:


