
Market Overview
| Study Period | 2020 - 2031 |
|---|---|
| Market Size (2026) | USD 23.15 Billion |
| Market Size (2031) | USD 37.37 Billion |
| Growth Rate (2026 - 2031) | 10.06 % |
| Fastest Growing Market | Asia Pacific |
| Largest Market | North America |
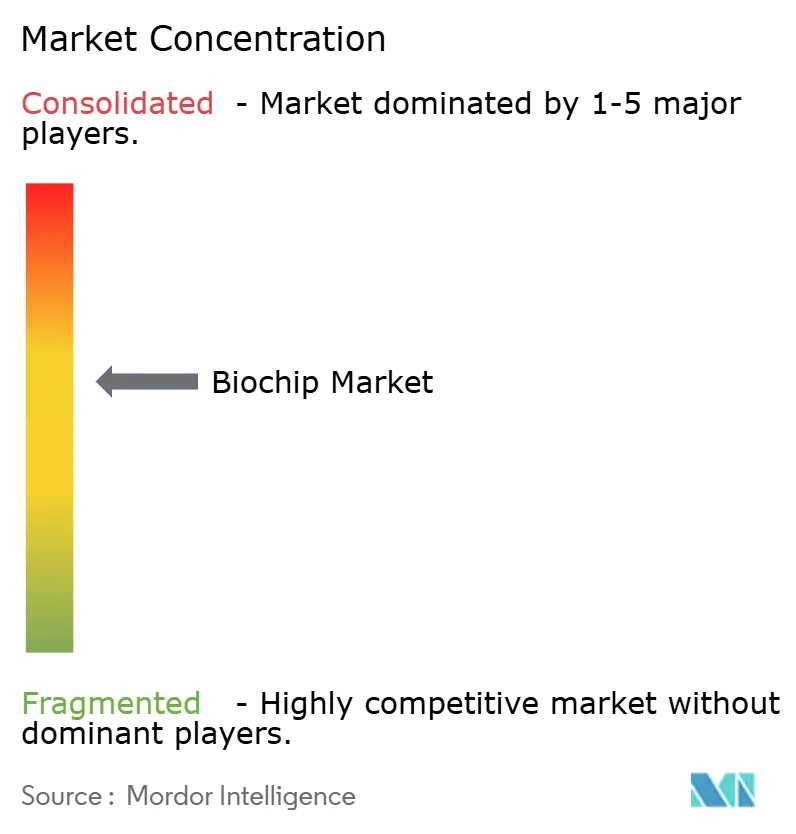
| Market Concentration | Medium |
Major Players *Disclaimer: Major Players sorted in no particular order Image © Mordor Intelligence. Reuse requires attribution under CC BY 4.0. | |
Biochip Product Market Analysis by Mordor Intelligence
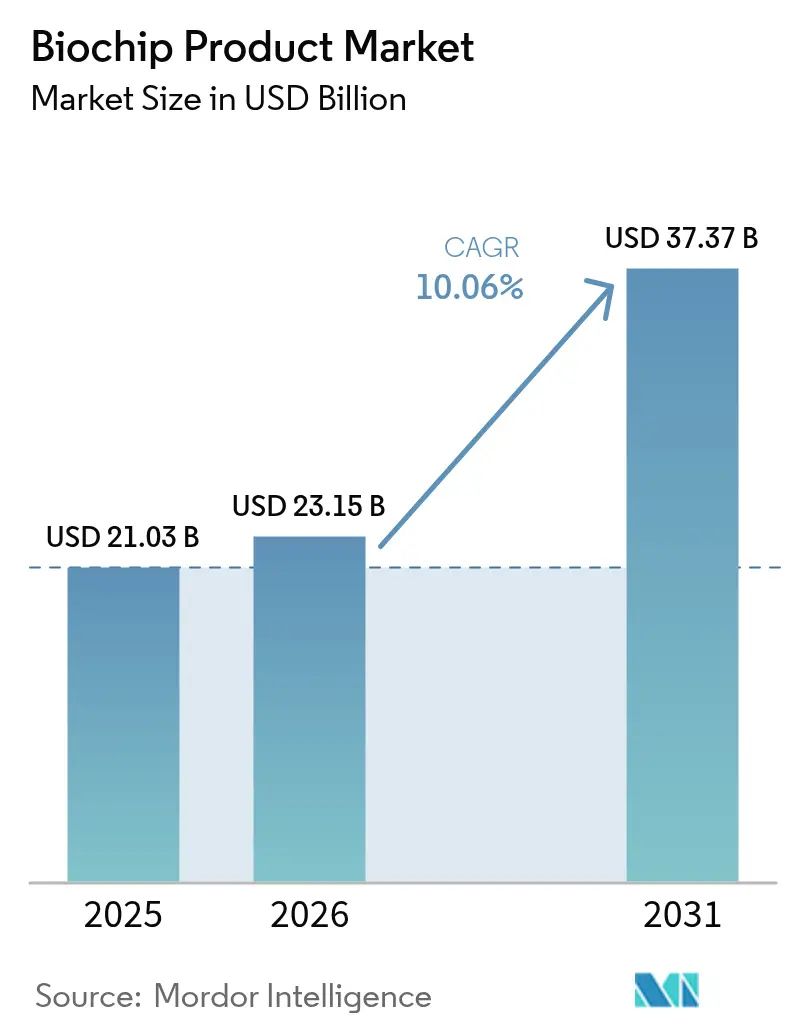
The biochip products market size is expected to grow from USD 21.03 billion in 2025 to USD 23.15 billion in 2026 and is forecast to reach USD 37.37 billion by 2031 at 10.06% CAGR over 2026-2031. The expansion reflects mounting demand for rapid, miniaturized diagnostics, steady integration of artificial intelligence, and broader acceptance of personalized medicine across clinical, veterinary, and research workflows. Point-of-care testing gains momentum, especially in resource-constrained hospitals that lack central laboratory infrastructure, because microfluidic cartridges shorten turnaround times and reduce the total cost of care. Asia-Pacific’s supportive funding programs, notably China’s USD 2.8 billion precision-medicine package and Japan’s regulatory harmonization, nurture regional manufacturing capacity and accelerate platform approvals. Venture funding for single-cell analysis technology hit USD 1.8 billion in 2024, signaling sustained investor conviction that biochip tools can displace legacy assays in oncology and chronic disease monitoring. At the same time, hybrid software-hardware bundles that deliver on-device analytics and cloud-hosted dashboards create new subscription revenue streams and lock-in effects for suppliers.
Key Report Takeaways
- Lab-on-a-chip devices commanded 53.98% of the biochip products market share in 2025 and are poised to expand at a 10.63% CAGR through 2031.
- Reagents and consumables generated 40.95% of 2025 revenue; and software and services represent the fastest-growing slice at an 11.04% CAGR.
- Clinical diagnostics retained 39.55% spend in 2025; and genomics and proteomics workflows are racing ahead at a 10.82% CAGR.
- Hospitals and diagnostic centers generated 43.20% of 2025 revenue; however, biotechnology and pharmaceutical firms are on track to deliver an 11.02% CAGR through 2031.
- North America contributed 39.00% revenue in 2025; whereas, Asia-Pacific represents the fastest-growing geography with a 10.79% CAGR.
Note: Market size and forecast figures in this report are generated using Mordor Intelligence’s proprietary estimation framework, updated with the latest available data and insights as of 2026.
Global Biochip Product Market Trends and Insights
Drivers Impact Analysis*
| Driver | % Impact on CAGR Forecast | Geographic Relevance | Impact Timeline |
|---|---|---|---|
| Increasing demand for point-of-care testing | +2.8% | Global, strong in APAC and MEA | Medium term (2-4 years) |
| Rising prevalence of chronic & infectious diseases | +2.1% | North America, Europe | Long term (≥ 4 years) |
| Expanding proteomics & genomics oncology uses | +1.9% | North America, EU, APAC | Medium term (2-4 years) |
| Rapid uptake of integrated microfluidics in veterinary care | +1.6% | North America, Europe, Latin America | Short term (≤ 2 years) |
| Venture investment surge in single-cell analysis start-ups | +1.4% | U.S., China innovation hubs | Short term (≤ 2 years) |
| Source: Mordor Intelligence | |||
Increasing Demand for Point-of-Care Testing
Portable microfluidic cartridges shorten diagnostic turnaround from hours to minutes inside emergency departments, enabling faster triage and improved bed management. Rural clinics rely on smartphone-linked biochip readers to process infectious-disease panels without central laboratory access, widening equitable care delivery. The FDA’s 2024 quality-systems guidance steers laboratories toward standardized, commercial biochip kits rather than customized bench assays, lowering compliance burden and boosting market uptake. Health ministries in APAC subsidize point-of-care devices to curb sample-transport costs across island and mountain geographies, expanding the biochip products market footprint. Commercial makers respond with cartridge bundles that store at ambient temperature for six months, eliminating cold-chain hurdles for remote facilities.
Rising Prevalence of Chronic & Infectious Diseases
More than 537 million adults live with diabetes, fueling continuous glucose monitoring demand that microfluidic sensors now address with painless skin patches IDF.ORG. Cardiovascular specialists adopt multiplex biochip panels to track lipid, troponin, and inflammatory markers from a single finger-stick sample, trimming laboratory fees. Pandemic-era investments in airport and school surveillance programs cement a role for portable viral-RNA cartridges that notify public-health dashboards in real time, safeguarding reopening strategies. Oncology protocols increasingly require longitudinal biomarker monitoring to adjust immunotherapy dosing, a workflow that favors low-volume, high-frequency biochip assays. Together, these patterns reinforce recurring consumable sales and drive double-digit reagent revenue growth inside the biochip products market.
Expanding Proteomics & Genomics Applications in Oncology
The FDA cleared 23 new companion diagnostics in 2024, with 18 stipulating multiplex biomarker evaluation that microfluidic chips deliver in a single run. Liquid biopsy businesses deploy cell-capture cartridges to isolate circulating tumor cells and cell-free DNA, offering oncologists a noninvasive alternative to tissue biopsies. Spatial proteomics, which maps protein expression across tissue architecture, depends on high-density chip arrays for simultaneous imaging and quantitation, catalyzing specialized platform sales. Combining single-cell sequencing with spatial mapping yields ultra-granular tumor-microenvironment insights that inform immunotherapy design, a fast-growing revenue pocket for niche suppliers. Oncology research budgets from pharmaceutical sponsors therefore underpin rising demand within the biochip products market.
Rapid Adoption of Integrated Microfluidics in Veterinary Diagnostics
USDA animal-health mandates now endorse on-site pathogen screens, prompting livestock producers to adopt handheld cartridges that detect foot-and-mouth disease in under 30 minutes USDA.GOV. Companion-animal clinics employ microfluidic panels to identify renal and endocrine disorders during a single visit, boosting client satisfaction and therapy adherence. Tele-veterinary services connect farm operators with lab technicians who remotely interpret chip-based results, reducing travel by specialists. Latin American ranchers leverage hormone-monitoring chips to optimize breeding cycles, lowering production costs and antibiotic use. These dynamics broaden end-user diversity and enlarge the biochip products market customer base beyond human health.
Restraints Impact Analysis*
| Restraint | % Impact on CAGR Forecast | Geographic Relevance | Impact Timeline |
|---|---|---|---|
| Design complexity & miniaturization limits | –1.8% | Global, acute in emerging economies | Medium term (2-4 years) |
| Availability of alternative high-throughput platforms | –1.2% | North America, Europe | Long term (≥ 4 years) |
| Supply-chain instability for specialty polymers & reagents | -0.8% | Global | Medium term (2-4 years) |
| Data-standardisation gaps hindering multi-omics biochip interoperability | -0.3% | Global | Medium term (2-4 years) |
| Source: Mordor Intelligence | |||
Design Complexity & Miniaturization Limits of Lab-on-Chip Platforms
Sub-micron channel fabrication demands Class 100 clean rooms and femtosecond laser tools, inflating capital costs for new entrants and raising unit prices of disposable cartridges. Integration of electrochemical sensors, optical detectors, and micro-valves inside millimeter-scale footprints heightens risk of cross-interference that can erode analytical sensitivity. Surface-chemistry treatments must balance biomolecule affinity with reagent stability across varied temperature and humidity environments encountered during shipping and storage. Validation cycles lengthen as developers test chip performance against blood, saliva, and tissue homogenates to satisfy IVDR and FDA benchmarks. These hurdles disproportionately impact smaller firms, tempering competitive intensity inside the biochip products market.
Availability of Alternative High-Throughput Platforms
Next-generation sequencing instruments deliver whole-genome data for under USD 200 per sample, drawing research budgets away from microarray-style gene expression chips. Mass-spectrometry workflows still outshine protein biochips when untargeted discovery is required, preserving installed-base momentum for large core facilities. Automated liquid-handling robots combined with 384-well ELISAs provide adequate multiplex capacity for many labs at a lower switching cost than microfluidic hardware. Flow cytometers analyze 30 parameters per cell at 10,000 cells per second, a throughput that biochip single-cell systems have yet to match convincingly. Familiarity and sunk-cost bias, therefore, slow migration toward integrated microfluidic devices in established institutions, moderating the headline growth rate of the biochip products market.
*Our forecasts treat driver/restraint impacts as directional, not additive. The impact forecasts reflect baseline growth, mix effects, and variable interactions.
Segment Analysis
By Type: Lab-on-Chip Dominance Accelerates
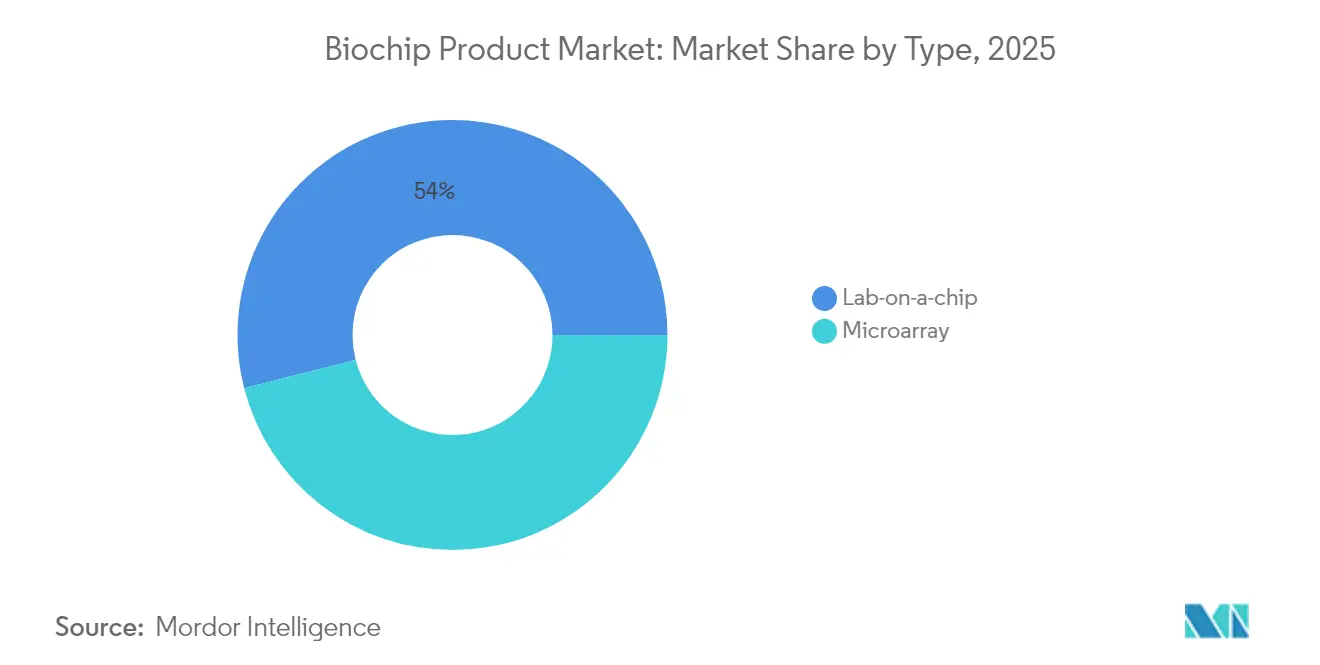
Lab-on-a-chip devices commanded 53.98% of biochip products market share in 2025 and are poised to expand at a 10.63% CAGR through 2031. Miniaturized sample-to-answer cartridges streamline clinical workflows by embedding lysis, amplification, and detection steps under software control, limiting operator variability and biohazard exposure. Artificial-intelligence modules adjust reagent flow rates in real time to compensate for viscosity fluctuations in whole-blood samples, further enhancing precision. Three-dimensional printing of elastomer molds slashes prototype lead times from weeks to days, encouraging custom assay development for rare diseases.
Microarray platforms still attract research grants for gene-expression profiling and SNP genotyping, yet their manual wash cycles and multi-hour hybridization limit suitability for time-critical diagnostics. As reagent consumption drops by up to 90% on integrated chips, hospital procurement teams favour the lower total cost of ownership. The expanding installed base of connected readers seeds recurring consumable demand, cementing lab-on-chip leadership inside the biochip products market.



By Product: Software Integration Drives Growth
Reagents and consumables generated 40.95% of 2025 revenue as each instrument placement triggers a long-tail cartridge stream that sustains gross margins above 65%. Nonetheless, software and services represent the fastest-growing slice at an 11.04% CAGR because algorithm subscriptions unlock incremental diagnostics without fresh capital expenditure. Cloud-based dashboards sync patient-level outputs from multiple test sites, enabling epidemiological surveillance and automated quality control flags.
Instrument sales plateau in mature markets once capacity matches test volumes, driving vendors to bundle analytics packages that extend revenue per installed reader. Application-programming interfaces connect chip outputs directly to laboratory information management systems, shortening result-entry cycles and enhancing compliance traceability. As predictive-maintenance updates arrive over-the-air, downtime drops and contract service fees shift toward data services, reshaping profit pools within the biochip products market.
By Application: Genomics & Proteomics Surge Ahead
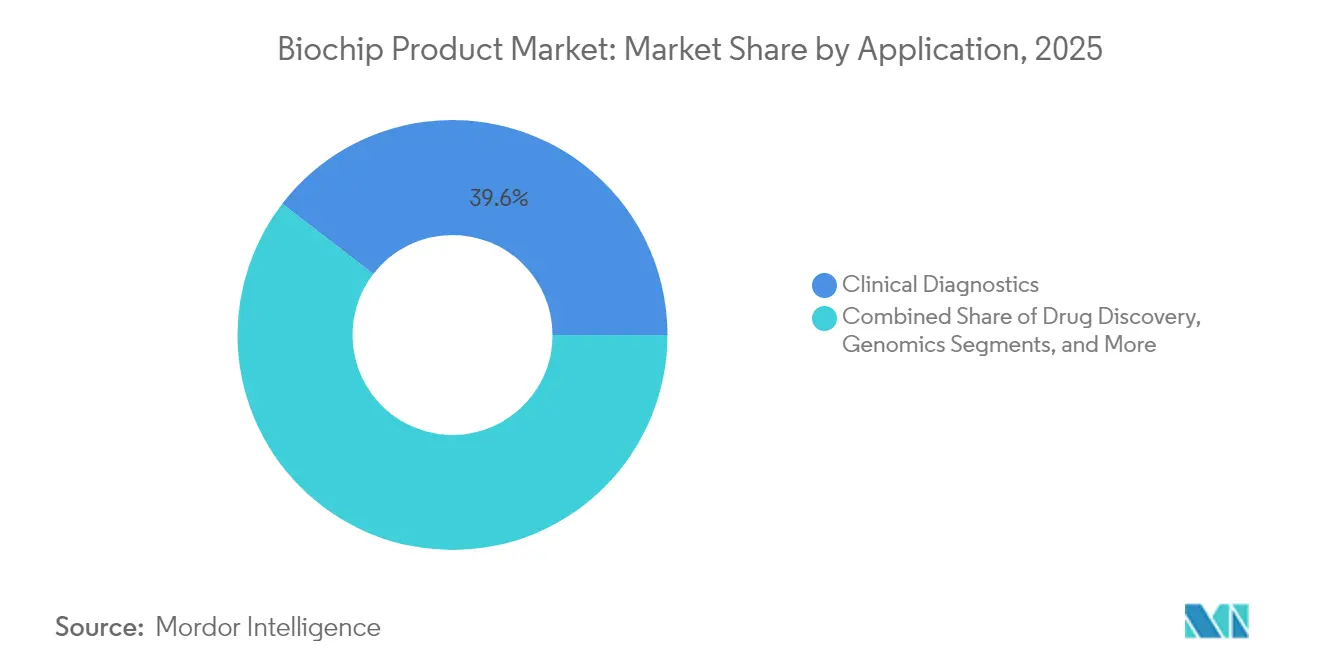
Clinical diagnostics retained 39.55% spend in 2025 because hospitals rely on microfluidic immunoassays for cardiac and metabolic panels. Yet genomics and proteomics workflows are racing ahead at a 10.82% CAGR as pharmaceutical sponsors embrace multiplex companion diagnostics that align therapy selection with molecular signatures. Spatial omics combines gene and protein mapping inside preserved tissue sections, a technique uniquely enabled by high-density chips that accommodate simultaneous fluorescent and mass-tag readouts.
Drug-discovery teams exploit low-volume reaction chambers to screen thousands of small-molecule candidates per day, conserving costly reagents and shortening hit-to-lead timelines. Environmental and food-safety inspectors deploy handheld cartridges to monitor pesticide residues and microbial contamination at field sites, circumventing central-lab bottlenecks. These diverse use cases reinforce the versatility narrative and broaden addressable segments for the biochip products market.
By End-User: Biotech & Pharma Companies Lead Adoption
Hospitals and diagnostic centers generated 43.20% of 2025 revenue because emergency departments favor rapid troponin and sepsis panels that expedite triage. However, biotechnology and pharmaceutical firms are on track to deliver an 11.02% CAGR through 2031 as they embed chips into drug-development pipelines for biomarker discovery and patient-stratification trials. Contract research organizations select IVDR-compliant cartridges to harmonize data across multi-site studies, boosting outsourcing volumes.
Academic labs continue to capture government grants that subsidize open-platform instruments compatible with custom assay scripting, preserving steady demand. Meanwhile, electronic health-record integrations allow real-time trial adaption based on molecular response, compressing development cycles and attracting additional pharma investment into the biochip products market ecosystem.
Geography Analysis
North America contributed 39.00% revenue in 2025 on the back of FDA’s streamlined 510(k) path for microfluidic in vitro diagnostics and CMS reimbursement that covers multiplex molecular panels. biotechnology clusters in Massachusetts and California foster early-stage adoption via academic-industry collaborations that field-test prototypes. Canada’s single-payer model negotiates volume contracts that reward cartridges demonstrating cost-effectiveness and clinical utility, while Mexico’s growing medical-device manufacturing base supplies consumables to regional markets and lowers export lead times.
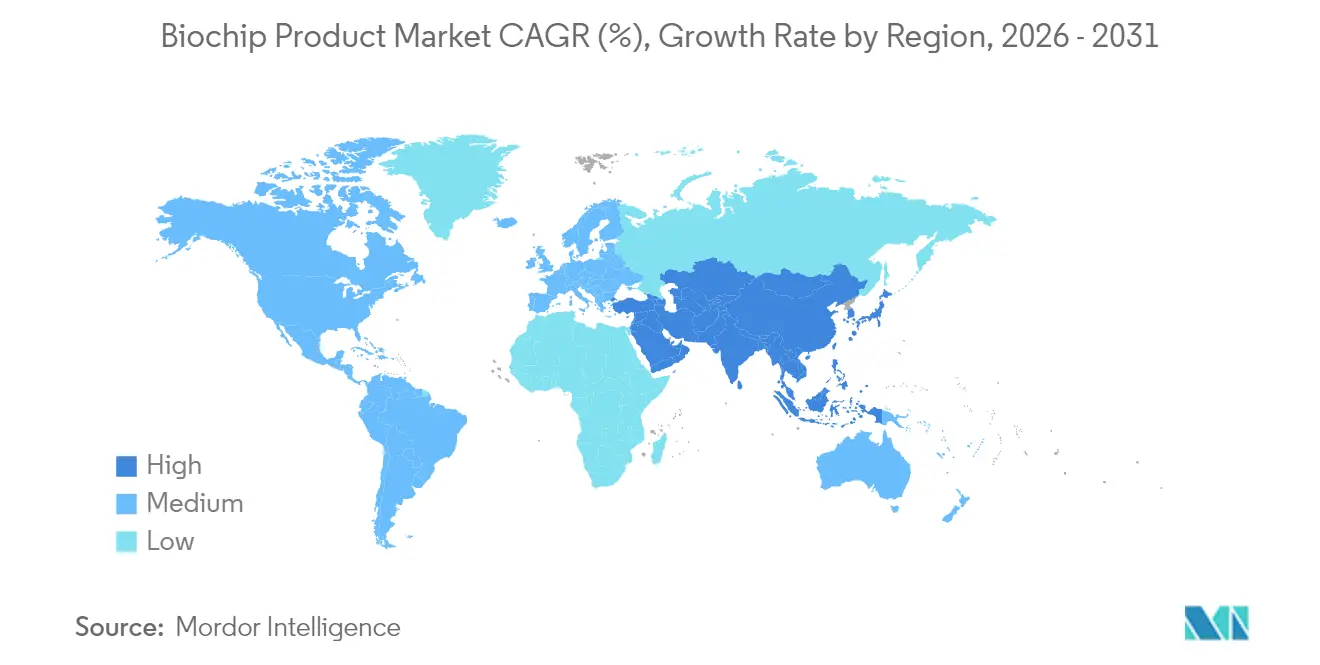
Asia-Pacific represents the fastest-growing geography with a 10.79% CAGR, propelled by China’s USD 2.8 billion precision-medicine investment and provincial tenders favoring domestic suppliers. Japan’s harmonization with FDA and EMA standards shortens approval cycles, encouraging multinational launches of connected readers. India’s National Digital Health Mission promotes home-based chronic-disease monitoring, spurring uptake of smartphone-paired microfluidic sensors. South Korea’s Smart Hospital Initiative mandates real-time diagnostic data integration, attracting cloud-enabled chip vendors. These policies collectively expand installed bases and deepen localization of reagent manufacturing inside the biochip products market.
Europe secures steady growth under the IVDR framework that imposes rigorous performance verification yet grants a single market passport across 27 member states. Germany’s precision-machining sector fabricates silicon and glass substrates, while France’s public-private genomics consortium purchases high-multiplex cancer panels. The U.K. leverages post-Brexit flexibility to pilot adaptive regulatory sandboxes for AI-enhanced diagnostics, cutting average clearance times by 20%. Middle East and Africa emerge as point-of-care hotspots where portable chips aid infectious-disease screening in refugee camps and remote clinics. Latin America gains from Brazil’s universal test reimbursement expansion and Argentina’s tax breaks for local biotech manufacturing, establishing fresh demand pockets for the biochip products market.

Regulatory Landscape
Regulation for biochip products is tightening around in vitro diagnostics and software-enabled outputs, pushing suppliers toward standardized quality systems and documented performance verification. In the United States, the FDA began a four-year phaseout of enforcement discretion for laboratory developed tests (May 2024), which increases the pull for commercially manufactured biochip kits aligned with medical-device requirements such as quality system controls and post-market obligations. In Europe, IVDR continues to raise the bar for clinical evidence and traceability for microfluidic IVDs and companion diagnostics, while Japan’s PMDA remains aligned with international approaches that support multinational launches when documentation is harmonized.
Standards activity also shapes interoperability and data governance across multi-omics workflows. ISO 16578:2022 remains a reference point for microarray-based detection of nucleic acid sequences, supporting method consistency across laboratories and suppliers. In June 2026, ISO published ISO 23494-1:2026 on provenance information models for biological materials and data, reinforcing expectations for data lineage and reproducibility that affect chip-based platforms used in regulated environments. For drug-development use cases, FDA programs such as ISTAND provide a pathway for qualification of new tools, including organ-on-a-chip systems, helping translate biochip outputs into evidence accepted by regulators and sponsors.
Competitive Landscape
The biochip products market exhibits moderate fragmentation: the top five suppliers hold roughly 46% combined revenue share, leaving room for specialized entrants. Thermo Fisher Scientific acquired Olink Proteomics for USD 3.1 billion in July 2024 to fuse spatial proteomics with existing microfluidic assets, signaling an arms race around multi-omics integration[2]U.S. Securities and Exchange Commission, “Thermo Fisher Scientific Form 8-K July 2024,” sec.gov. Abbott Laboratories expanded its point-of-care reach by licensing a smartphone-linked reader that interprets cardiac biomarkers from disposable cartridges. Qiagen gained CE-marking for its GeneReader NGS System with integrated sample prep, extending its foothold in European clinical genomics.
Innovation intensity is evident in the 2,847 biochip-related patent filings recorded worldwide in 2024, centered on valve miniaturization, low-noise electrochemical sensors, and AI-driven fluidic routing algorithms[3]United States Patent and Trademark Office, “Biochip Patent Activity Report 2024,” uspto.gov. Start-ups focusing on single-cell and spatial omics differentiate through niche performance metrics, frequently entering OEM partnerships with larger diagnostics firms to leverage manufacturing scale. Vendors strengthen customer lock-in by bundling proprietary cloud analytics and offering reagent-rental financing models that shift upfront costs to consumable contracts. Capital requirements for ISO 13485-compliant production and multi-jurisdiction regulatory dossiers sustain moderate barriers to entry, stabilizing competitive dynamics across the biochip products market.
Biochip Product Industry Leaders
Abbott Laboratories
Bio-Rad Laboratories Inc
Agilent Technologies Inc.
Thermo Fisher Scientific
BioMerieux SA
- *Disclaimer: Major Players sorted in no particular order

Market Opportunities and Future Outlook
White space is widening for biochips as validated, standardized analytical tools in pharmaceutical and bioprocess settings, not only as clinical IVDs. The United States Pharmacopeia (USP) has disclosed work toward a new General Chapter focused on biochip-based analytical technology (2024), creating a concrete standardization track that can bring biochip formats into routine quality control and method validation. This complements the report scope trend toward software and services, where compliance-grade audit trails and provenance requirements can be treated as part of the product offering rather than an add-on.
Supply localization and regional manufacturing footprints are another opportunity area, particularly for consumables and microfluidic cartridges that depend on specialty polymers and reagent availability. Thermo Fisher Scientific opened a new research and manufacturing facility in Brazil in July 2026 to support localized production and regional research collaboration, aligning with demand from hospitals, diagnostic networks, and life-science users seeking shorter lead times and more resilient supply. In parallel, academic work in 2026 describing integration of 3D dynamic cell culture, acoustofluidics, and advanced sensors into microfluidic diagnostic platforms points to a near-term pipeline for higher-content assays that can expand use in oncology, single-cell analysis, and organ-on-a-chip workflows within pharma R&D and translational labs.
Recent Industry Developments
- July 2026: Thermo Fisher Scientific opened a new research and manufacturing facility in Brazil to support localized production and regional R&D activities. The opening strengthens supply resilience for instruments and consumables and improves responsiveness to Latin American demand in clinical and research biochip workflows.
- April 2025: The FDA announced a plan to phase out animal testing requirements for monoclonal antibodies and other drugs, promoting alternative methods including organoids and organ-on-a-chip systems. This policy direction increases the relevance of biochip platforms in regulated drug development and method validation, broadening adoption beyond traditional diagnostics.
- July 2024: Thermo Fisher Scientific completed its USD 3.1 billion acquisition of Olink Proteomics, integrating proteomics capabilities with its broader life-science tools portfolio. The combination supports multi-omics workflows that rely on high-content chip-based assays and reinforces consolidation around end-to-end platforms and consumable pull-through.


Research Methodology Framework and Report Scope
Market Definition and Coverage
This market covers revenue generated from biochip products that enable lab-on-a-chip and microarray based testing and analysis, across clinical and research settings. We count the value of products sold and used for these workflows, tracked across major regions.
Scope exclusions: Pure lab services that only use biochips, custom R&D fees not tied to product sales, and general lab equipment that is not specific to biochip workflows are excluded.
Segmentation Overview
- By Type
- Lab-on-a-chip
- Microarray
- By Product
- Instruments
- Reagents and Consumables
- Software and Services
- By Application
- Clinical Diagnostics
- Drug Discovery
- Genomics and Proteomics
- Others (environmental, food-testing, forensics)
- By End-user
- Biotechnology & Pharmaceutical Companies
- Hospitals & Diagnostic Centers
- Academic & Research Institutes
- By Geography
- North America
- United States
- Canada
- Mexico
- Europe
- Germany
- United Kingdom
- France
- Italy
- Spain
- Rest of Europe
- Asia-Pacific
- China
- Japan
- India
- Australia
- South Korea
- Rest of Asia-Pacific
- Middle East and Africa
- GCC
- South Africa
- Rest of Middle East and Africa
- South America
- Brazil
- Argentina
- Rest of South America
- North America
Data Sources, Market Sizing, and Validation
Desk Research
Desk research was used to set the fact base and align market boundaries before modeling. We reviewed public health and science statistics and policy signals, such as sources from the US FDA, the US NIH, the World Health Organization, and the OECD, followed by peer reviewed journals covering microarrays, microfluidics, and point of care diagnostics.
To cross-check commercialization signals, we also used sources such as company annual reports and investor presentations, patent databases, reputable press coverage of product approvals and launches, and selected trade and customs releases where relevant. A paid subscription for company financials and a paid patent database were referenced selectively to standardize financial timelines and innovation activity. These are illustrative sources only, and many other public and reference materials were also used for data collection, validation, and clarification.
Primary Interviews and Surveys
Primary work focused on validating what is actually being purchased and deployed across lab-on-a-chip and microarray workflows, and how pricing and replacement cycles are moving. We spoke with a balanced mix of product-side and user-side stakeholders across APAC, EMEA, and the Americas, and then used those inputs to tighten assumptions on adoption, average selling prices, and end user demand patterns.
Distribution of primary research fieldwork respondents
| Company type | Respondent position | Region |
|---|---|---|
| Top tier: 29% | CXOs: 21% | APAC: 48% |
| Mid tier: 50% | Functional/Unit leaders: 29% | EMEA: 32% |
| Smaller Players: 21% | Managers: 50% | Americas: 20% |
Market-Sizing & Forecasting
Sizing starts with a top-down build where diagnosis and research testing activity, along with biochip penetration in those workflows, is used to reconstruct an addressable demand pool by region. Once that pool is established, we apply market-specific price and mix logic, and then reconcile the result using selective bottom-up checks such as sampled product line revenue mapping, channel feedback on typical order sizes, and a simple ASP times volume sanity check.
The model is informed by practical inputs that can be verified and updated, including microarray versus lab-on-a-chip mix shifts, instrument placement and replacement cycles, reagent and consumable pull-through behavior, clinical diagnostics versus drug discovery demand balance, and regional funding and regulatory momentum that affects adoption timing. For forecasting, we use scenario analysis supported by expert consensus on how these drivers move under base case conditions, and gaps in bottom-up views are handled with conservative interpolation anchored to observable install-base and usage patterns.
Data Validation & Update Cycle
Outputs are validated through triangulation across independent signals, including consistency checks between adoption rates, implied volumes, and realistic price ranges by product category. Where numbers look unusual, we re-check unit economics, currency timing, and year alignment, and then re-contact sources when a variance cannot be explained with public evidence.
Before sign-off, the work is reviewed in multiple steps so assumptions, calculations, and supporting notes line up cleanly. Reports are refreshed annually, and interim updates are made when material events occur, such as major regulatory changes or step-changes in testing demand. Right before delivery, we run a fresh pass on key inputs so clients receive the most current view.
Mordor Intelligence's Biochip Product Market Estimate Compared With Other Published Estimates
Published market numbers for biochips often differ because each publisher draws the line in a slightly different place, and the same term can cover microarrays, lab-on-a-chip, and adjacent platform elements. Differences also come from the year used for pricing, whether the view is global or limited to select countries, and how quickly assumptions are refreshed when new products and clinical use cases scale.
The largest gaps usually come from scope and what is counted as product revenue, especially when some estimates bundle wider platform content like integrated controllers and software, or when they treat instruments and consumables as a single bucket with limited mix detail. Another practical driver is how adoption is estimated, because using only high-level growth rates can miss changes in testing volume and replacement cycles, which are key in a market like this and are handled through explicit lab-on-a-chip and microarray demand indicators, a modeling choice applied by Mordor Intelligence.
Benchmark comparison
| Source | Market Size | Gaps in Research Methodology |
|---|---|---|
| Mordor Intelligence | USD 23.15 B (2026) | |
| Industry Research Publisher A | USD 15.32 B (2025) | Uses a broader biochips definition and different base year, and the accessible scope notes do not clearly state whether instruments, consumables, and software/services are consistently included or separated, which can shift totals. |
| Market Outlook Publisher B | USD 14.32 B (2025) | Appears to include more integrated platform elements (such as scanners, imaging systems, and analytical software) inside the market value, which can inflate the product total compared with a tighter product-only accounting. |
Looking across the table, the spread is mainly explained by year alignment and what gets bundled into the counted revenue, rather than a disagreement on the direction of growth. By keeping assumptions traceable to adoption, mix, and price drivers that can be checked and re-checked, the estimate stays practical to reproduce and update when new evidence emerges.


Key Questions Answered in the Report
What is the current size and projected CAGR for the biochip products market?
Valuation stands at USD 23.15 billion in 2026 and is forecast to grow at a 10.06% CAGR to USD 37.37 billion by 2031.
Which product category is growing fastest in biochip solutions?
Software and services exhibit the highest expansion, advancing at an 11.04% CAGR as AI analytics and cloud dashboards gain traction.
Who are the leading companies shaping competitive dynamics?
Thermo Fisher Scientific, Abbott Laboratories, Qiagen, and Agilent Technologies together hold close to half of global revenue after recent acquisitions and product launches.
Why is Asia-Pacific recording the strongest growth?
Government precision-medicine funding, harmonized regulations, and expanding local manufacturing capacity push Asia-Pacific toward a 10.79% CAGR through 2031.
How do point-of-care platforms add value to hospital operations?
Integrated microfluidic cartridges cut diagnostic turnaround from hours to minutes, improving triage speed and lowering overall care costs.
What key technical obstacle could constrain future adoption?
Sub-micron channel fabrication increases complexity and cost, creating barriers for smaller firms and limiting price-sensitive deployments.
Page last updated on:


 Your data is secure and never sold or shared.


