
Microbial Identification Market Size and Share
Market Overview
| Study Period | 2020 - 2031 |
|---|---|
| Forecast Data Period | 2026 - 2031 |
| Market Size (2026) | USD 4.49 Billion |
| Market Size (2031) | USD 6.94 Billion |
| Growth Rate (2026 - 2031) | 9.07 % |
| Fastest Growing Market | Asia Pacific |
| Largest Market | North America |
Major Players *Disclaimer: Major Players sorted in no particular order Image © Mordor Intelligence. Reuse requires attribution under CC BY 4.0. | |
Microbial Identification Market Analysis by Mordor Intelligence
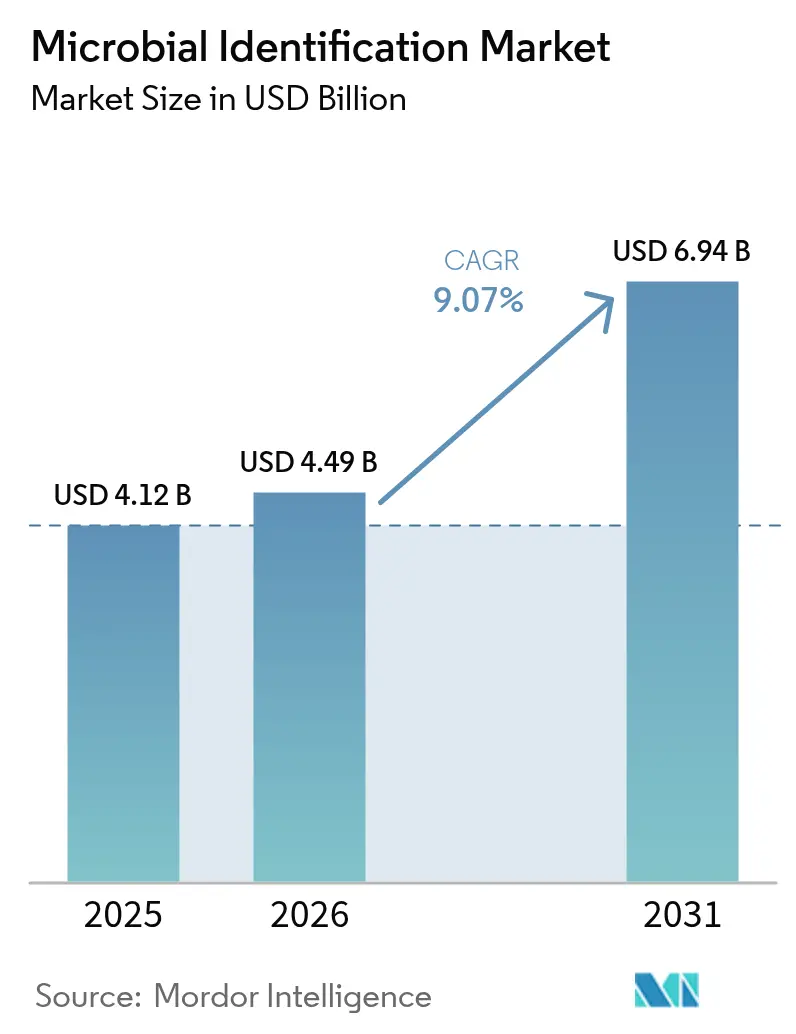
microbial identification market size in 2026 is estimated at USD 4.49 billion, growing from 2025 value of USD 4.12 billion with 2031 projections showing USD 6.94 billion, growing at 9.07% CAGR over 2026-2031. The transition from culture-based assays to molecular platforms, intensified antimicrobial-resistance surveillance, and quicker turnaround expectations are the key forces sustaining momentum. Vendors are broadening technology portfolios, regulators are clarifying approval pathways, and healthcare systems are investing in real-time data integration. At the same time, staffing shortages and high capital requirements temper adoption in resource-constrained settings. Long-term growth prospects remain strong as artificial-intelligence tools extend pathogen libraries and as food-safety rules tighten across emerging economies.
Key Report Takeaways
- By technology, MALDI-TOF mass spectrometry held 56.90% of the microbial identification market share in 2025, whereas PCR and real-time PCR are set to grow at a 12.22% CAGR through 2031.By application, clinical diagnostics accounted for 55.00% of the microbial identification market size in 2025; environmental monitoring is projected to expand at 12.05% CAGR to 2031.By end user, hospitals and clinical laboratories dominated with 61.80% revenue share in 2025, while pharmaceutical and biotechnology companies will register the fastest 11.21% CAGR to 2031.By geography, North America led with 39.10% revenue share in 2025; Asia-Pacific is the fastest-growing region at 11.08% CAGR through 2031.
Note: Market size and forecast figures in this report are generated using Mordor Intelligence’s proprietary estimation framework, updated with the latest available data and insights as of 2026.
Market Trends and Insights
Drivers Impact Analysis of Microbial Identification Market*
| Driver | (~) % Impact on CAGR Forecast | Geographic Relevance | Impact Timeline |
|---|---|---|---|
| Rapid adoption of MALDI-TOF MS in routine diagnostics | +2.1% | Global, with accelerated uptake in APAC | Medium term (2-4 years) |
| Growth of antimicrobial-resistance (AMR) surveillance programs | +1.8% | Global, concentrated in North America & EU regulatory frameworks | Long term (≥ 4 years) |
| Rising food-safety regulations in emerging economies | +1.4% | APAC core, spill-over to Latin America | Medium term (2-4 years) |
| Integration of AI-powered spectral libraries | +0.9% | North America & EU early adoption, global expansion | Long term (≥ 4 years) |
| Expansion of decentralized POCT microbial ID systems | +0.7% | Global, with priority in resource-constrained settings | Short term (≤ 2 years) |
| Source: Mordor Intelligence | |||
Rapid Adoption of MALDI-TOF MS in Routine Diagnostics
Laboratories now generate species-level identification within minutes rather than hours by using high-throughput MALDI-TOF platforms that process up to 600 samples per hour, matching the accuracy of 16S rRNA sequencing at lower reagent cost. Expanded reference databases covering more than 4,300 species enable the same instrument to support food, pharmaceutical, and clinical workflows. The United States Food and Drug Administration placed these systems in Class II with special controls in June 2025, giving manufacturers a clearer, faster clearance route while preserving safety standards [1]Source: Federal Register, “Medical Devices; Immunology and Microbiology Devices; Classification of the Clinical Mass Spectrometry Microorganism Identification and Differentiation Device,” federalregister.gov .
Growth of Antimicrobial-Resistance Surveillance Programs
More than 2.8 million AMR infections occurred annually in the United States, resulting in 35,000 deaths, which prompted whole-genome sequencing adoption across surveillance networks. China’s national CHINET program reported carbapenem resistance in 10% of Enterobacter isolates by 2021, highlighting convergent global pressure for rapid identification. Timely organism profiling helps pharmacists tailor effective therapy and shorten hospital stays.
Rising Food-Safety Regulations in Emerging Economies
Malaysia’s updated Food Act and Hygiene Regulations demand that processors validate contamination controls with rapid tests, pushing small firms to adopt traceable microbial workflows. Immunomagnetic chemiluminescent assays now detect as low as 1 CFU/g of Salmonella Typhimurium in ground chicken, underscoring how regulation is driving assay sensitivity. Predictive microbiology models and IoT-enabled sensors are further embedding continuous identification capabilities along food supply chains.
Integration of AI-Powered Spectral Libraries
Machine-learning algorithms trained on mass-spectra datasets achieve 96.3% sensitivity and 100% specificity, cutting analysis time to fractions of a second. Deep-learning genome analysis tools reduce culture dependence and augment accuracy for hard-to-grow organisms frontiersin.org. Hospitals deploying AI decision support saw faster kidney-stone and fecal pathogen analysis, freeing staff for higher-complexity tasks.
Restraints Impact Analysis of Microbial Identification Market*
| Restraint | (~) % Impact on CAGR Forecast | Geographic Relevance | Impact Timeline |
|---|---|---|---|
| High instrument & maintenance costs | -1.6% | Global, particularly impacting emerging markets | Short term (≤ 2 years) |
| Shortage of skilled mass-spectrometry technicians | -1.2% | North America & EU, expanding to APAC | Medium term (2-4 years) |
| Lack of standardization for environmental isolates | -0.8% | Global, with acute impact in environmental monitoring | Medium term (2-4 years) |
| Cyber-security risks in cloud-based ID platforms | -0.5% | North America & EU primarily, expanding globally | Long term (≥ 4 years) |
| Source: Mordor Intelligence | |||
High Instrument and Maintenance Costs
Capital expenditure for an advanced MALDI-TOF system can exceed USD 200,000, while service contracts add 10-15% of purchase price each year, restricting uptake in mid-tier hospitals. New Clinical Laboratory Improvement Amendments performance goals adopted in 2024 require tighter sigma metrics, which may oblige smaller labs to upgrade or replace equipment sooner than planned.
Shortage of Skilled Mass-Spectrometry Technicians
Vacancy rates for medical laboratory scientists reached 46% in the United States, with only one professional per 1,000 inhabitants, and 65% of California public-health labs reported open positions. Specialized mass-spectra interpretation skills are scarce, and insufficient training slots limit new entrants, creating a bottleneck for technology deployment[2]Source: California Department of Public Health, “CLTAC Laboratory Workforce Report 2022,” cdph.ca.gov .
*Our forecasts treat driver/restraint impacts as directional, not additive. The impact forecasts reflect baseline growth, mix effects, and variable interactions.
Microbial Identification Market Segment Analysis
By Product & Service:
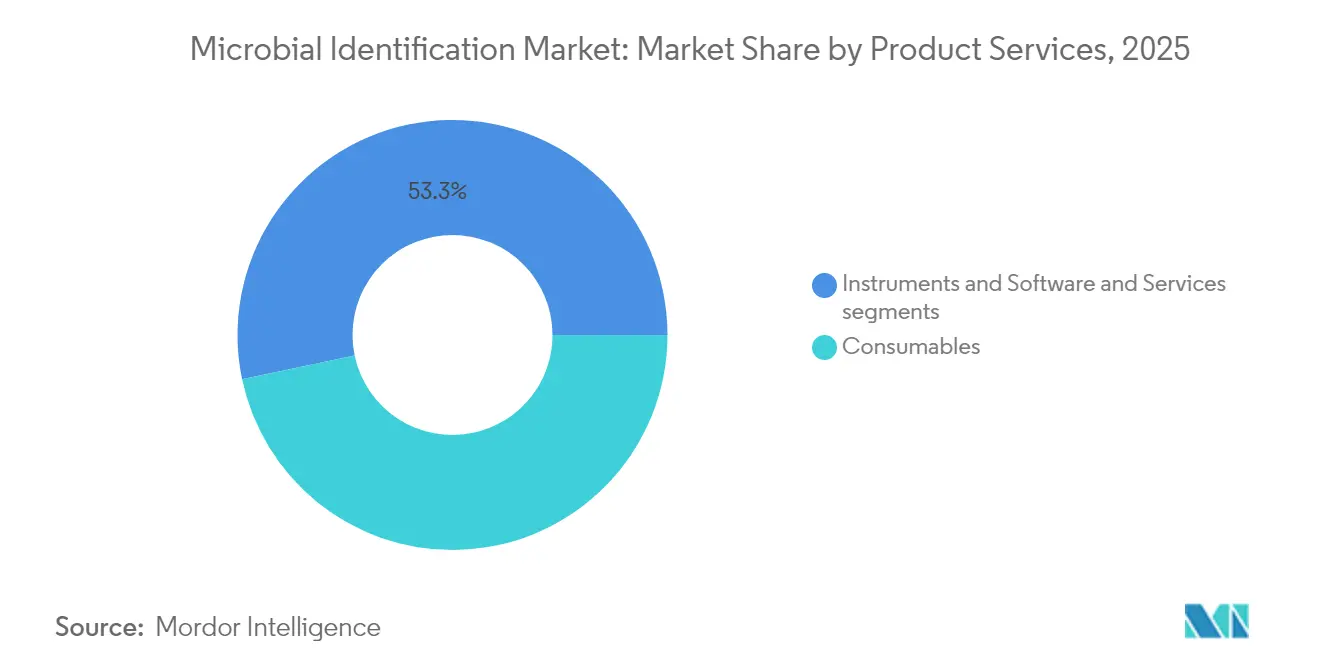
Consumables Drive Revenue While Software Accelerates GrowthConsumables generated 46.70% of 2025 revenues as labs relied on high-volume reagents and media needed for every run, giving the microbial identification market recurring cash flow resilience. Software and services, though smaller, are growing the fastest at 11.32% CAGR as laboratories upgrade to cloud laboratory-information systems that automate data movement and analytics. Next-generation “dark labs” showcasing robotics and AI illustrate how software layers mitigate staffing gaps while boosting throughput .The shift also highlights a broader move toward subscription licensing for analytics dashboards, offering predictable margins to vendors and quicker payback for users. As quality-control regulations tighten, cloud-hosted platforms that log instrument performance and flag deviations in real time are becoming critical. This software uptake is expected to maintain double-digit growth through 2031, cementing digital processes as a core competitive differentiator across the microbial identification market.



By Technology:
MALDI-TOF MS Dominance Faces PCR Innovation ChallengeMALDI-TOF MS retained a 56.90% revenue share in 2025 on the strength of unmatched speed–to-result, low per-test cost, and a continuously expanding organism library. The microbial identification market size for MALDI-TOF platforms is still expanding, yet growth is moderating as penetration rises in North America and Europe. PCR and real-time PCR, by contrast, will post the sharpest 12.22% CAGR through 2031 as multiplex panels and point-of-care formats reach primary‐care clinics. Four separate FDA clearances for a flagship syndromic PCR analyzer in 2024 illustrate regulatory momentum.Hybrid workflows are emerging in which laboratories first screen with MALDI-TOF, then reflex to PCR or sequencing for resistance genes, combining breadth with depth. Cross-platform data convergence is spurring new consumable and service bundles, allowing manufacturers to defend share while tapping incremental revenue from complementary molecular assays.
By End User:
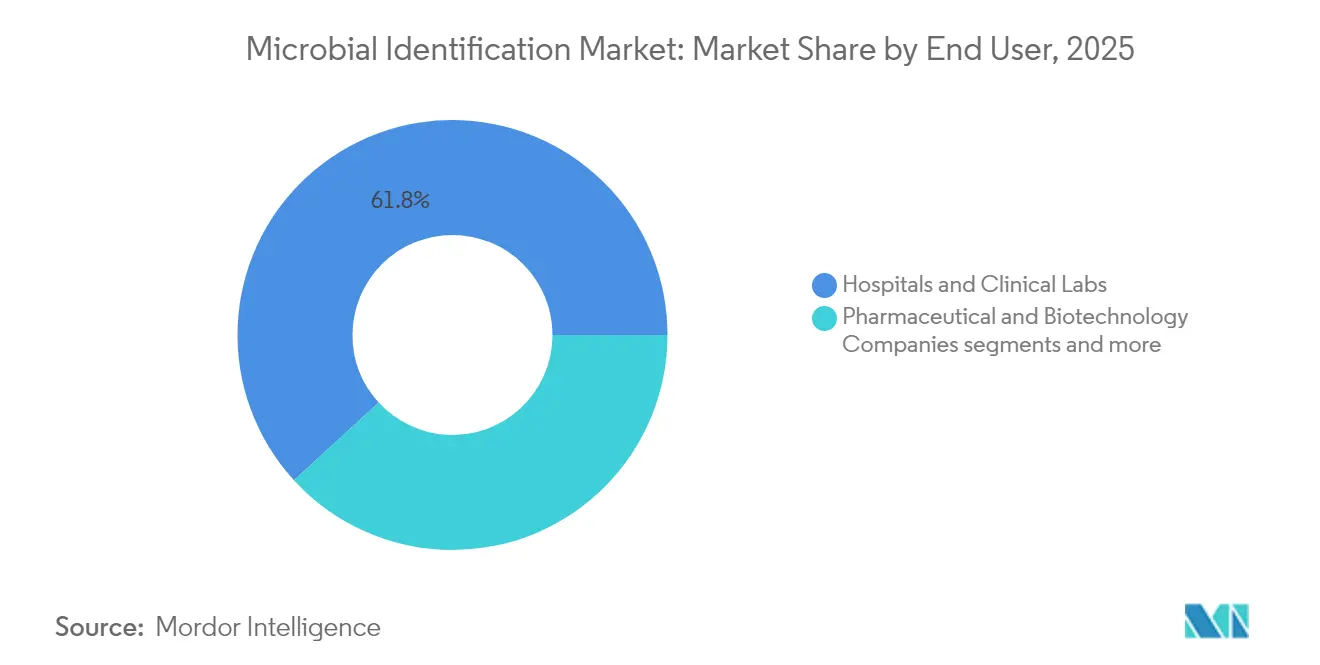
Hospitals Lead While Pharma Accelerates InnovationHospitals and clinical laboratories generated 61.80% of 2025 revenue, anchoring the microbial identification market in routine patient diagnostics and infection control mandates. These facilities benefit from bundled procurement contracts and dedicated infection-prevention budgets that favor broad-menu, automated systems. Meanwhile, pharmaceutical and biotechnology companies, projected to grow at 11.21% CAGR, are ordering rapid identification instruments for in-process contamination checks and for matching therapeutics with companion diagnostics. A leading instrument maker partnered with a top-ten drug company to co-develop AI-powered precision-medicine assays, underscoring demand pull from manufacturing and R&D pipelines.The expansion of cell-gene therapies, which have low microbial contamination thresholds, strengthens the case for rapid identity confirmation throughout production. Environmental and industrial labs are also adopting portable mass-spec modules to track water pathogens, but their spending remains smaller than clinical and pharmaceutical buyers for now.
By Application:
Clinical Diagnostics Dominance Meets Environmental Monitoring SurgeClinical diagnostics accounted for 55.00% of 2025 sales, reinforcing the microbial identification market as an indispensable component of patient management protocols. Hospitals rely on species-level data to refine antimicrobial stewardship and to meet reporting obligations under national action plans. Environmental monitoring, projected to log a 12.05% CAGR, is gaining urgency as climate-linked shifts in pathogen ecology and water-quality incidents prompt regulators to expand testing. A microfluidic sensor capable of on-site detection in water supplies demonstrates how field-deployable technologies can plug gaps between sample collection and lab processing.In pharmaceutical manufacturing, strict aseptic conditions and rising biologics output fuel uptake for in-line contamination checks. Food safety laboratories are integrating predictive AI models that simulate microbial growth and alert quality teams before spoilage thresholds are breached, using identification data as feedback. Together these dynamics diversify demand drivers beyond hospital walls and sustain a balanced long-term outlook for the microbial identification market.
Geography Analysis
North America Microbial Identification Market
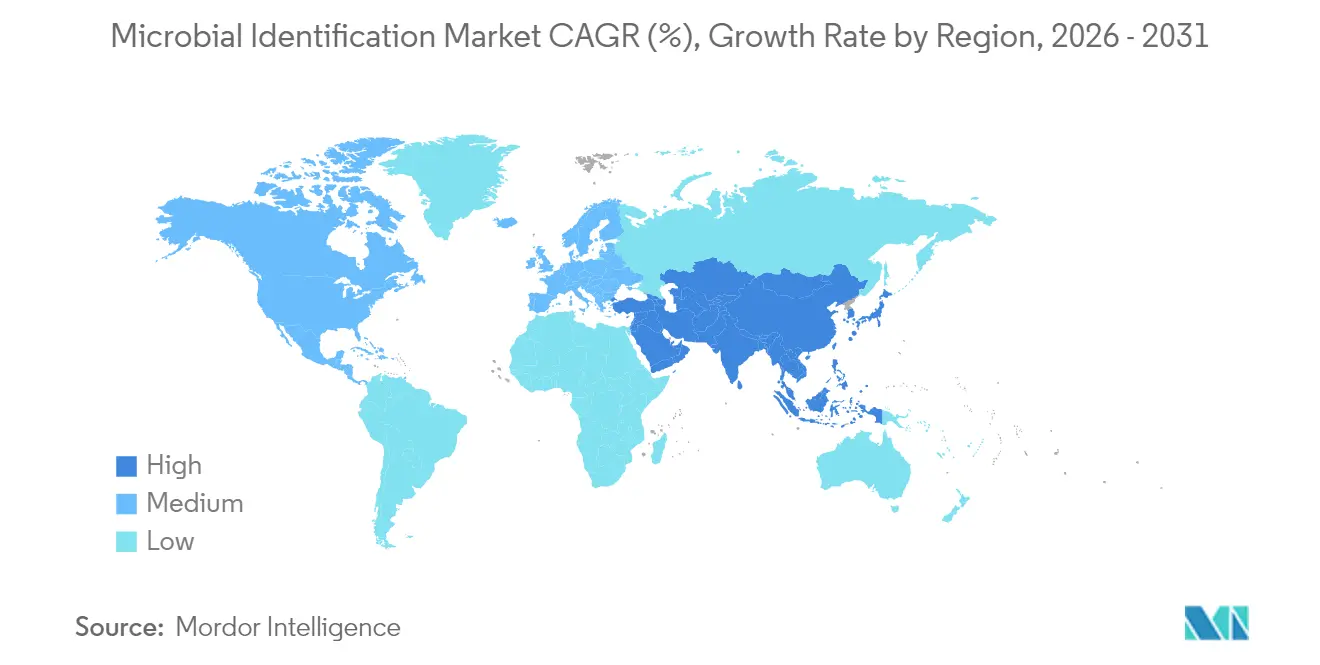
North America remained the largest revenue contributor in 2025, claiming 39.10% of global spend, reflecting well-funded healthcare systems, reimbursed rapid tests, and robust AMR surveillance grants. Laboratories across the United States leverage the CDC’s Antimicrobial Resistance Laboratory Network to adopt connected identification platforms that feed real-time data into national dashboards. Canada follows similar trajectories but faces greater technician shortages, delaying instrument rollouts in smaller provinces.
APAC Microbial Identification Market
Asia-Pacific, forecast to rise at 11.08% CAGR, is propelled by public hospital expansion in China and India, harmonized quality standards under ASEAN initiatives, and a vibrant local biomanufacturing base. The CHINET program’s multicenter datasets illustrate the region’s data maturity and the resulting push for faster organism profiling to guide antibiotic formularies. Governments are also subsidizing instrument purchases for provincial disease-control centers, widening rural access.
Europe Microbial Identification Market
Europe maintains moderate growth as stringent In-Vitro Diagnostic Regulation deadlines drive labs to validate platforms earlier than scheduled, ensuring steady demand for compliant kits. The United Kingdom’s ESPAUR report cites a 3.5% rise in AMR burden since 2019, keeping rapid identification on policy agendas. Brexit customs changes create occasional supply chain delays, yet continental procurement frameworks largely shield end users from shortages.
MEA and LATAM Microbial Identification Market
The Middle East and Africa region is at an earlier adoption stage but benefits from Gulf state investment in tertiary care facilities and from donor-funded water-pathogen projects. Latin America sees rising food-safety testing volumes as Brazil and Mexico align export requirements with major trade partners, boosting uptake among agro-industry labs.

Regulatory Landscape
In the United States, FDA oversight for microbial identification is being clarified through device classification and special controls that shape clinical validation, labeling, and post-market compliance. For MALDI-TOF microorganism identification and differentiation systems, 21 CFR 866.3378 codifies Class II requirements, including labeling access expectations, while the May 2024 FDA action to phase out broad enforcement discretion for laboratory-developed tests (LDTs) increases pressure to align laboratory assays with standard IVD controls over a multi-year transition.
In 2026, the Federal Register reflected additional Class II special controls for adjacent nucleic-acid based workflows, including devices for preserving and stabilizing microbial nucleic acids in clinical samples (effective May 6, 2026) and devices identifying microorganism nucleic acids in orthopedic infections (effective May 12, 2026). Outside the US, standards and regional guidance also affect adoption: CLSI M52 provides verification protocols for FDA-cleared microbial ID and AST systems, and EMA quality documentation expectations for biological investigational medicinal products reinforce routine microbiological specifications and testing within regulated bioprocessing environments.
Value Chain Analysis
The value chain runs from instrument and assay development (MALDI-TOF MS platforms, PCR panels, and associated software) to consumables manufacturing (media, reagents, targets, calibrants, and extraction kits), then to database and analytics curation (spectral libraries and LIMS connectivity). Regulatory and standards checkpoints influence upstream design and validation choices, including US Class II special controls under 21 CFR 866.3378 for clinical mass spectrometry microorganism identification systems, and 21 CFR 866.3985 for certain respiratory specimen identification devices that require documented design verification and clinical performance evidence.
Downstream, distribution typically moves through direct sales and channel partners into hospitals and clinical laboratories, pharmaceutical manufacturing QC, food and beverage labs, and environmental and industrial testing sites, followed by installation, verification, service contracts, and user training. Method validation and interoperability standards serve as operational infrastructure across end markets, including ISO 16140-7:2024 (published November 2024) for validating microbial identification methods in the food chain when no reference method exists. Workflow integration is a practical node in the chain, with labs combining MALDI-TOF identification and molecular techniques such as real-time PCR to compress turnaround time and add resistance-marker resolution, which in turn increases pull-through of consumables and software services alongside instruments.
Competitive Landscape
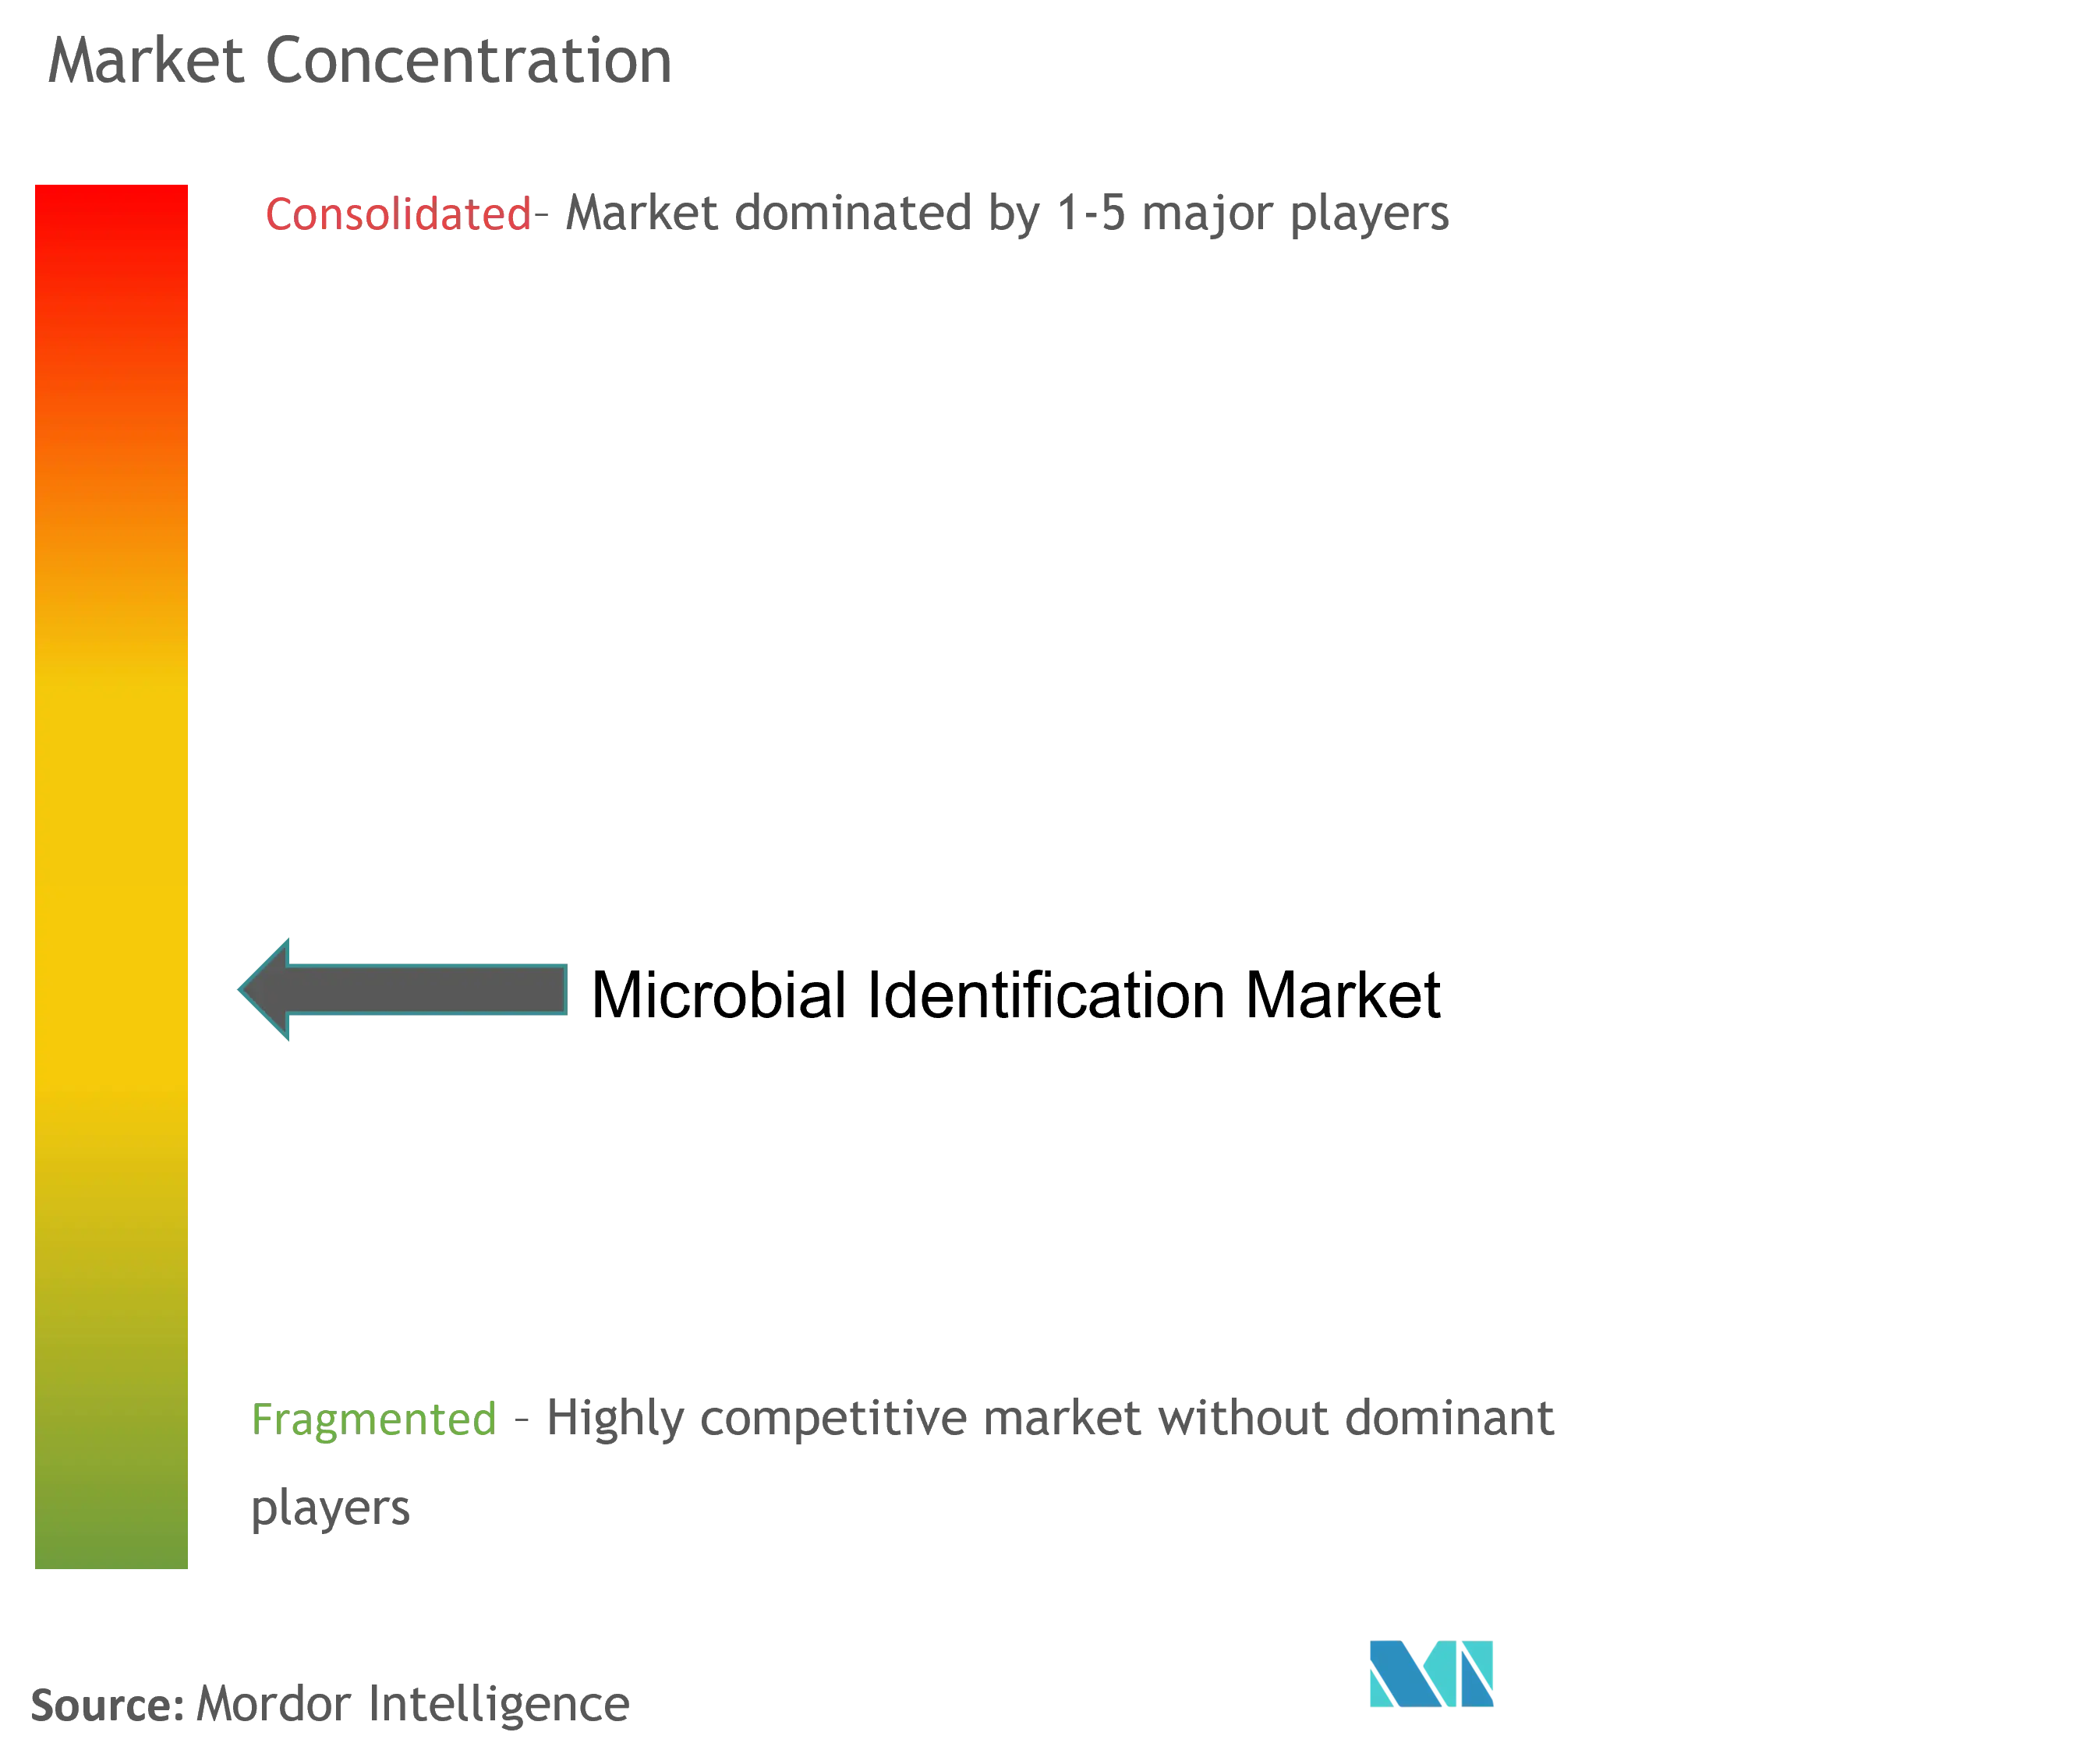
The microbial identification market shows moderate concentration. bioMérieux, Bruker, BD, QIAGEN, Thermo Fisher Scientific, and Danaher collectively control a sizeable portion of installed equipment and reagents. bioMérieux set aside EUR 3-4 billion for acquisitions, recently targeting genomics and software providers to deepen its data capabilities. Bruker spent USD 942 million on ELITechGroup in February 2024 to enter molecular panels and followed with a stake in RECIPE for therapeutic drug monitoring.
BD plans to spin off its USD 3.4 billion Biosciences and Diagnostic Solutions unit to sharpen focus on higher-growth segments, signaling portfolio realignment under shareholder pressure. QIAGEN added 100 validated digital PCR assays in 2024 and secured FDA clearance for a new gastrointestinal panel in March 2025, reinforcing its syndromic testing position.
Technology differentiation centers on reference-library breadth, throughput, and AI integration. Vendors are pairing instruments with cloud analytics, subscription software, and linked resistance databases to embed themselves deeper into customer workflows. Partnerships with pharmaceutical manufacturers to co-develop companion diagnostics create new revenue streams while enhancing clinical credibility.
Microbial Identification Industry Leaders
Becton Dickinson and Company
BioMérieux SA
Shimadzu Corporation
Thermo Fisher Scientific
Danaher (Beckman Coulter Inc.)
- *Disclaimer: Major Players sorted in no particular order
Microbial Identification Market Companies Covered in this Report
- bioMérieux
- Bruker
- Beckton Dickinson
- Thermo Fisher Scientific
- Danaher
- Shimadzu
- Charles River
- Biolog
- QIAGEN
- Merck KGaA (MilliporeSigma)
- Liofilchem Srl
- bioNote Inc.
- MIDI Labs
- Eppendorf
- Hologic
- Roche
- Siemens Healthineers
- Revvity (PerkinElmer)
- Abbott Laboratories
- Agilent Technologies

Market Opportunities and Future Outlook
A key whitespace sits where larger, curated organism libraries meet automation that mitigates workforce constraints in routine microbiology. Competitive differentiation is shifting from hardware throughput alone toward database scale and workflow software, supported by vendor actions such as Shimadzu's May 2025 launch of MicrobialTrack with a database of approximately 85,000 prokaryotic species, and Bruker's April 2026 expansion of MALDI Biotyper reference libraries to over 5,300 species along with standardized sample-transfer workflows (MBT Easy T Kit, RUO/IVDR). These steps reinforce opportunities for subscription analytics, library update services, and tighter connectivity to LIMS and surveillance reporting, especially where labs must document verification and performance under CLSI and FDA special controls.
Food safety and environmental monitoring still see lower penetration than clinical diagnostics, and adoption is being pulled by stricter validation and traceability requirements. That creates room for rapid PCR and hybrid workflows across distributed sites. A tangible signal is bioMérieux's June 2026 launch of GENE-UP TYPER SLM, a real-time PCR solution that discriminates Salmonella enterica subspecies enterica in food environments, linking microbial identification with root-cause analysis and corrective action programs. In clinical settings, clearer US regulatory framing for mass spectrometry IVDs (21 CFR 866.3378) and the ongoing transition around LDT oversight increase demand for standardized, manufacturer-supported assays and verification protocols, while culture-free and microfluidics-linked identification research (for example, rapid direct-from-sample approaches reported in 2025-2026 academic studies) expands the innovation pipeline for faster time-to-result workflows that reduce dependence on culture.
Recent Industry Developments in Microbial Identification Market
- April 2026: Bruker expanded MALDI Biotyper and IR Biotyper microbiology workflows and reported reference library growth to over 5,300 species, alongside tools aimed at standardizing sample transfer to MALDI targets. The update strengthens vendor differentiation around library depth and repeatable pre-analytics, which are key bottlenecks in routine microbial identification and outbreak management workflows.
- August 2025: Becton, Dickinson and Company received FDA 510(k) clearance for the BD Phoenix Automated Microbiology System featuring the GN Eravacycline panel. The clearance supports faster updates to deployed automated microbiology platforms, helping labs keep antimicrobial testing menus aligned with evolving therapy protocols and stewardship requirements.
- February 2024: Bruker completed its acquisition of ELITechGroup for approximately USD 942 million, expanding into molecular panels that complement mass spectrometry-based workflows. The deal broadened Bruker's portfolio footprint across microbial testing workflows and increased cross-selling potential of instruments, assays, and software into hospital and laboratory networks.


Microbial Identification Market Report Scope and Research Methodology
Market Definition and Coverage
This market covers the revenue generated from tools and services used by laboratories to identify microorganisms to a usable level for decisions, typically genus or species, across bacteria, fungi, viruses, and similar groups. It includes routine clinical and quality-control workflows.
Scope exclusions: Automated antibiotic susceptibility testing platforms and standalone microbial genomics services are excluded from this sizing scope.
Segments Covered in This Report
- By Product & Service
- Instruments
- Consumables
- Software & Services
- By Technology
- MALDI-TOF MS
- PCR & Real-time PCR
- Sequencing (NGS, Sanger)
- Others (Biochemical, Microscopy, etc.)
- By End-User
- Hospitals & Clinical Laboratories
- Pharmaceutical & Biotechnology Companies
- Food & Beverage Testing Labs
- Environmental & Industrial Labs
- By Application
- Clinical Diagnostics
- Pharmaceutical Manufacturing QC
- Food Safety & Quality
- Environmental Monitoring
- By Geography
- North America
- United States
- Canada
- Mexico
- Europe
- Germany
- United Kingdom
- France
- Italy
- Spain
- Rest of Europe
- Asia-Pacific
- China
- India
- Japan
- South Korea
- Australia
- Rest of Asia-Pacific
- South America
- Brazil
- Argentina
- Rest of South America
- Middle East and Africa
- GCC
- South Africa
- Rest of Middle East and Africa
- North America
Data Sources, Market Sizing, and Validation
Desk Research
Desk work starts by aligning the scope to what laboratories actually buy and use, then mapping where that spend shows up in public data. We used sources such as the US CDC for infectious disease context, the WHO for surveillance signals, and the FDA for testing and diagnostics updates that affect lab workflows.
To ground end-user activity, we also reviewed sources such as OECD health statistics, Eurostat health data series, and trade and customs releases that indicate instrument and reagent movement across borders. Company annual reports, investor presentations, peer-reviewed microbiology journals, and association websites were then used to frame adoption trends for MALDI-TOF, PCR, and sequencing based identification. For company financials and patent activity, we selectively relied on paid database subscriptions, and we did not treat them as the only input.
These desk research sources are illustrative and not exhaustive, and we checked additional public documents for data collection, validation, and clarification.
Primary Interviews and Surveys
Primary work was used to pressure test the desk assumptions on what is being purchased, how often it is used, and which methods are gaining share in day-to-day lab routines. We spoke with a mix of instrument and consumables stakeholders, service providers, and lab-side users across hospitals, reference labs, pharma and biotech QC, food testing, and environmental labs.
Responses were cross-checked across major regions so differences in regional lab practice were not averaged away. This helped clarify how identification workflows are segmented in spend when contracts are bundled.
Distribution of primary research fieldwork respondents
| Company type | Respondent position | Region |
|---|---|---|
| Top tier: 36% | CXOs: 22% | APAC: 44% |
| Mid tier: 42% | Functional/Unit leaders: 37% | EMEA: 37% |
| Smaller Players: 22% | Managers: 41% | Americas: 19% |
Market-Sizing & Forecasting
Sizing begins with a top-down build where lab testing demand is reconstructed from healthcare activity and QC intensity, then allocated to identification workflows by method and end user. In practice, we start from indicators such as infectious disease testing load, hospital and reference lab throughput, pharma and biotech batch release testing needs, and food safety compliance activity. The implied identification spend pool is reached at the end of this allocation step.
That total is then corroborated with selective bottom-up approximations, including sampled ASP times unit volumes for key instrument placements, recurring consumable pull through per installed base, and channel checks on service revenue shares. Where coverage gaps exist in the bottom-up checks, such as smaller labs or bundled contracts, we fill assumptions using ranges validated in interviews, then narrow them using observable signals like import trends for mass spectrometry systems and PCR reagent volumes.
For forecasting, scenario analysis is used because adoption and replacement cycles can shift when funding, regulation, or outbreak intensity changes. The outlook is driven by variables such as installed base refresh timing, penetration of MALDI-TOF in clinical labs, growth in molecular identification in pharma QC, average reagent consumption per test, and pricing movement by product type. Each variable is reviewed with experts before the final curve is locked.
Data Validation & Update Cycle
Validation is done through cross checks across independent signals, followed by variance reviews to understand what drives any outliers. We compare model outputs with related metrics such as lab spending direction, instrument shipment momentum, and regional testing intensity, then trace any large mismatch back to underlying assumptions.
A multi-step internal review is applied before sign off, and follow up calls are triggered when interview feedback contradicts desk evidence or when a new regulatory or reimbursement change could shift adoption. Reports are refreshed annually, with interim updates when material events occur, and before delivery an analyst performs a fresh pass so clients receive the latest updated view.
Mordor Intelligence's Microbial Identification Market Size Versus Other Published Estimates
Published market sizes for microbial identification can vary even when the topic name looks the same, because the included product basket and the starting year often differ. Differences in how instruments, consumables pull through, and software and service revenue are treated also create noticeable spreads.
By tracking installed base driven consumable pull through and refreshing scope boundaries annually, Mordor Intelligence keeps the value tied to identification specific workflows. This reduces drift from adjacent testing areas that are sometimes counted together. A second driver is time alignment: some sources anchor on 2023 or 2024 values and then project forward with faster adoption assumptions for sequencing or molecular methods, while others apply a more conservative replacement cycle for capital equipment. Currency timing and regional weighting can further shift totals when faster growth regions are emphasized.
Benchmark comparison
| Source | Market Size | Gaps in Research Methodology |
|---|---|---|
| Mordor Intelligence | USD 4.49 B (2026) | |
| Global Consultancy A | USD 4.19 B (2024) | Uses an earlier base year and applies a faster growth curve into 2030, which can inflate implied mid-period values when adoption of molecular methods is assumed to accelerate uniformly across regions. |
| Industry Publisher B | USD 4.10 B (2024) | Often groups microbial identification with nearby microbiology testing spend, and service revenue treatment can be broader, which shifts the boundary away from identification-only laboratory workflows. |
The comparison mainly shows how base year choice and scope boundaries move the number up or down. When the model is tied to clear workflow linked drivers like instrument placement, consumable pull through, and end user testing intensity, the final value stays traceable and easier to reconcile during planning discussions.


Key Questions Answered in the Report
What is the current size of the microbial identification market?
The market reached USD 4.49 billion in 2026 and is projected to climb to USD 6.94 billion by 2031, reflecting a 9.07% CAGR.
Which technology leads the microbial identification market?
MALDI-TOF mass spectrometry leads with 56.90% revenue share in 2025, valued for rapid turnaround and growing species libraries.
Why is Asia-Pacific the fastest-growing region?
Healthcare infrastructure investment, regulatory harmonization, and expanding biomanufacturing in China, India, and Southeast Asia drive an 11.08% CAGR outlook.
How are antimicrobial-resistance programs influencing demand?
Global surveillance networks rely on rapid identification for stewardship decisions, raising adoption of molecular and MALDI-TOF platforms that shorten time to effective therapy.
What challenges limit market expansion?
High capital and maintenance costs and a shortage of skilled mass-spectrometry technicians restrict adoption, especially in emerging markets.
Page last updated on:





