Market Overview
| Study Period | 2020 - 2031 |
|---|---|
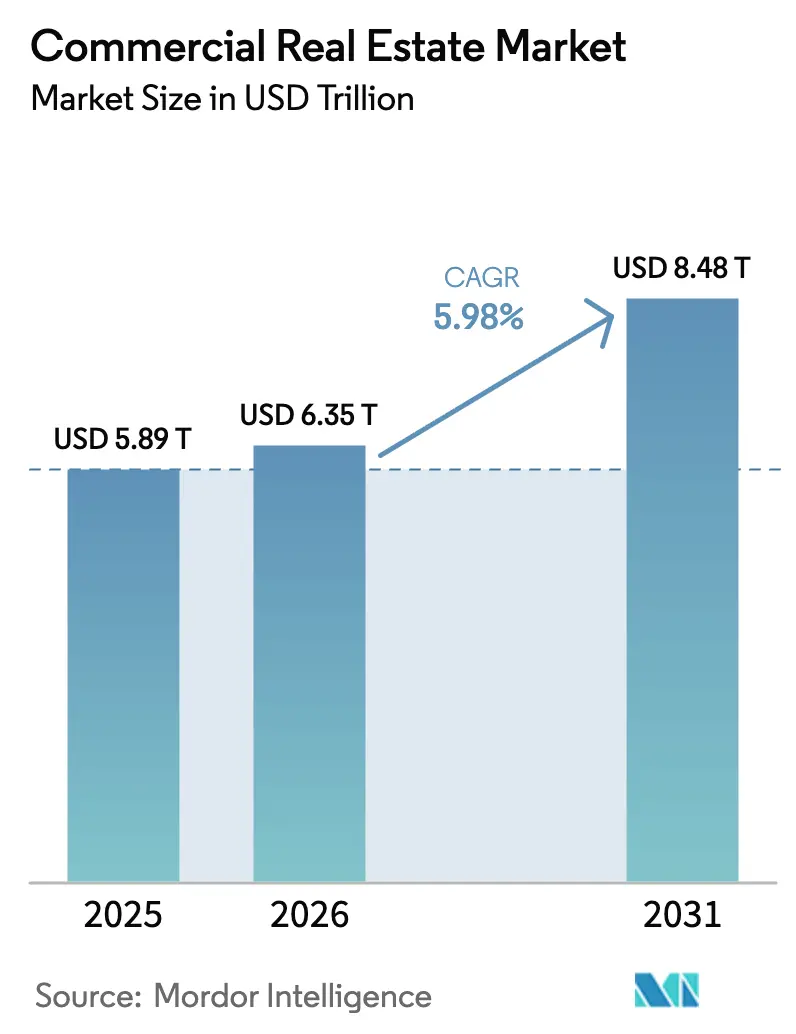
| Market Size (2026) | USD 6.35 Trillion |
| Market Size (2031) | USD 8.48 Trillion |
| Growth Rate (2026 - 2031) | 5.98% CAGR |
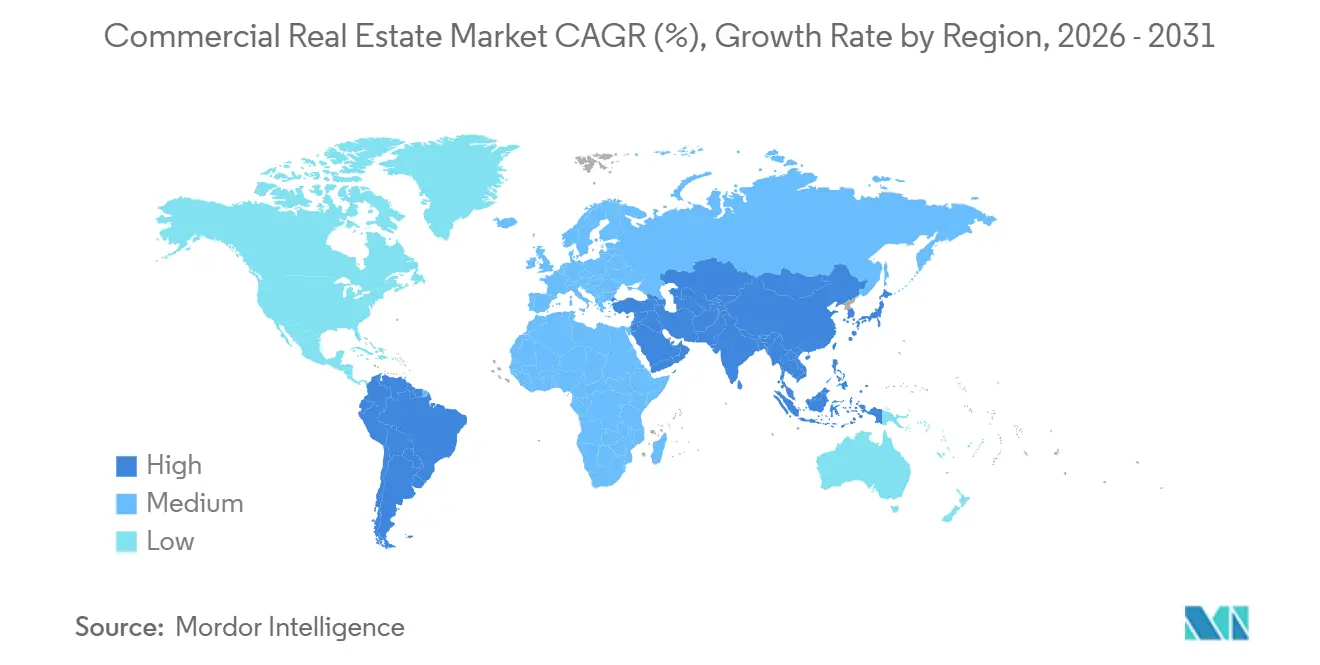
| Fastest Growing Market | South America |
| Largest Market | Asia-Pacific |
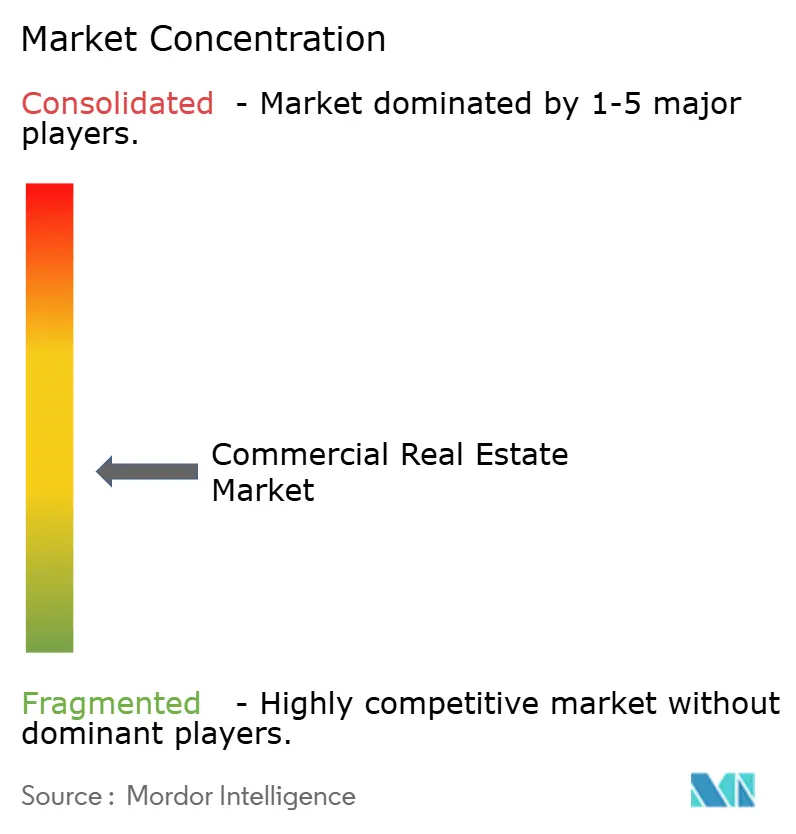
| Market Concentration | Medium |
Major Players *Disclaimer: Major Players sorted in no particular order Image © Mordor Intelligence. Reuse requires attribution under CC BY 4.0. | |
Commercial Real Estate Market Analysis by Mordor Intelligence
The commercial real estate market size stands at USD 6,345.2 billion in 2026 and is projected to reach USD 8,483.3 billion by 2031, reflecting a 5.98% CAGR. Capital reallocation by sovereign wealth funds and pension plans toward income-producing property supports steady expansion in the commercial real estate market, even as rate pressures ease. Digitalization continues to reshape demand patterns, with data centers, logistics, and last-mile facilities absorbing new capital and driving build pipelines in select power-rich and transit-rich locations in the commercial real estate market. Hybrid work has stabilized at midweek peaks and lower weekly averages, which keeps national office vacancy near multi-decade highs, and it reinforces a flight to quality in the commercial real estate market. Construction and insurance costs remain elevated relative to pre-2024 trends, which compresses yields for new builds and deep retrofits and further segments winners and underperformers in the commercial real estate market.[1]https://www.cbre.ca/
Key Report Takeaways
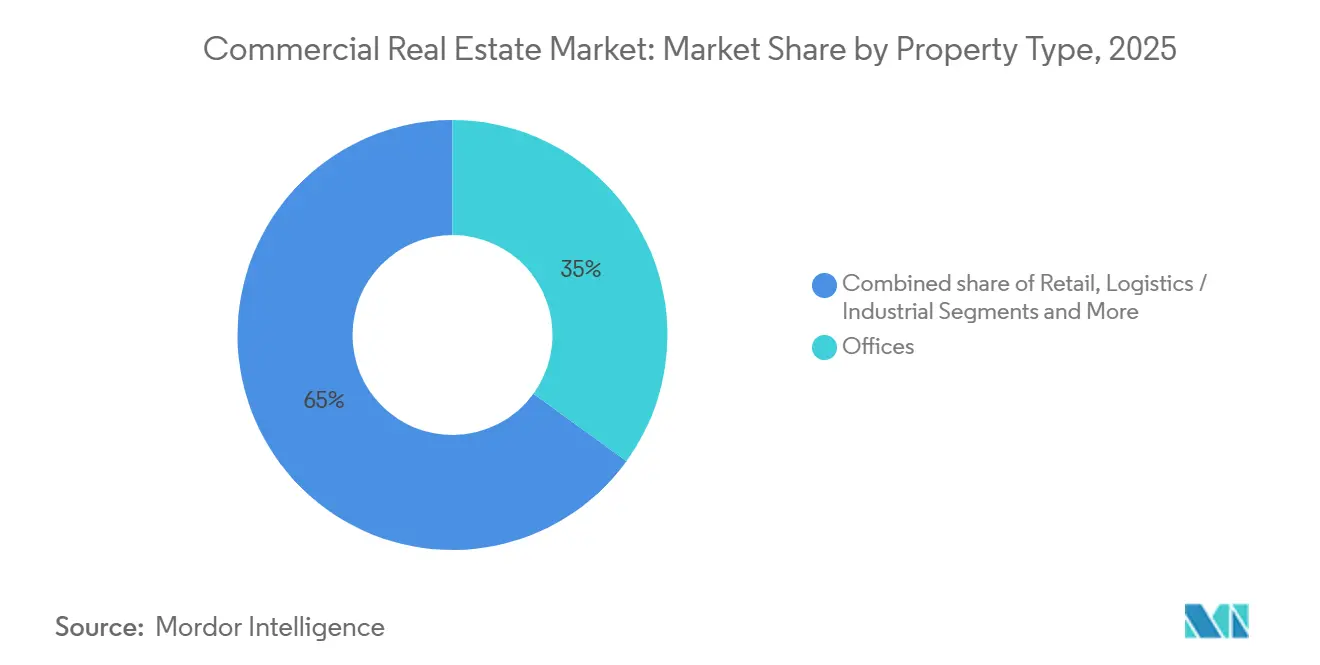
- By property type, offices held 35% of the commercial real estate market share in 2025, while logistics and industrial are forecast to grow at a 6.32% CAGR through 2031.
- By business model, sales models accounted for 69% of transactional value in 2025, while rental streams are forecast to record a 6.49% CAGR through 2031.
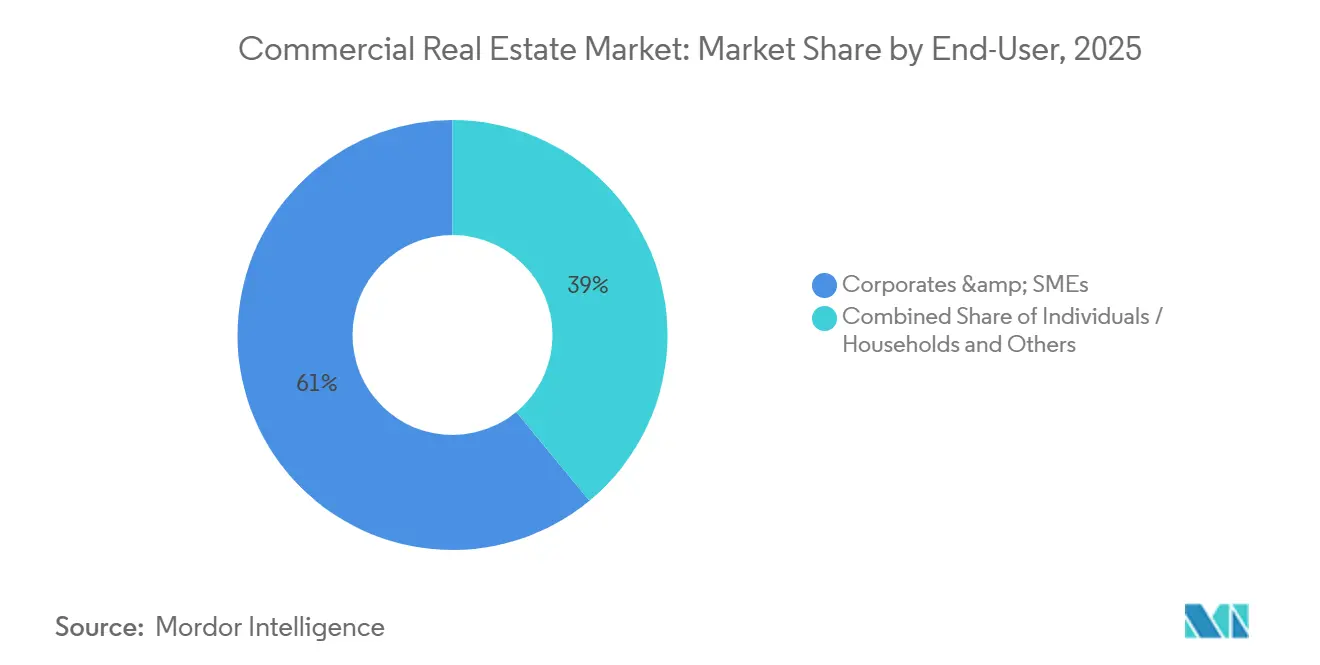
- By end-user, corporates and SMEs accounted for a 61% share of the commercial real estate market size in 2025 and are advancing at a 6.28% CAGR through 2031.
- By geography, Asia-Pacific held 33% of the commercial real estate market share in 2025, while South America records the fastest projected growth at 6.46% through 2031.
Note: Market size and forecast figures in this report are generated using Mordor Intelligence’s proprietary estimation framework, updated with the latest available data and insights as of January 2026.
Global Commercial Real Estate Market Trends and Insights
Drivers Impact Analysis*
| Drivers | (~) % Impact on CAGR Forecast | Geographic Relevance | Impact Timeline |
|---|---|---|---|
| Sovereign and pension-fund pivot toward income-producing CRE | +1.5% | Global, led by Gulf states, Nordics, and North American institutions | Long term (≥ 4 years) |
| Logistics-led demand spike from omnichannel retail | +1.2% | Global, strongest in North America and core APAC, with spill-over to South America | Medium term (2-4 years) |
| Rapid hyperscale and edge data-centre campus rollouts | +1.1% | Virginia, Ohio, Texas, Dublin, Singapore, with emerging secondary hubs | Medium term (2-4 years) |
| Flight-to-quality upgrading of prime CBD offices | +0.9% | North America and EU metro cores, APAC gateways such as Tokyo, Singapore, and Sydney | Short term (≤ 2 years) |
| Transit-oriented rezoning lifts mixed-use land values | +0.7% | National scale with early gains in Austin, Seattle, San Antonio, St. Louis, and Dallas | Long term (≥ 4 years) |
| Generative-AI-driven site-selection boosting secondary markets | +0.4% | U.S. Midwest and South, APAC emerging metros such as India and Vietnam, and select Latin America corridors | Medium term (2-4 years) |
| Source: Mordor Intelligence | |||
Sovereign & Pension-Fund Pivot Toward Income-Producing CRE
Sovereign investors and pension plans increased allocations to income-producing property, which bolsters liquidity in core segments and strengthens bid depth for logistics, multifamily, and digital infrastructure. State investors and pensions grew global deployment in 2025, with the U.S. absorbing a large share focused on digital infrastructure and AI-linked assets. Gulf-based sovereign investors contributed a significant portion of state capital, while North American and Nordic pensions continued to favor long-lease assets with high-credit tenancy. Cross-border capital into the U.S. rose in early 2025 with Canadian, Norwegian, and U.K. investors active in industrial, multistory warehouses, and sale-leaseback deals. Policy direction on defined-contribution plans in the U.S. may unlock new flows to private assets, which supports long-term funding for rental-heavy strategies. Energy- and commodity-backed sovereign funds are positioned to sustain allocations in 2026, while hydrocarbon-dependent funds manage fiscal trade-offs in capital deployment.[2]https://globalswf.com/
Logistics-Led Demand Spike From Omnichannel Retail
Retailers’ shift to omnichannel fulfillment elevates the value of modern logistics assets with high-clear heights and efficient throughput. Retailers need about three times as much warehouse space per dollar of online sales as for store-based channels, which increases demand for modern distribution nodes in key corridors. Store networks are doubling as hubs for click-and-collect and ship-from-store activity as executives push convenience and localized inventory, which reinforces last-mile demand in the commercial real estate market. Micro-fulfillment footprints continue to cluster in denser submarkets to improve delivery times and to lower final-leg costs for retailers that run integrated inventory across channels. Developers prioritize sites near customers and multimodal transit, while bonded warehouses and cross-border facilities secure premium leases due to tariff and supply-chain risk management. Together, these shifts consolidate growth in e-commerce-driven logistics and elevate requirements for power, HVAC, and automation-ready designs in the commercial real estate market.[3]https://www.jll.com/en-in/
Rapid Hyperscale & Edge Data-Center Campus Roll-Outs
AI training and inference workloads have turned data centers into a key growth pillar of the commercial real estate market, with large operators planning record capital expenditures and multi-gigawatt campuses. Hyperscale pipelines now span hundreds of future sites and imply a rapid doubling of capacity over the next several years. U.S. hyperscale demand could more than triple by 2030, with leading states competing on land, grid access, and tax incentives to secure mega-campuses. Power availability and interconnection timelines shape site selection, which pushes developers toward behind-the-meter generation and private-wire renewables when grid constraints persist. Meta’s Louisiana campus and other announced superclusters illustrate the scale required for AI training, while secondary markets like Kentucky and Ohio are gaining traction through expandable power deals. Policymakers are refining tax and permitting frameworks to accelerate deployment, though community and environmental challenges have stalled large projects in several jurisdictions.
Flight-To-Quality Upgrading Of Prime CBD Offices
Occupier demand concentrates in high-amenity, energy-efficient towers with strong transit access, which record peak-day usage near pre-2020 levels, while commodity stock trails. In mid-2025, top-tier assets in major U.S. markets produced peak-day utilization of around 90% of pre-pandemic levels, while aggregate office utilization stayed lower across the week. Vacancies are concentrated in a small subset of lower-quality buildings, and conversion programs have begun to reduce obsolete supply, which narrows the denominator for vacancy and steadies rents in select CBDs. New office deliveries hit multi-year lows in early 2025, and the construction pipeline remains well below 2019 peaks, which constrains immediate new supply. ESG-focused regulations like New York City’s Local Law 97 create clear economic signals that raise costs for older, non-compliant stock and reward efficient, low-carbon buildings. This split shapes leasing outcomes in the commercial real estate market, where tenants trade space for quality while paying premiums for modern features.
Restraints Impact Analysis*
| Restraints | (~) % Impact on CAGR Forecast | Geographic Relevance | Impact Timeline |
|---|---|---|---|
| Persistent hybrid work dampening global office absorption | -1.8% | North America and Western Europe CBDs, with select APAC cities | Short term (≤ 2 years) |
| Construction material and financing-cost inflation squeezing yields | -1.3% | Developed markets worldwide, most acute in the U.S., Canada, EU, and Australia | Short term (≤ 2 years) |
| ESG-driven obsolescence risk for legacy assets | -0.9% | Tier-1 cities in Europe and North America, with select APAC metros | Long term (≥ 4 years) |
| Heightened climate-insurance premia in coastal metros | -0.8% | Coastal U.S., Gulf states, parts of Australia and Southeast Asia, and the Caribbean | Medium term (2-4 years) |
| Source: Mordor Intelligence | |||
Persistent Hybrid-Work Dampening Global Office Absorption
Hybrid schedules have settled into stable patterns where most mandates require three to four days in the office, which sustains a gap to full-week utilization. As of early 2026, only a small share of large-company staff remain fully remote, which is down sharply from 2022, yet national vacancy in the U.S. stayed high through mid-2025. Rolling absorption remained below historical norms during 2024 and 2025, consistent with rightsizing and footprint optimization. Coastal metros recorded sizable negative absorption in 2024, while interior markets showed more resilience. Space per worker continued to compress to near 122 square feet by 2025 as tenants reconfigured for more collaboration areas and fewer assigned seats. Canadian sublease availability improved into late 2024, but downtown vacancy remained elevated, which signals a gradual rather than sudden recovery path.[4]https://www.nar.realtor/
Construction-Material & Financing-Cost Inflation Squeezing Yields
Elevated material and labor costs, together with funding rates above long-term norms, raised project hurdles across asset classes. Data center construction costs averaged near USD 10.7 million per megawatt in 2025 and are set to rise further in 2026, which adds pressure to development pro formas and delivery timelines. Canadian non-residential building costs climbed in 2025 with labor and tariff factors, which added to localized cost pressures. Supply-chain and sourcing shifts keep input prices sticky, and a sizable share of U.S. construction inputs are imported, which adds currency and tariff risk to budgets. Lending yields in the U.S. often sat above cap rates in 2025, which delayed sales until income growth could offset debt costs. Gradual policy rate cuts began to ease conditions in late 2025, yet financing remains tighter than pre-2024, and green directives in Europe raise capex needs for older stock.
*Our forecasts treat driver/restraint impacts as directional, not additive. The impact forecasts reflect baseline growth, mix effects, and variable interactions.
Segment Analysis
By Property Type: Logistics Overtakes Offices As Growth Engine
Offices commanded a 35% share in 2025, which reflects legacy leasing commitments and the slow adjustment cycle for enterprise footprints. The logistics and industrial portion of the commercial real estate market size is projected to expand at a 6.32% CAGR through 2031 as omnichannel retailers reconfigure inventory placement for speed. Retailers require significantly more warehouse capacity per online sales dollar than traditional channels, which supports high-clear, automation-ready buildings in urban and near-port locations. Micro-fulfillment facilities are gaining share inside and near cities as retailers emphasize same-day service, which boosts demand for smaller footprints with robust HVAC and power. Last-mile sites near multimodal nodes and bonded warehouses close to borders continue to command rent premiums, which widens the performance gap versus older stock.
Retail centers stabilized at low vacancy as experiential and convenience formats regained traffic, and many storefronts now support online order fulfillment to diversify sales. Large logistics platforms deployed capital to expand regional coverage, as seen in sizeable portfolio purchases across Sun Belt corridors to meet e-commerce demand in the commercial real estate market. Policy and regulation are reinforcing portfolio bifurcation because energy-performance mandates and city-level emissions rules make compliant assets more attractive for core buyers. Deep retrofits are now a central tool for office repositioning, and capital plans are shifting toward targeted upgrades where long-term tenancy is feasible. As developers navigate cost inflation and permitting constraints, modern logistics continues to outgrow other property types on the back of consistent tenant demand in the commercial real estate market.


By Business Model: Rental Ascends On Operational Flexibility
Sales models accounted for 69% of transactional value in 2025, which reflects portfolio recycling and opportunistic trades in challenged office segments. Distressed asset sales featured steep discounts in select CBDs, and cross-border buyers targeted logistics portfolios and sale-leasebacks with credit tenants. As repricing works through balance sheets, large allocators continue to buy debt or acquire control via loan processes, which supports liquidity but emphasizes underwriting discipline. Rental income streams expanded at 6.49% through the forecast as occupiers favored flexibility and avoided balance-sheet encumbrance on headquarters space in the commercial real estate market. In data centers, long-duration build-to-suit leases are common for hyperscalers, which transfers technological obsolescence risk to landlords in exchange for stable escalators.
The commercial real estate industry adjusts to this preference shift with product-level innovation and financing alignment that favors stabilized rental portfolios. Policy changes that expand access for defined-contribution plans to private assets could channel new capital to rental-focused strategies. Multifamily liquidity from government-sponsored channels and green-financing overlays remains supportive, which sustains investment-grade demand for efficient buildings. Benchmarks and certifications, including ISO 14001 and GRESB reporting, are now standard for institutional platforms, which helps align allocations with ESG mandates. Together, these elements support rental-model growth across logistics, multifamily, and digital infrastructure as occupiers prize flexibility in the commercial real estate market.
By End-User: Corporates Consolidate Into Amenity-Rich Buildings
Corporates and SMEs represented 61% of end-user demand in 2025 and are forecast to grow at 6.28% through 2031, which reflects a shift from quantity to quality in portfolio strategies. Average space per worker tightened by 2025 as enterprise plans emphasized collaboration zones, wellness, and digital infrastructure over dedicated desk ratios. Peak-day occupancy in top-tier CBD assets often exceeds broader averages, which shows the value of transit-rich, amenity-loaded towers for talent attraction. Enterprise real estate leaders prioritizing cost do not abandon quality; instead, they aim for smaller footprints in better locations that meet experience and compliance needs in the commercial real estate market. Tenants show willingness to pay rent premiums for trophy attributes when hybrid policies depend on compelling workplaces to boost attendance.
Individuals and households contribute to steady demand in multifamily and neighborhood retail formats, which supports income visibility for rental-focused portfolios. Grocery-anchored centers and convenience-driven layouts perform well, and undersupplied subtypes like student housing and senior living attract capital as demographics shift. Associations and nonprofits often prefer spec suites that reduce move-in times and upfront fit-out costs, which aligns with ongoing flexibility trends. Corporate sustainability reporting and energy rules influence leasing, which raises the importance of LEED, BREEAM, or DGNB credentials in location choices. These preferences continue to favor newer, certified assets and landlords that deliver measurable reductions in emissions in the commercial real estate market.

Geography Analysis
Asia-Pacific held a 33% share in 2025, supported by strong industrial output, tight prime-office corridors in Japan, and robust absorption in India’s technology and shared-services hubs. Wage gains and policy direction in Japan lifted Tokyo prime rents in late 2025, while Australia’s urban markets benefited from internal migration and pre-Olympics infrastructure programs. Singapore and Hong Kong SAR faced land and power constraints for data centers, yet institutional interest in rental housing formats remained steady in undersupplied submarkets. India’s global capability centers and BFSI tenants supported occupancy and rent growth in major markets during 2025, which underscores diversified demand drivers in the commercial real estate market. This mix keeps Asia-Pacific as the share leader while growth normalizes from the immediate post-pandemic period.
South America records the fastest projected regional growth at 6.46% through 2031 as foreign direct investment shifts toward industrial and logistics expansion. Major industrial markets in Mexico and Brazil anchored pipelines in 2025 as investors targeted distribution corridors with power and labor availability. Recovery and stabilization in several capital city office markets signaled improving momentum despite elevated vacancy in select metros. Macroeconomic stabilization, moderating inflation in several countries, and continued FDI support a stronger platform for development and leasing. These fundamentals position the region for durable gains in the commercial real estate market.
North America and Europe expand at steadier rates as capital focuses on digital infrastructure, logistics, and prime office assets that meet high ESG standards. State investors deployed more capital into U.S. digital infrastructure and AI-linked assets in 2025, which sharpened the focus on hyperscale locations with expandable power. Canada’s investment flows rose in key metros in 2025, supported by migration and provincial growth, which kept leasing active in favored segments. Surveyed European investors expected improved leasing and financing conditions in 2026, which points to a firmer base after a slow 2024 for transactions in the commercial real estate market. Refinancing exposure remains largest in Germany and France, and potential fiscal programs could catalyze new activity if policy clarity improves. London retained top-tier city status for depth and liquidity heading into 2026, while Madrid moved up on economic and quality-of-life metrics.

Competitive Landscape
The commercial real estate market is moderately fragmented, with diversified players active across advisory, development, ownership, and operations. Global advisors compete on brokerage and property-management mandates and differentiate with analytics, lease abstraction, and tenant-experience platforms. In logistics, scaled owners deploy automation and data-led warehouse systems to raise throughput for tenants and to sustain last-mile performance advantages. Leading managers redirected capital toward data infrastructure, with high-profile commitments to AI-linked campuses and regional initiatives aimed at securing renewable power.
Acquirers look to distressed office and credit situations for basis resets, while disposition activity continues in legacy retail, where strategies shift toward mixed-use and urban assets. Office-to-residential conversion pipelines expanded into 2025 as obsolete buildings faced stranding risk without deep retrofits, which diversified revenue streams for urban portfolios. In retail, landlords emphasized experience and omnichannel readiness, working with premium brands on digital-mirror fitting rooms and RFID to support inventory precision. These moves align with tenant demand for quality and amenities that reinforce usage in hybrid work environments within the commercial real estate market.
Technology adoption is rising across underwriting, asset management, and property operations, which accelerates decision cycles and lowers opex. Predictive-maintenance deployments across large managed portfolios showed energy gains and downtime reductions, which support net operating income and ESG targets. Institutional platforms rely on ISO and GRESB standards to validate processes and disclosures, which improves data integrity and comparability for allocators. Strategic M&A continued in 2025 as investors sought data capabilities to strengthen private-markets analytics and benchmarking tools across alternative assets. These dynamics raise the competitive bar in the commercial real estate market, where execution speed and data competence shape advantage.
Commercial Real Estate Industry Leaders
CBRE
JLL (Jones Lang LaSalle)
Cushman & Wakefield
Colliers
Savills
- *Disclaimer: Major Players sorted in no particular order

Recent Industry Developments
- December 2025: Brookfield Asset Management closed a USD 8.9 billion Swedish AI infrastructure initiative that partners with national energy providers to secure renewable power for hyperscale data centers serving generative AI workloads.
- November 2025: Meta Platforms received approval for its Louisiana “Hyperion” data center campus, a development scaled for up to 5 GW of electricity and more than USD 10 billion of investment.
- September 2025: Vantage Data Centers announced a Texas campus with 10 facilities on 1,200 acres, 1.4 GW of capacity, and investment exceeding USD 25 billion, including liquid-cooling infrastructure for dense AI racks.
- August 2025: QTS Data Centers and Blackstone Real Estate unveiled plans for a USD 10 billion hyperscale campus in Northumberland, UK, designed for sovereign-cloud and AI training workloads with access to renewable energy.


Research Methodology Framework and Report Scope
Market Definitions and Key Coverage
Our study defines the global commercial real estate (CRE) market as the annual gross value of income-producing built assets, office, retail, logistics and industrial, hospitality, mixed-use, and data-center facilities, traded, leased, or held for rental income and capital appreciation during the calendar year. Fit-out spending on tenant improvements and site-level development costs are included when they create saleable or leasable space.
Scope Exclusions: Residential dwellings under individual ownership, raw land speculation, infrastructure concessions, and pure facilities-management contracts are excluded to avoid double counting.
Segmentation Overview
- By Property Type
- Offices
- Retail
- Logistics
- Others (Industrial Parks, Hospitality, Mixed-Use)
- By Business Model
- Sales
- Rental
- By End-User (Value)
- Individuals / Households
- Corporates & SMEs
- Others (Institutions, Government, NGOs)
- By Geography
- North America
- United States
- Canada
- Mexico
- Europe
- Germany
- United Kingdom
- France
- Italy
- Spain
- Rest of Europe
- Asia - Pacific
- China
- India
- Japan
- South Korea
- Australia
- Rest of Asia - Pacific
- South America
- Brazil
- Argentina
- Chile
- Rest of South America
- Middle East and Africa
- United Arab Emirates
- Saudi Arabia
- South Africa
- Nigeria
- Rest of Middle East and Africa
- North America
Detailed Research Methodology and Data Validation
Primary Research
Mordor interviewers spoke with developers, brokerage executives, asset managers, and municipal permitting officers across North America, Europe, the Gulf, and key Asian hubs. Discussions validated vacancy swings, average selling prices, and pipeline slippages while flagging segment-specific risks that desk sources rarely capture.
Desk Research
Our analysts screened open government statistics such as UN DESA construction value tables, OECD gross fixed capital formation series, and national planning department pipeline bulletins, complemented by association dashboards from the Urban Land Institute and FIABCI. Company 10-Ks, REIT filings, and investor presentations provided recent cap-rate trends and asset disposals. Subscription datasets from D&B Hoovers and Dow Jones Factiva helped cross-verify ownership changes and transaction values. The sources cited here illustrate the breadth employed; many others informed individual data points.
Market-Sizing and Forecasting
We start with a top-down reconstruction of the demand pool by aligning non-residential construction outlays, REIT asset books, and cross-border direct investment flows, which are then reconciled with bottom-up supplier roll-ups from sampled broker transaction logs and channel checks. Variables such as prime cap-rate movements, Grade-A vacancy, logistics absorption, construction-cost indices, and currency shifts feed a multivariate regression that projects value through 2030. Where data gaps emerge, say for private placement deals, weighted regional proxies are applied before results pass a single round of top-down and bottom-up adjustment.
Data Validation and Update Cycle
Outputs face anomaly scans against MSCI index benchmarks and Moody's leverage ratios, followed by peer review among senior Mordor analysts. Reports refresh annually and are re-opened mid-cycle if policy shocks or macro events move fundamentals materially. Before release, an analyst performs a final pass so clients receive the most current view.
Why Mordor's Commercial Real Estate Baseline Deserves Decision-Makers' Trust
Published figures often diverge because firms select different asset buckets, price assumptions, or refresh cadences. Our disciplined scope, annual recalibration, and dual-track modeling keep numbers both transparent and repeatable.
Key gap drivers include: some publishers fold multifamily or property-management service fees into CRE totals, others restrict coverage to institutional-grade assets in mature markets, and a few rely solely on headline construction spending without vacancy or yield normalization.
Benchmark comparison
| Market Size | Anonymized source | Primary gap driver |
|---|---|---|
| USD 6.22 Trillion (2025) | Mordor Intelligence | |
| USD 7.50 Trillion (2024) | Global Consultancy A | Includes large-scale rental housing and service revenue, relies on single-step top-down model |
| USD 1.36 Trillion (2024) | Industry Association B | Captures only investment-grade transactions in 30 major cities; excludes emerging regions and pipeline valuations |
The comparison shows how scope breadth, data layering, and refresh timing explain headline gaps. Mordor's balanced, variable-driven baseline gives investors and strategists a dependable starting point for scenario planning and asset allocation.


Key Questions Answered in the Report
What is the current size and growth outlook for the global commercial real estate market?
The commercial real estate market size is USD 6,345.2 billion in 2026 and is projected to reach USD 8,483.3 billion by 2031 at a 5.98% CAGR.
Which property types are leading demand in 2026?
Logistics and industrial assets lead growth as omnichannel retail expands, while offices remain the largest legacy slice by revenue with a 35% share in 2025.
How is hybrid work shaping office performance?
Hybrid policies keep weekly utilization below peaks, which sustains high vacancy and drives a flight to quality into amenity-rich, efficient buildings.
Where is investment momentum strongest by region?
Asia-Pacific held the largest share at 33% in 2025, while South America shows the fastest growth trajectory at a 6.46% rate through 2031.
What are the main headwinds to new development in 2026?
Construction and financing costs, slower entitlements, and insurance premiums are compressing yields and delaying speculative projects.
How is AI impacting the commercial real estate market?
AI is accelerating hyperscale data center pipelines and automating site selection, which shifts development toward power-rich and secondary markets with strong logistics links.
Page last updated on:


