Methyl Tertiary Butyl Ether (MTBE) Market Size and Share
Market Overview
| Study Period | 2021 - 2031 |
|---|---|
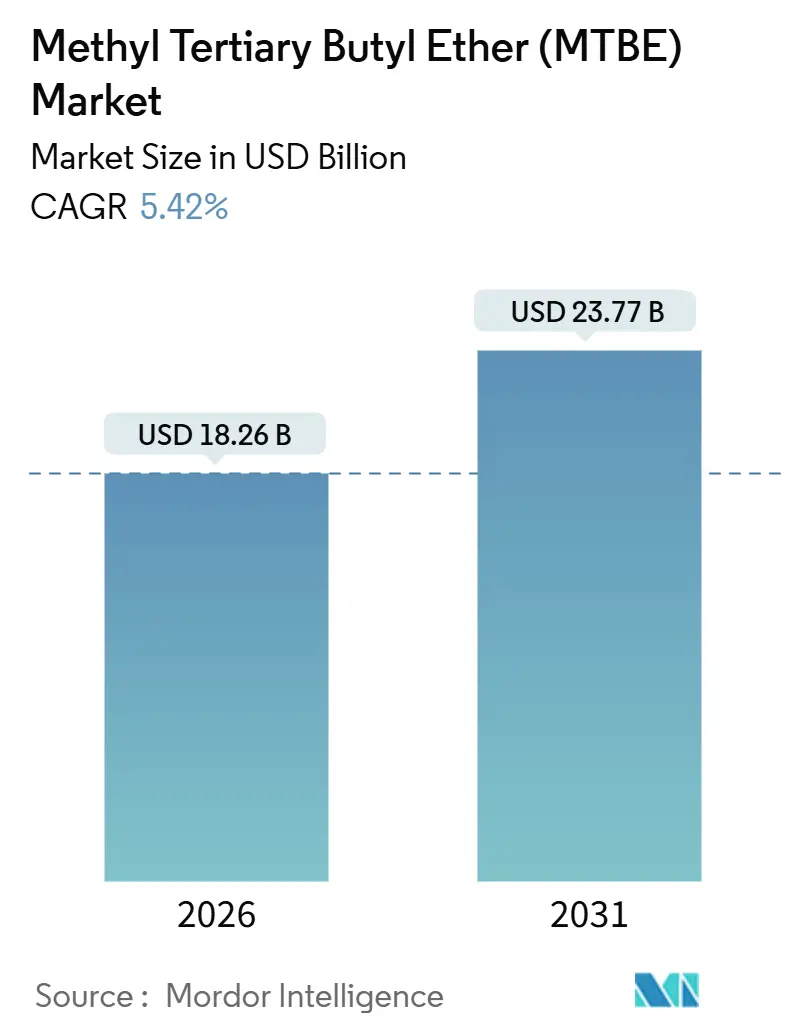
| Market Size (2026) | USD 18.26 Billion |
| Market Size (2031) | USD 23.77 Billion |
| Growth Rate (2026 - 2031) | 5.42% CAGR |
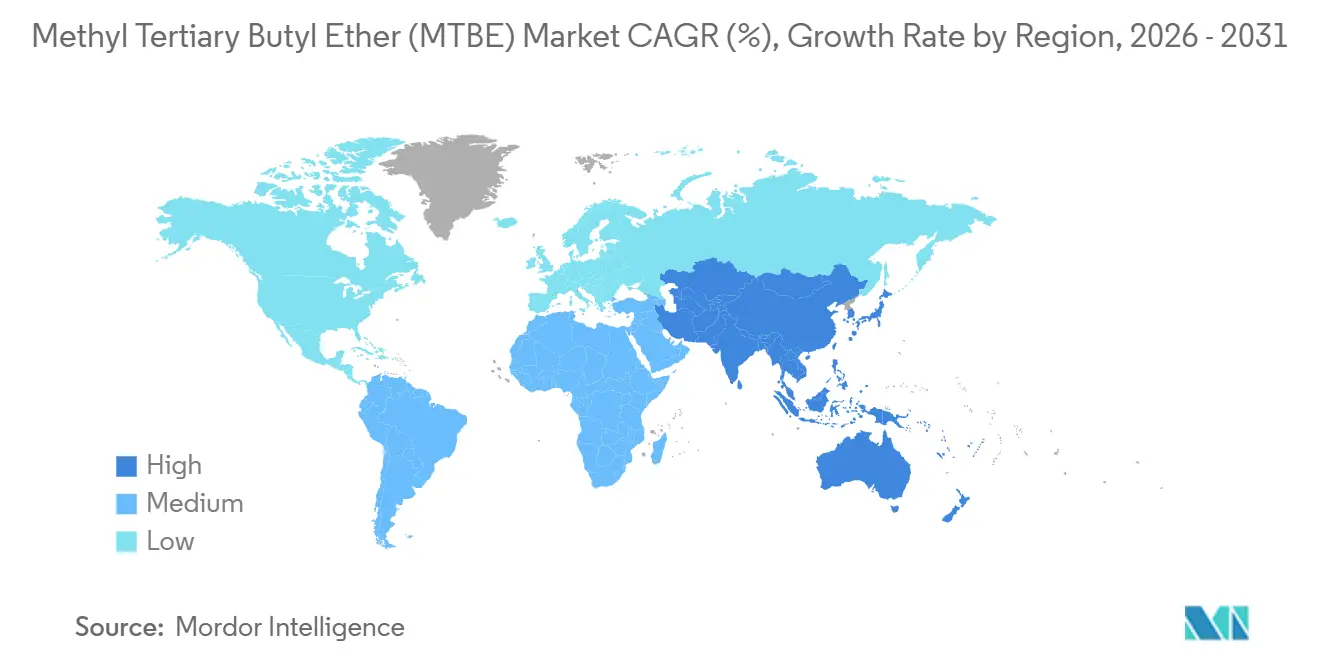
| Fastest Growing Market | Asia-Pacific |
| Largest Market | Asia-Pacific |
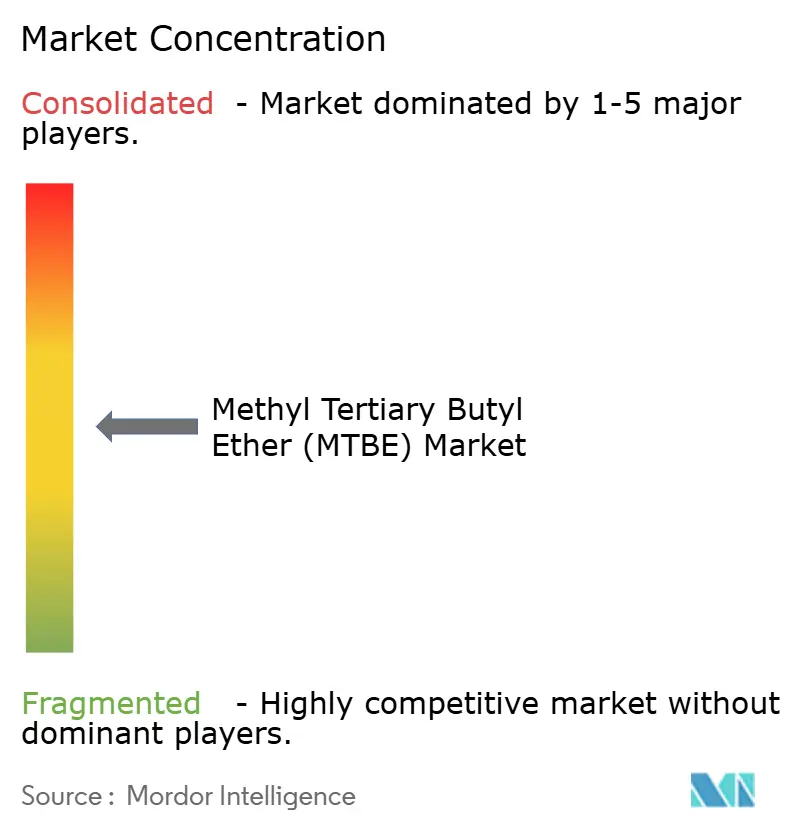
| Market Concentration | Medium |
Major Players *Disclaimer: Major Players sorted in no particular order Image © Mordor Intelligence. Reuse requires attribution under CC BY 4.0. | |
Methyl Tertiary Butyl Ether (MTBE) Market Analysis by Mordor Intelligence
The Methyl Tertiary Butyl Ether Market size is estimated at USD 18.26 billion in 2026, and is expected to reach USD 23.77 billion by 2031, at a CAGR of 5.42% during the forecast period (2026-2031). Asia-Pacific and the Middle East are installing integrated MTBE-plus-petrochemical complexes to meet tougher octane and low-aromatic fuel mandates, while North America and Europe are switching to ethanol or ETBE in response to groundwater-protection rules. Divergent regulations are therefore creating a two-speed margin landscape that favors capacity additions east of Suez. Industrial-grade volumes continue to dominate because refiners blend MTBE at 10-15% to lift research octane by 6-8 points, yet specialty grades are opening new revenue pools in pharmaceuticals and high-purity isobutylene. On the supply side, integrated refiners are embedding on-purpose MTBE units to monetize C4 raffinate, cushioning profitability against volatile olefin cycles.
Key Report Takeaways
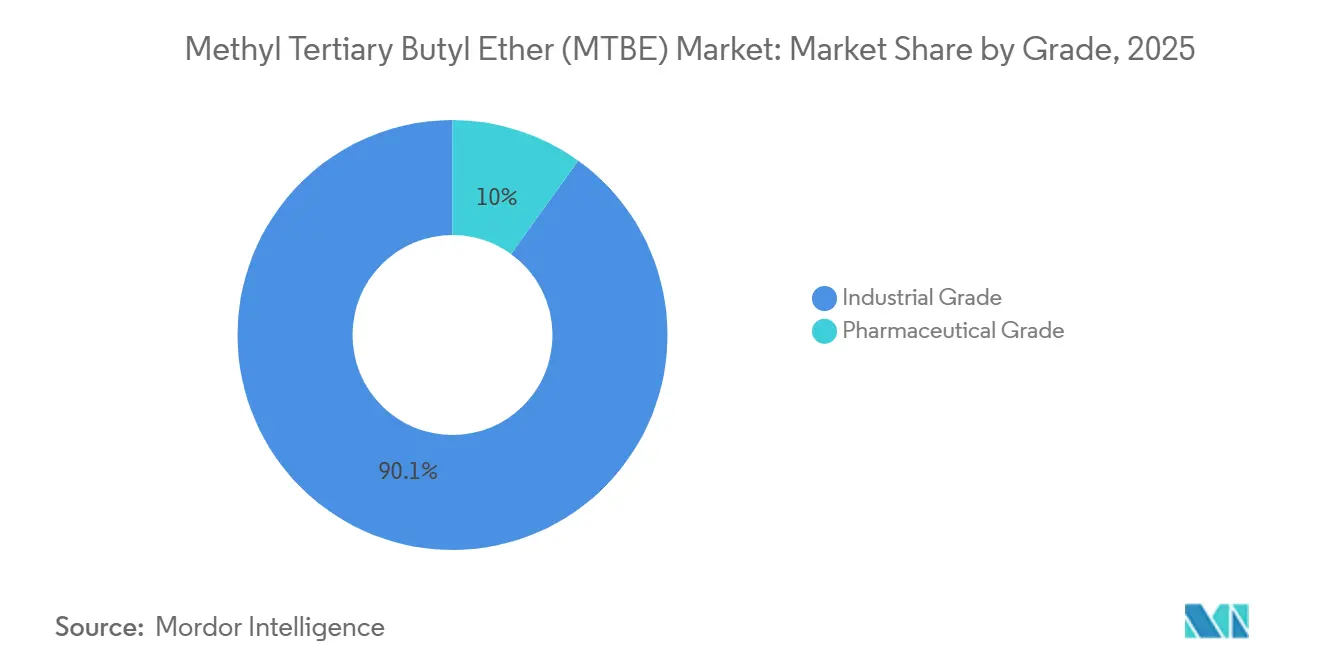
- By grade, industrial MTBE commanded 90.05% of 2025 revenue, while pharmaceutical grade is forecast to expand at a 5.93% CAGR to 2031.
- By distribution channel, direct contracts held 70.12% of 2025 deliveries, whereas online sales are advancing at a 6.32% CAGR through 2031.
- By application, gasoline additives generated 72.24% of 2025 demand, yet solvent use is increasing at a 5.90% CAGR during the outlook period.
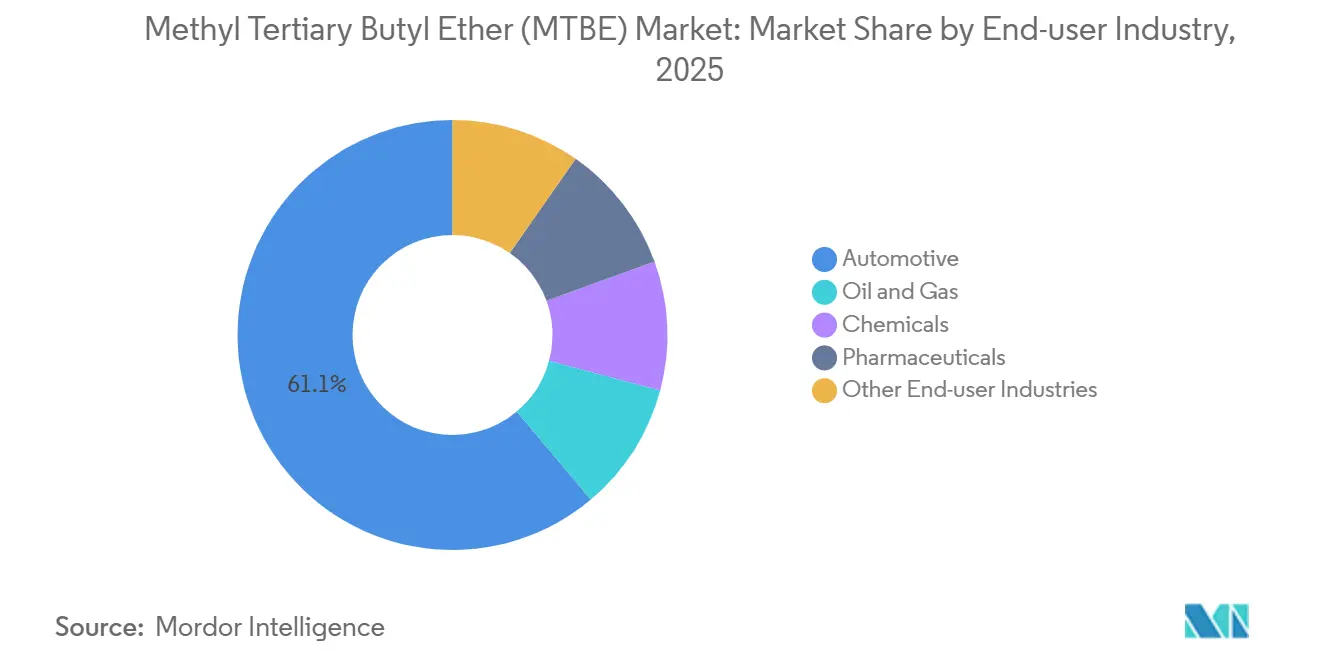
- By end-user industry, automotive absorbed 61.13% of 2025 volumes, while pharmaceuticals are rising at a 6.06% CAGR to 2031.
- By geography, Asia-Pacific captured 42.26% of 2025 consumption and is projected to grow at a 6.24% CAGR, the highest among all regions.
Note: Market size and forecast figures in this report are generated using Mordor Intelligence’s proprietary estimation framework, updated with the latest available data and insights as of January 2026.
Global Methyl Tertiary Butyl Ether (MTBE) Market Trends and Insights
Driver Impact Analysis*
| Drivers | (~) % Impact on CAGR Forecast | Geographic Relevance | Impact Timeline |
|---|---|---|---|
| Surging low-aromatic, high-octane gasoline mandates in Asia-Pacific | +1.8% | China, India, Japan, South Korea, Southeast Asia | Medium term (2-4 years) |
| Petro-refinery expansion in Middle East integrated with on-purpose MTBE units | +1.5% | Saudi Arabia, UAE, Qatar, Kuwait | Long term (≥ 4 years) |
| Methanol-to-gasoline route adoption in Asia elevating MTBE demand | +0.9% | China, with pilot interest in India and Southeast Asia | Medium term (2-4 years) |
| Rising demand for iso-octene (via MTBE dehydrogenation) in high-performance tires | +0.7% | Global, with concentration in Asia-Pacific and North America | Long term (≥ 4 years) |
| Growing use of MTBE as co-solvent in specialty API extraction | +0.4% | Global, led by India, China, and Europe | Short term (≤ 2 years) |
| Source: Mordor Intelligence | |||
Surging Low-Aromatic, High-Octane Fuel Mandates in Asia-Pacific
Governments across the Asia-Pacific are tightening gasoline specifications to curb urban air pollution. China’s GB 17930-2016 caps benzene at 0.8% and aromatics at 40% while requiring a minimum 92 RON; blending MTBE at 10-15% allows refiners to meet the rule without major hydrocracker investments[1]Ministry of Ecology and Environment, “GB 17930-2016 Gasoline Standard,” mee.gov.cn. India’s Bharat Stage VI fuel code under review for a 2025 update follows a similar logic, prompting Indian Oil Corporation and Bharat Petroleum to raise MTBE ratios[2]Petroleum Planning and Analysis Cell, “India Fuel Specification Roadmap,” ppac.gov.in. Japan’s fuel standard favors MTBE instead of ethanol because arable land is scarce, sustaining a stable demand base. Passenger-car fleets in Asia-Pacific are expanding at nearly 5% annually, so every additional vehicle locks in 120-225 liters of MTBE-containing gasoline each year. The additive, therefore, acts as a transitional octane solution until electric vehicles reach mass-market penetration after 2030.
Petro-Refinery Expansion in the Middle East with On-Purpose MTBE
National oil companies are integrating crude refining and petrochemicals to diversify away from pure crude exports. Saudi Aramco and Sinopec’s Yasref expansion, announced in April 2025, added a 1.8 million tpy ethylene cracker plus an MTBE unit to valorize C4 raffinate. Similar blueprints are evident in Sinopec–Aramco Fujian (USD 10 billion, ground-breaking November 2024) and QatarEnergy’s USD 6 billion complex under the North Field program. Integrated flows cut feedstock costs because raffinate trades at a discount to methanol and free isobutylene, lifting refinery complexity margins by about USD 3 per barrel. Vision 2030’s National Industrial Development and Logistics Program guarantees streamlined permitting and project-finance support, accelerating MTBE start-ups in the Gulf.
Methanol-to-Gasoline Adoption Elevates MTBE Demand
China already operates more than 2 million tpy of MTG capacity that converts coal-derived methanol into synthetic gasoline; MTBE is blended at 5-8% to stabilize vapor pressure and boost octane. The pathway reduces China’s crude-import dependency, which stood at 73% in 2024, by tapping domestic coal reserves above 140 billion tonnes. India’s NITI Aayog is assessing MTG pilots slated for start-up after 2027, and several Southeast Asian countries with stranded gas reserves are conducting feasibility studies. MTG plants create a baseline MTBE draw that is decoupled from refinery utilization, providing downside protection in weak gasoline cycles.
Rising Iso-Octene Demand via MTBE Dehydrogenation for High-Performance Tires
The shift toward low-rolling-resistance radial tires is lifting butyl-rubber usage, which requires ultra-pure isobutylene. ExxonMobil and Axens commercialized an MTBE-decomposition technology in January 2025 that yields 99.5% pure isobutylene, meeting tight polymerization specs. Butyl-rubber demand in tires is growing at roughly 4.5% per year as automakers chase fuel-economy and CO₂ targets in the United States, Europe, and China. MTBE becomes an economic swing feedstock whenever its price drops below 1.2 times spot isobutylene, a condition observed in Asia during 2H 2024, according to Argus pricing data. The option to toggle MTBE into petrochemicals underpins producer margins when gasoline demand softens.
Restraint Impact Analysis*
| Restraints | (~) % Impact on CAGR Forecast | Geographic Relevance | Impact Timeline |
|---|---|---|---|
| Availability of substitutes (ethanol, ETBE, TAME) | -1.2% | Europe, North America, Brazil, with spillover to Southeast Asia | Medium term (2-4 years) |
| Classification as pollutant and gasoline-blending bans in North America | -0.8% | United States, Canada, with regulatory scrutiny in Mexico | Long term (≥ 4 years) |
| Volatility in C4 raffinate availability from steam crackers | -0.5% | Global, with acute impact in Northeast Asia and U.S. Gulf Coast | Short term (≤ 2 years) |
| Source: Mordor Intelligence | |||
Availability of Substitutes Such as Ethanol, ETBE, and TAME
Europe’s RED II and RED III require 14% renewable energy in transport by 2030, and ETBE made from bioethanol qualifies, whereas fossil-based MTBE does not. Refiners in France, Germany, and Italy had already shifted almost completely to ETBE by 2024. Brazil’s long-standing E27 ethanol mandate displaces MTBE altogether, and the nation’s flex-fuel fleet entrenches ethanol’s position. The U.S. Renewable Fuel Standard compels blenders to use 15 billion gallons of corn ethanol annually, removing MTBE from the octane toolbox. South Korea and Taiwan are exploring TAME because it biodegrades faster in groundwater. Southeast Asian countries are rolling out biodiesel and ethanol programs that may further erode regional MTBE demand over the next decade.
Pollutant Classification and Blending Bans in North America
California banned MTBE in 2004 after detecting it in groundwater, sparking similar prohibitions in 19 U.S. states. U.S. MTBE inventories collapsed from 8.5 million barrels in 2005 to 1.2 million barrels in 2024, while production plunged below 30,000 bpd. Canadian refiners switched voluntarily to ethanol to avoid cross-border supply chain complications, and Mexico’s NOM-016-CRE-2016 cap of 15% MTBE is under regulatory review. Legal liability fears keep blenders away from MTBE even where it remains technically permitted, effectively pricing the additive out of North America and influencing policy debates in Australia and New Zealand.
*Our forecasts treat driver/restraint impacts as directional, not additive. The impact forecasts reflect baseline growth, mix effects, and variable interactions.
Segment Analysis
By Grade: Industrial Volumes Dominate, Pharmaceutical Niche Scales
Industrial-grade MTBE accounted for 90.05% of 2025 revenue, underscoring its use as an octane booster in Asia-Pacific and Middle Eastern gasoline pools, whereas pharmaceutical-grade MTBE is forecast to increase at 5.93% through 2031 as API producers favor its low polarity and Class 3 FDA status. The Methyl tertiary butyl ether market size for the industrial segment is projected to maintain high absolute growth because every new refinery barrel blended at 10-15% MTBE locks in a large volumetric pull. Integrated complexes in China and the Gulf ensure secure raffinate supply, preserving cost competitiveness.
Strategic upside resides in the pharmaceutical niche, which commands a 20-30% price premium due to 99.8% assay, sub-10 ppm water, and sub-50 ppm methanol specifications. Indian and Chinese API hubs in Hyderabad, Ahmedabad, and Visakhapatnam are adding capacity that will sustain a 5-6% demand trajectory for pharmaceutical-grade. European API makers are also shifting away from dichloromethane under REACH, reinforcing this high-margin outlet. If conversion projects proceed as planned, this will provide meaningful diversification for producers exposed to fuel cycles.


By Distribution Channel: Direct Contracts Prevail, Digital Platforms Advance
Direct sales claimed 70.12% of 2025 deliveries because refinery offtake agreements bundle volume, pricing formulas, and technical support, ensuring octane compliance at the gasoline rack. This route will stay dominant for bulk fuel applications, but the Methyl tertiary butyl ether market is witnessing new e-commerce models that cater to mid-sized chemical buyers.
Online platforms such as 1688.com and ChemBuyersClub are posting spot MTBE offers with next-day delivery in China’s coastal provinces, and adoption is spreading to India as logistics networks improve. Online sales are expected to expand faster at a 6.32% CAGR through 2031. Distributors keep serving regional buyers who lack storage or credit lines. By 2031, direct contracts may still exceed 60% share, yet digital commerce will capture most of the incremental margin in specialty and pharma grades.
By Application: Gasoline Additives Lead but Solvents Accelerate
Gasoline additives generated 72.24% of 2025 demand because blending MTBE into gasoline at 10-15% remains the cheapest route to boost octane without multi-hundred-million-dollar reformer upgrades. The Methyl tertiary butyl ether market share for gasoline additives is unlikely to shrink in Asia-Pacific before electric vehicle penetration accelerates in the 2030s.
Solvent usage, however, is gaining ground at a 5.90% CAGR as pharmaceutical and specialty-chemical firms replace chlorinated solvents with MTBE under green-chemistry programs. Isobutene manufacture through MTBE decomposition provides another growth lever, especially after the ExxonMobil-Axens license was rolled out in 2025. The Methyl tertiary butyl ether market size for the solvent segment is set to rise steadily because pharmaceutical demand is price-inelastic and commands higher margins, cushioning producers when gasoline spreads narrow.
By End-User Industry: Automotive Volume Heavy, Pharmaceuticals in Fast Lane
Automotive accounted for 61.13% of 2025 MTBE volumes, given its direct link to gasoline consumption. Asia-Pacific added 18 million passenger cars in 2024, each consuming 1,200-1,500 liters of gasoline blended with MTBE. Even modest improvements in fleet fuel economy still leave significant additive requirements in absolute terms, so the Methyl tertiary butyl ether market remains anchored in transport fuels.
Pharmaceuticals stand out as the fastest-growing end-user at a 6.06% CAGR to 2031. India supplies 40% of global generic APIs and is scaling solvent-intensive lipid extraction and chromatography operations that prefer MTBE for its volatility and regulatory acceptance. European API producers are on a similar path under REACH. Chemicals and oil-and-gas end-users provide a stable baseline offtake for isobutylene and specialty intermediates, but their growth lags pharmaceuticals. The gradual tilt toward non-fuel uses diversifies revenue streams and reduces exposure to future gasoline-blend limits.

Geography Analysis
Asia-Pacific dominated the Methyl tertiary butyl ether market with a 42.26% share in 2025 and is forecast to expand at a 6.24% CAGR to 2031. China operates over 15 million tons/year of capacity and blends MTBE at 10-15% to hit GB 17930-2016 octane and aromatic caps, while India, Japan, and Southeast Asia tighten fuel standards that require similar oxygenate levels. Methanol-to-gasoline plants in China create an additional structural demand layer that is decoupled from refinery runs. Vehicle-fleet growth of nearly 5% annually keeps gasoline consumption high, sustaining the regional pull for MTBE.
The Middle East is the second-fastest growing cluster due to refiners embedding on-purpose MTBE units within petrochemical parks. Saudi Aramco–Sinopec Yasref and the Fujian complex exemplify the model, while QatarEnergy’s project under the North Field expansion adds new supply aimed primarily at Asian markets. Integrated sites monetize discounted C4 raffinate, improving economics relative to standalone methanol-plus-isobutylene routes. Africa offers scattered but rising opportunities as South Africa reviews fuel-quality laws and Nigeria’s Dangote refinery ramps up.
North America and Europe have largely exited the MTBE blend pool. U.S. production fell below 30,000 bpd in 2024 after state-level bans, and Canadian refiners shifted to ethanol. Europe’s RED III pushes refiners to ETBE or ethanol, so MTBE demand there is confined to niche solvent and chemical uses. Latin America is similarly limited because Brazil blends E27 ethanol, and Argentina follows comparable biofuel mandates. The demand map therefore shows a pronounced east-of-Suez tilt that is unlikely to reverse before renewable-octane substitutes scale in Asia.

Competitive Landscape
The global methyl tertiary butyl ether market is moderately consolidated. Capacity additions in China and the Gulf now exceed incremental demand, pressuring spot margins and spurring producers to focus on feedstock integration and higher-margin specialty grades. Integrated refiners embed MTBE units to upgrade C4 raffinate, leveraging existing hydrogen, utilities, and logistics networks. Sinopec and Aramco use this model in Fujian and Yanbu to extract value across the hydrocarbon chain. In contrast, specialty players such as Vinati Organics and Huntsman target pharmaceutical-grade output, commanding premiums that shield them from gasoline-cycle swings. Technology licensors ExxonMobil and Axens are monetizing intellectual property - especially the 2025 MTBE-to-isobutylene process - to earn fees rather than battle in commodity sales. Technology is becoming a critical differentiator. LyondellBasell filed a 2024 patent covering integrated MTBE synthesis from ethylene that cuts dependence on raffinate and lowers energy intensity. Producers with Asian and Middle Eastern market exposure can offset European and North American decline, whereas those tied to mature markets face structural headwinds. Overall, bargaining power is shifting toward refiners that can supply raffinate feedstock and take MTBE back into gasoline pools, creating a vertically looped ecosystem.
Methyl Tertiary Butyl Ether (MTBE) Industry Leaders
China Petrochemical Corporation
SABIC
LyondellBasell Industries Holdings B.V.
Evonik Industries AG
QAFAC
- *Disclaimer: Major Players sorted in no particular order

Recent Industry Developments
- January 2025: ExxonMobil and Axens formalized a licensing alliance to commercialize MTBE decomposition technology that produces 99.5% isobutylene for butyl-rubber polymerization.
- January 2025: Shell and CNOOC approved the Huizhou Phase 3 petrochemical expansion in Guangdong, China, adding 1.6 million tpy of ethylene capacity integrated with MTBE units for C4 raffinate processing.
- November 2024: Sinopec and Saudi Aramco broke ground on the USD 10 billion Fujian petrochemical complex including a 1.5 million tpy cracker and downstream MTBE facilities designed for 95% feedstock integration.


Research Methodology Framework and Report Scope
Market Definitions and Key Coverage
Our study defines the global methyl tertiary butyl ether market as the value generated from freshly produced MTBE that leaves petrochemical or refinery gates for use as gasoline oxygenate, isobutene feedstock, or specialty solvent across automotive, oil and gas, and chemical end users. Value is calculated at typical free-on-board refinery prices and converted into United States dollars using annual average exchange rates.
Scope exclusion: The model omits bio-derived ETBE, recycled streams, and captive MTBE consumed internally by integrated petrochemicals.
Segmentation Overview
- By Grade
- Industrial Grade
- Pharmaceutical Grade
- By Distribution Channel
- Direct Sales
- Distributors
- Online Sales
- By Application
- Gasoline Additives
- Isobutene
- Solvents
- Other Applications
- By End-user Industry
- Automotive
- Oil and Gas
- Chemicals
- Pharmaceuticals
- Other End-user Industries
- By Geography
- Asia-Pacific
- China
- India
- Japan
- South Korea
- Rest of Asia-Pacific
- North America
- United States
- Canada
- Mexico
- Europe
- Germany
- United Kingdom
- Italy
- France
- Rest of Europe
- South America
- Brazil
- Argentina
- Rest of South America
- Middle East and Africa
- Saudi Arabia
- United Arab Emirates
- Qatar
- Turkey
- South Africa
- Nigeria
- Rest of Middle East and Africa
- Asia-Pacific
Detailed Research Methodology and Data Validation
Primary Research
We spoke with refinery planners in China and the Middle East, gasoline blenders in North America, and European distributors. Their feedback on contract premiums, seasonal pull, and upcoming capacity additions validated desk assumptions and filled regional data gaps.
Desk Research
We began with public datasets from sources such as the US Energy Information Administration, Eurostat, China National Bureau of Statistics, OPEC, and UN Comtrade to map gasoline pool size, methanol input trends, refinery output, and cross-border MTBE flows. Policy notes from the International Energy Agency and regional environmental regulators clarified oxygenate blending mandates that shape demand. Company 10-K filings, investor presentations, and association white papers supplied margin ranges and average selling prices. Subscription tools that Mordor Intelligence licenses, notably D&B Hoovers for producer revenues and Dow Jones Factiva for project news, refined competitive shares. The above list is illustrative. Several additional secondary sources informed gap checks.
Market-Sizing and Forecasting
A top-down construct starts with national gasoline consumption and mandated oxygenate dosing rates, then multiplies these by average MTBE blend ratios to build demand pools. Producer utilization roll-ups and sampled contract ASP multiplied by volume checks provide bottom-up anchors that let us adjust totals. Key variables tracked include methanol prices, light olefin cracker utilization, octane enhancement regulations, vehicle miles traveled, and refinery turnaround schedules. Forecasts apply multivariate regression using the above predictors, while scenario analysis layers in abrupt policy changes. When bottom-up estimates miss informal trade, we bridge gaps with trade to consumption elasticities vetted through expert calls.
Data Validation and Update Cycle
Outputs pass variance thresholds, peer review, and automated coherence tests against independent price and volume series. Reports refresh every year, and interim updates follow material plant events or mandate revisions. Before delivery, an analyst undertakes a fresh sweep so clients receive the latest view.
Why Mordor's Methyl Tertiary Butyl Ether Baseline Commands Reliability
Published estimates often differ because firms vary scope choices, pricing bases, and refresh cadence. By focusing on virgin MTBE volumes, FOB valuation, and an annual update schedule, Mordor Intelligence offers figures that clients can trace with confidence.
Key gap drivers include other publishers blending ETBE, adding captive use, anchoring on 2023 data, or relying on single-source capacity spreadsheets with minimal primary validation.
Benchmark comparison
| Market Size | Anonymized source | Primary gap driver |
|---|---|---|
| USD 18.20 B (2025) | Mordor Intelligence | NA |
| USD 16.87 B (2023) | Global Consultancy A | Older base year and capacity only model |
| USD 17.29 B (2024) | Research Firm B | Includes derivative grades and limited primary checks |
| USD 16.47 B (2024) | Industry Analytics C | Excludes solvent demand and applies uniform ASP |
The comparison shows how our disciplined variable selection and dual-layer validation deliver a balanced, transparent baseline that decision makers rely upon.


Key Questions Answered in the Report
What is the current value of the Methyl tertiary butyl ether market?
It is estimated at USD 18.26 billion in 2026 and is projected to grow to USD 23.77 billion by 2031.
Which region accounts for the largest share of MTBE demand?
Asia-Pacific captured 42.26% of global consumption in 2025 and is expanding at a 6.24% CAGR through 2031.
What is driving MTBE growth outside of fuel blending?
Adoption in pharmaceutical lipid extraction and chromatography, plus MTBE-to-isobutylene conversion for high-performance tires, is lifting specialty-grade demand.
Why are European refiners replacing MTBE with ETBE or ethanol?
Renewable Energy Directive targets qualify bio-based oxygenates for compliance credits, making ETBE and ethanol more attractive than fossil-sourced MTBE.
How quickly is pharmaceutical-grade MTBE demand rising?
Volumes are expected to advance at a 5.93% CAGR to 2031 as API producers phase out chlorinated solvents.
What technology is broadening MTBE’s downstream uses?
The ExxonMobil–Axens dehydrogenation process converts MTBE into 99.5% pure isobutylene for butyl-rubber production, creating a petrochemical outlet.
Page last updated on:


