
Medical Marijuana Market Size and Share
Market Overview
| Study Period | 2020 - 2031 |
|---|---|
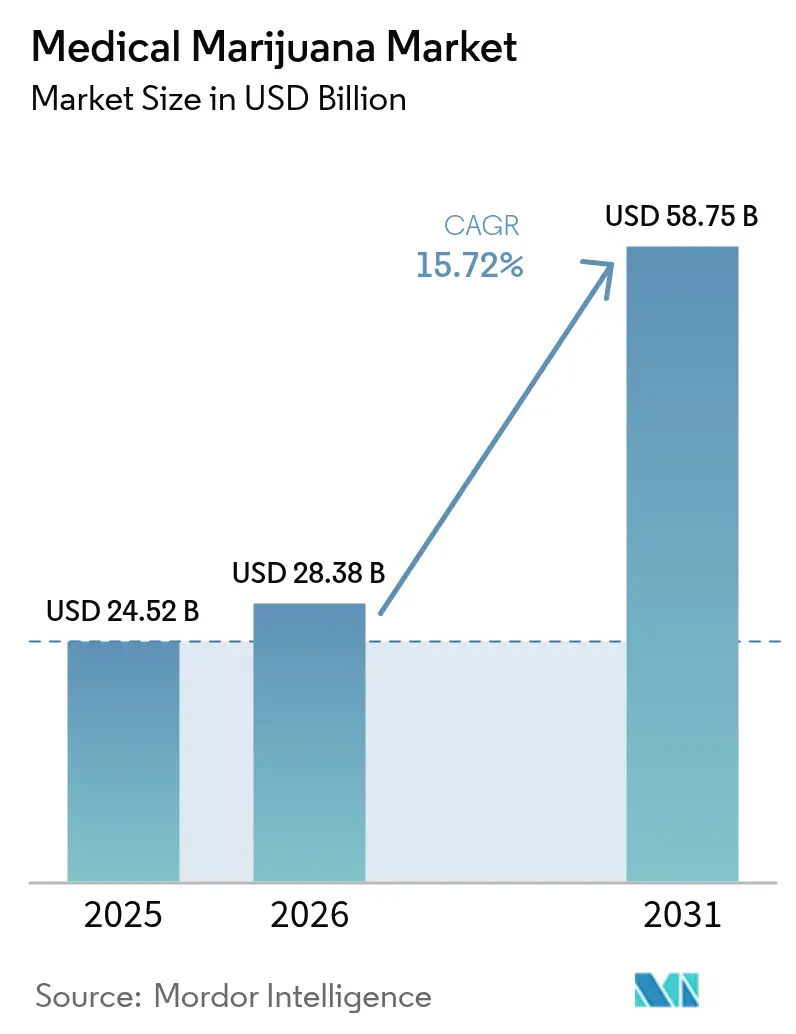
| Market Size (2026) | USD 28.38 Billion |
| Market Size (2031) | USD 58.75 Billion |
| Growth Rate (2026 - 2031) | 15.72 % |
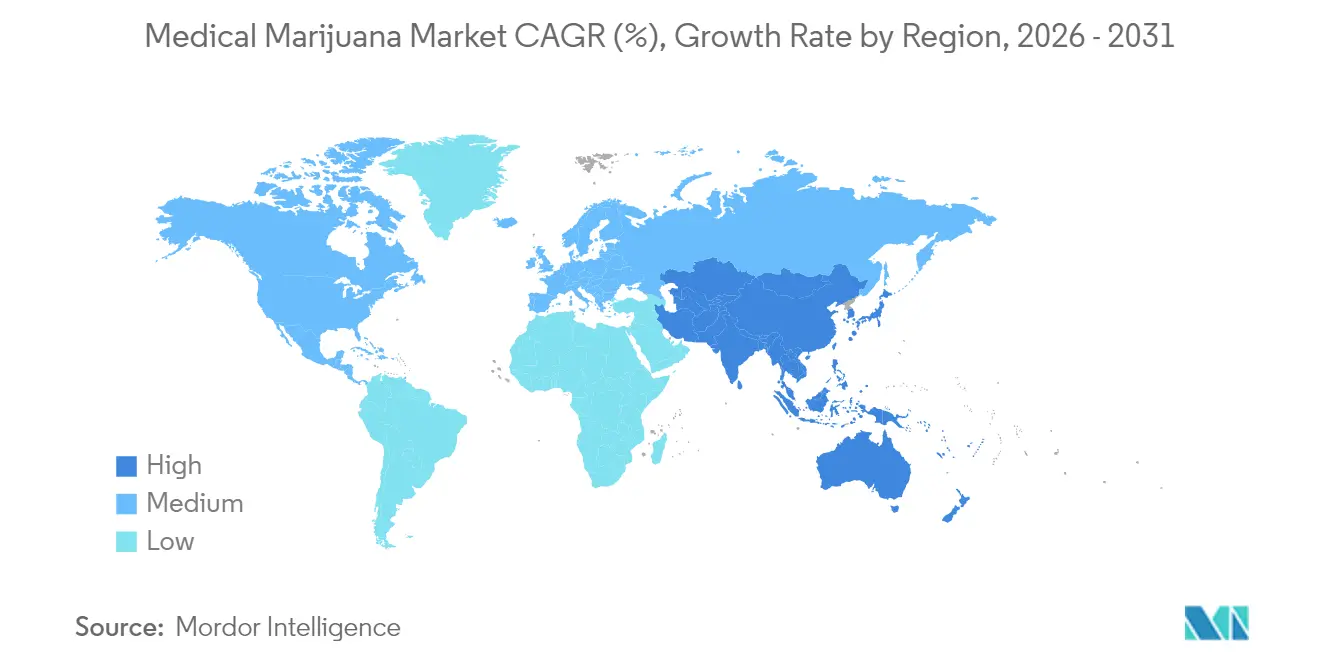
| Fastest Growing Market | Asia Pacific |
| Largest Market | North America |
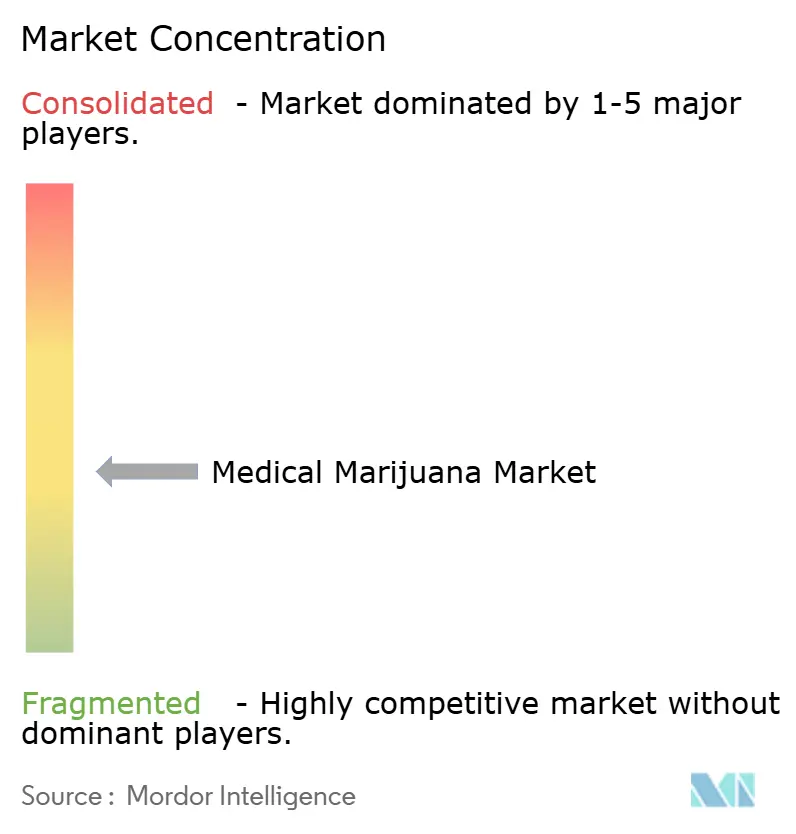
| Market Concentration | Medium |
Major Players *Disclaimer: Major Players sorted in no particular order Image © Mordor Intelligence. Reuse requires attribution under CC BY 4.0. | |
Medical Marijuana Market Analysis by Mordor Intelligence
The medical marijuana market size is expected to grow from USD 24.52 billion in 2025 to USD 28.38 billion in 2026 and is forecast to reach USD 58.75 billion by 2031 at 15.72% CAGR over 2026-2031. Momentum gathers as regulators in major economies adopt evidence-based frameworks that normalize cannabis-based medicines within mainstream healthcare pathways. Rising insurance reimbursement, expanding Phase 3 trials for chronic pain and oncology, and large-scale indoor vertical farming have strengthened investor confidence. Pharmaceutical companies capture share by securing EU-GMP certificates and FDA orphan-drug designations, while capacity additions in controlled-environment agriculture reduce batch-to-batch variability. Cross-border partnerships between cultivators and life-science firms further accelerate clinical validation and distribution reach, reinforcing the medical marijuana market shift from cottage-style operations to pharmaceutical-grade supply chains.
Key Report Takeaways
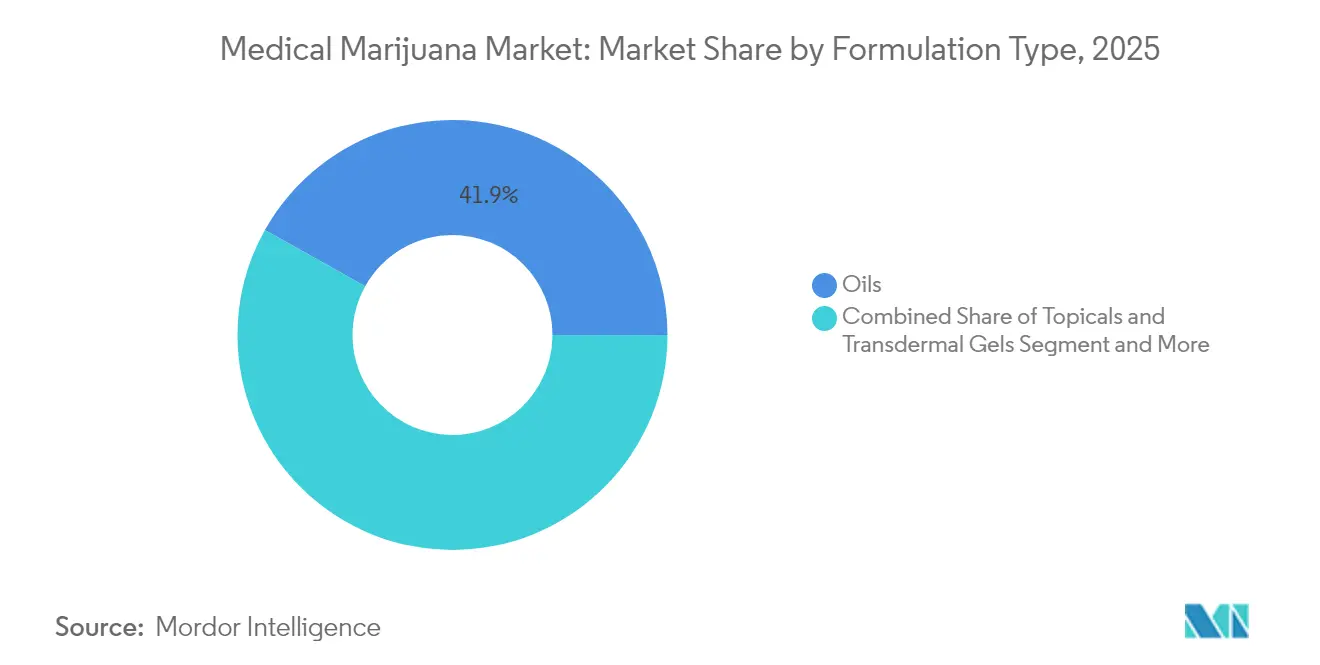
- By formulation type: Oils maintained 41.88% of medical marijuana market share in 2025; topicals and transdermal gels are expanding at a 19.62% CAGR through 2031.
- By cannabinoid composition: CBD-dominant products represented 49.05% of the medical marijuana market size in 2025, while THC-dominant formulations are growing at 21.12% CAGR to 2031.
- By route of administration: Oral delivery captured 45.11% of the medical marijuana market size in 2025; sublingual formats record a 18.94% CAGR to 2031.
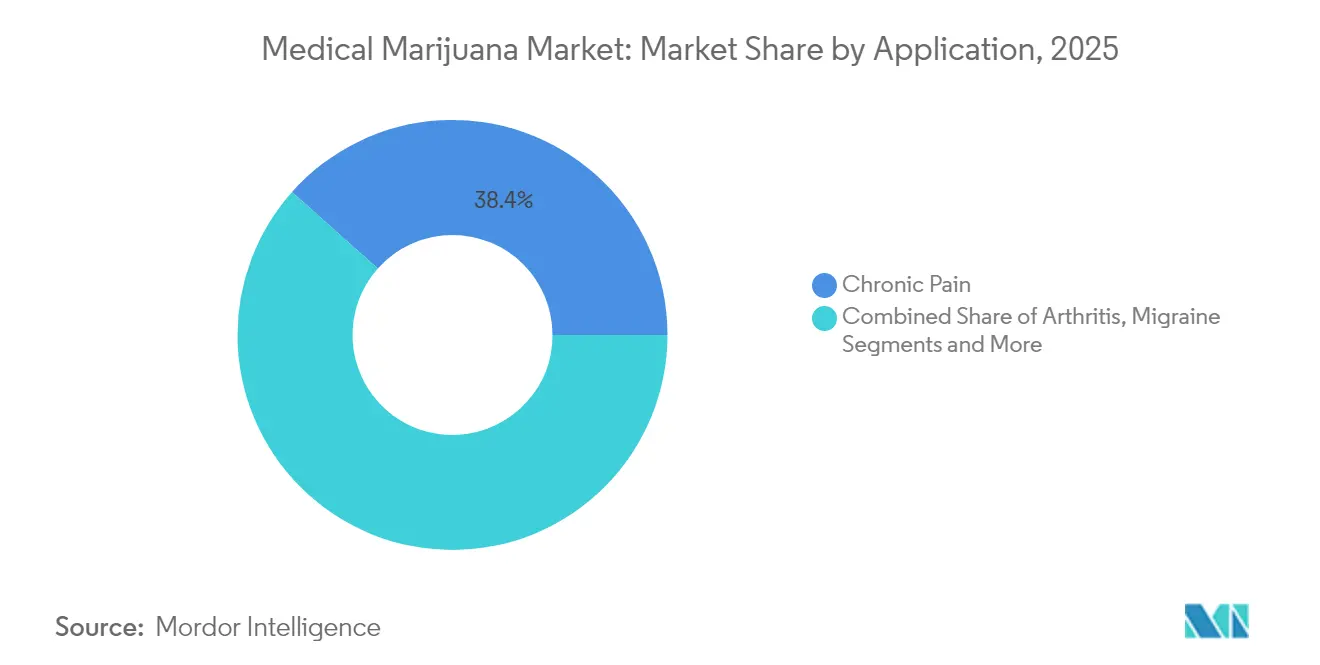
- By application: Chronic pain held 38.41% of the medical marijuana market size in 2025, whereas neurological disorders post the fastest CAGR at 18.06% through 2031.
- By distribution channel: Retail dispensaries commanded 55.94% revenue in 2025; online platforms exhibit a 19.98% CAGR to 2031.
- By geography: North America contributed 42.35% revenue in 2025; Asia–Pacific is projected to grow at 19.04% CAGR to 2031.
Note: Market size and forecast figures in this report are generated using Mordor Intelligence’s proprietary estimation framework, updated with the latest available data and insights as of 2026.
Global Medical Marijuana Market Trends and Insights
Drivers Impact Analysis*
| Driver | (~) % Impact on CAGR Forecast | Geographic Relevance | Impact Timeline |
|---|---|---|---|
| Favourable reimbursement policies & expanding insurance pilots | +3.2% | North America & EU cores | Medium term (2-4 years) |
| Rising clinical-trial pipeline targeting chronic pain & oncology | +4.1% | Global, led by North America & Europe | Long term (≥4 years) |
| Increasing legalisation across G-20 economies | +5.8% | Global with G-20 leadership | Medium term (2-4 years) |
| Upsurge in cannabis-infused edibles & beverages | +2.3% | Early adoption in North America & Europe | Short term (≤2 years) |
| Pharmaceutical-grade indoor vertical farming capacity build-out | +3.7% | Global technology hubs | Long term (≥4 years) |
| Source: Mordor Intelligence | |||
Favourable Reimbursement Policies & Expanding Insurance Pilots
Mandated reimbursement in New Mexico and workers’ compensation precedents in Pennsylvania reduce out-of-pocket costs for eligible patients. Schedule III reclassification proposals remove federal barriers to Medicare and Medicaid coverage, potentially unlocking access for 65 million U.S. beneficiaries currently paying USD 300–400 monthly. Canadian provincial programs illustrate fiscal feasibility, while two-thirds of Medicare recipients voice support for coverage expansion. Producers holding EU-GMP certification gain pricing power as insurers demand validated quality standards, placing commoditized raw-flower suppliers at a disadvantage.
Rising Clinical-Trial Pipeline Targeting Chronic Pain & Oncology
Vertanical’s VER-01 enrolled over 1,000 chronic low-back-pain patients and demonstrated opioid-replacement potential without dependency. Randomized oncology studies now report 24% complete response for chemotherapy-induced nausea versus 8% on placebo. Academic centers apply biomarker analysis and psychophysical testing to define mechanisms of action, enhancing dossier quality for regulatory approval. Pharmaceutical sponsors amass robust IP portfolios around standardized extracts, accelerating future new-drug-application filings[1]Pat Anson, “Experimental Cannabis Extract Has Potential to Replace Opiates,” Pain News Network, painnewsnetwork.org.
Increasing Legalisation Across G-20 Economies
Germany’s Cannabis Act lifted its patient base to 900,000 within 13 months, driving 2024 sales to EUR 450 million. Legislative advances in France, Spain, and Australia expand the European and Asia-Pacific addressable patient pools. Harmonized quality requirements enable multinational firms to replicate production and pharmacovigilance protocols across borders, while smaller operators without compliance resources face exit pressures.
Upsurge In Cannabis-Infused Edibles & Beverages
Regulatory sandboxes in Germany permit pilot launches of edible formats featuring controlled dosing, attracting CPG and beverage conglomerates. Clinical work on edible cannabis for chronic low-back pain links higher THC doses with superior relief and reduced muscle tension. However, delayed onset and inconsistent absorption require stricter labeling and time-to-effect guidance. Tobacco majors discreetly test market entry, signaling demand for smoke-free delivery alternatives.
Restraints Impact Analysis*
| Restraint | (~) % Impact on CAGR Forecast | Geographic Relevance | Impact Timeline |
|---|---|---|---|
| Persisting social stigma in conservative jurisdictions | -2.8% | Rural and conservative regions worldwide | Long term (≥4 years) |
| Banking & capital-market restrictions in federally-illegal regions | -3.4% | United States | Medium term (2-4 years) |
| IP litigation risk around novel extraction technologies | -1.9% | Global tech hubs | Short term (≤2 years) |
| Source: Mordor Intelligence | |||
Persisting Social Stigma In Conservative Jurisdictions
Physician hesitancy lingers where education on dosing and pharmacology is scarce, with Greek doctors citing regulatory ambiguity and Malaysian pharmacists noting low patient disclosure. Surveys show 27.8% of U.S. users never mention cannabis consumption to care teams, fearing judgment. Long-term-care facilities struggle with protocol gaps, and stigma dampens economies of scale by deterring investment in regions with tepid acceptance. Outreach programs and CME modules aim to close knowledge deficits[2]Daniel D. King, “The Role of Stigma in Cannabis Use Disclosure,” Harm Reduction Journal, biomedcentral.com.
Banking & Capital-Market Restrictions In Federally-Illegal Regions
Most U.S. multi-state operators depend on a narrow set of regional banks due to federal Schedule I conflicts. The SAFER Banking Act would grant safe-harbor protections, yet legislative uncertainty keeps large lenders sidelined. Cash-heavy operations elevate security costs and depress margins, while tight credit terms limit expansion capital. Firms operating in federally legal markets gain lower cost of capital and M&A optionality unavailable to U.S. peers[3]Jessica Huang, “What Would Passage of the SAFER Banking Act Mean in 2024?” Reuters, reuters.com.
*Our forecasts treat driver/restraint impacts as directional, not additive. The impact forecasts reflect baseline growth, mix effects, and variable interactions.
Segment Analysis
By Formulation Type: Oils Dominate Through Precision Dosing
Oils captured 41.88% revenue in 2025, reflecting clinician comfort with titratable liquid formats and patient preference for dose accuracy. The medical marijuana market favors oils because EU-GMP extraction standards deliver consistent cannabinoid profiles that satisfy insurer quality audits. Segment leaders deploy closed-loop CO₂ extraction and chromatographic refinement to eliminate solvents, differentiating on pharmaceutical-grade purity. Topicals and transdermal gels expand at 19.62% CAGR, propelled by demand for localized relief and non-psychoactive user experiences. Brands invest in permeation-enhancement excipients and nano-emulsion technologies that shorten onset times. Small-batch tincture producers face cost pressures as scale economies tilt toward vertically integrated oil platforms.
Wider adoption of methyl-jasmonate protocols boosts cannabinoid density in biomass dedicated to oil production, reducing grams-per-dose costs. Consumer surveys show oils outperform flower in treatment adherence for chronic pain due to ease of administration. Health-system formularies increasingly list standardized oil SKUs, reinforcing segment resilience. Meanwhile, topical developers target dermatology and sports-injury clinics, capitalizing on strict THC thresholds acceptable in conservative settings. Innovation in transdermal patches offers zero-first-pass metabolism and extended release, challenging oral dominance in postoperative care.



By Cannabinoid Composition: CBD Dominance Faces THC Renaissance
CBD-dominant offerings commanded 49.05% revenue in 2025 on the back of favorable regulation and non-intoxicating profiles suitable for pediatric and geriatric cohorts. Balanced THC:CBD ratios gain momentum where synergy delivers superior analgesia without pronounced euphoria, particularly in oncology supportive care. THC-dominant medicines surge at 21.12% CAGR as Phase 3 trials prove greater efficacy for neuropathic pain and appetite stimulation, prompting formularies to reconsider historical THC ceilings.
Japan enforces the strictest THC limits globally, forcing suppliers to segment R&D pipelines between ultra-low-THC markets and jurisdictions accepting higher ratios. Fibromyalgia studies demonstrate 35% opioid reduction when THC-rich extracts supplement standard analgesics, spurring guideline updates in several U.S. states. IP filings around minor cannabinoids such as CBG and THCV indicate future diversification beyond current CBD/THC dichotomy, yet regulatory prioritization remains on establishing consistent THC compliance frameworks.
By Route of Administration: Oral Delivery Leads Digital Integration
Oral products generated 45.11% of sales in 2025, benefiting from familiar tablet and capsule formats that fit existing prescription workflows. The medical marijuana market integrates telemedicine platforms that allow physicians to monitor oral dosing regimens remotely, generating real-world evidence to refine titration. Sublingual sprays and strips post 18.94% CAGR due to rapid bioavailability matching acute symptom scenarios. Inhalation retains niche usage among legacy patients despite pulmonary safety critiques, whereas topical creams expand in dermatology clinics.
Digital therapeutics pair oral prescriptions with symptom-tracking apps that feed anonymized datasets into ongoing post-marketing studies. Hospital systems prefer oral SKUs for formulary inclusion because controlled dosage units align with medication-administration-record protocols. Rising sublingual adoption prompts investment in muco-adhesive polymer research to extend dwelling time, while vaporizers pivot toward dose-metered cartridges to satisfy clinician oversight requirements.
By Application: Chronic Pain Leadership Faces Neurological Disruption
Chronic pain interventions delivered 38.41% revenue in 2025 as evidence-based guidelines shift away from high-dose opioids. Comparative-effectiveness research credits cannabis with a 2.6 odds-ratio advantage versus standard analgesics, bolstering payer coverage arguments. Neurological disorders exhibit 18.06% CAGR through 2031, catalyzed by encouraging data in epilepsy, multiple sclerosis, and Parkinson’s non-motor symptoms. Migraine and arthritis maintain steady uptake through established patient education campaigns.
Phase 2 studies on essential tremor employing THC:CBD sprays inform dosing algorithms for neurodegenerative cohorts. Open-label trials reveal 87% of Parkinson’s participants experience reduced non-motor symptom burden, with 56% tapering opioid co-therapy. Synthetic analog nabilone demonstrates long-term safety for Parkinson’s sleep disturbance, hinting at future expansion into other movement disorders. Healthcare provider familiarity with cannabinoid neuromodulation grows as neurologists co-author treatment protocols initially pioneered in pain medicine.
By Distribution Channel: Retail Dispensaries Lead Online Acceleration
Retail dispensaries controlled 55.94% revenue in 2025, providing in-person counseling that mitigates stigma and enhances compliance. Many incorporate pharmacist-led consultation bays that bridge traditional healthcare and emerging cannabis therapeutics. Online platforms grow at 19.98% CAGR, leveraging e-prescription uploads and discreet fulfilment that appeals to patients in conservative locales. The medical marijuana market aligns telehealth consultation software with e-commerce storefronts, compressing time from diagnosis to product receipt.
Dispensary operators partner with entertainment venues to promote wellness-themed product lines, broadening consumer touchpoints beyond clinical settings. Conversely, hospital pharmacies reserve cannabis SKUs for oncology wards and pain clinics under controlled-substance protocols. Rapid online growth pressures regulators to harmonize interstate fulfillment rules, particularly in Europe where single-market directives shape cross-border shipping.
Geography Analysis
North America, contributing 42.35% of 2025 revenue, benefits from mature cultivation infrastructure and extensive clinical-research networks. Federal rescheduling debates accelerate institutional interest, while Canadian federal legality continues to attract cross-border capital. Fragmented U.S. state regulations impede interstate commerce, yet localized specialization sustains diverse supply chains serving varied patient demographics. Mexico’s regulatory rollout adds regional growth but faces implementation lags due to licensing backlogs and training demands.
Europe advances convergence around pharmaceutical-grade standards, with Germany’s patient base soaring from 250,000 to 900,000 in 13 months. Reimbursement inclusion under public sickness funds accelerates uptake, compelling suppliers to meet stringent stability and impurity thresholds. France and Spain pursue legalization bills that could double the region’s patient pool, while Netherlands leverages decades-old research heritage to supply clinical trials across the bloc. Scandinavian health systems pilot cannabinoid therapies for neuropathic pain, sharing outcome data through EU-wide registries.
Asia–Pacific posts a 19.04% CAGR forecast to 2031. Japan’s 2024 reforms introduce pharmaceutical licensing, catalyzing partnerships between domestic drug makers and Australian cultivators. Australia’s revenue trajectory indicates capacity to outpace top European markets as patient onboarding simplifies and local cultivation offsets import costs. Thailand supplies regional raw material under GMP guidelines, whereas South Korea restricts access to import-only orphan-drug cases. Cross-border academic collaborations produce foundational trials that set dosing baselines for broader commercial launches.

Regulatory Landscape
Regulation continues to split between pharmaceutical-style medical frameworks and broader adult-use reforms. For operators, compliance anchors are increasingly tied to medicinal-product standards alongside controlled-substance rules. In the United States, the Department of Justice/DEA published a final order in April 2026 that moves qualifying, FDA-approved marijuana products and certain state-licensed medical marijuana activities into Schedule III of the Controlled Substances Act. The order also includes an expedited federal registration pathway for compliant entities, and a DEA hearing is scheduled to begin June 29, 2026 to evaluate broader changes to marijuana status. This linkage between federal registration, controlled-substance handling, and medical claims pushes operators serving clinical channels to strengthen documentation, recordkeeping, and quality controls.
In Europe, Germany's April 2024 Medizinal-Cannabisgesetz (MedCanG) marked a structural shift by removing cannabis from the Narcotics Act (BtMG) and treating it as a prescription medicinal product. That change accelerates patient access and standardizes prescribing pathways. Follow-on adjustments in June 2024 further clarified prescribing and curtailed certain telemedical prescribing practices for cannabis flowers, with enforcement focus shifting toward appropriate indications and oversight. Across the EU, companies supplying reimbursed markets increasingly align quality systems to EU-GMP expectations and pharmacovigilance requirements to maintain access to public payers and hospital dispensing routes.
Competitive Landscape
The medical marijuana market exhibits moderate fragmentation with nascent consolidation. Legacy cannabis brands hold cultivation expertise, yet pharmaceutical entrants like Jazz Pharmaceuticals and AbbVie progress through FDA pathways that could reconfigure value pools. Three U.S. pharmacy benefit managers oversee 79% of prescription claims, positioning them as future gatekeepers once federal rescheduling permits pharmacy distribution.
Tilray Brands operates EU-GMP facilities in Portugal and Germany, serving over 100,000 patients across five continents and maintaining top positions in Canada and Germany. Urban-gro secures multi-state design-build contracts that embed precision agriculture in new facilities, while white-space opportunities persist in neurological formulations and Asia–Pacific expansion.
High IP activity surrounds extraction and minor-cannabinoid synthesis, prompting defensive patent clustering. M&A volume contracts amid macroeconomic tightness, shifting emphasis to licensing and joint ventures that share risk without large cash outlays. Banking constraints in the U.S. continue to deter institutional capital, yet SAFER Banking prospects lift sentiment and could unlock cheaper debt for multi-state operators.
Medical Marijuana Industry Leaders
Aurora Cannabis
Jazz Pharmaceuticals, Inc.
Canopy Growth Corporation
Acreage Holdings
Tilray Brands, Inc.
- *Disclaimer: Major Players sorted in no particular order

Market Opportunities and Future Outlook
The most visible whitespace in medical cannabis access is the move toward prescription-first pathways supported by clinical evidence and standardized quality. The April 2026 US DOJ/DEA action placing qualifying marijuana products and certain state-licensed medical marijuana activity into Schedule III formalizes a more pharmaceutical-facing operating model, widening room for compliant manufacturing, documentation, and partnerships that resemble conventional controlled-substance supply. At the same time, Europe is still building country-specific market playbooks, with Spains Royal Decree 903/2025 creating a framework for first-mover registrations, such as Curaleaf registering CAN-1 and CAN-2 in July 2026. That timing supports entry into hospital and specialist prescribing routes where traceability and defined dosage forms matter.
Innovation is also clustering around adherence-friendly formats and managed patient journeys rather than commoditized flower. Tilray Brands acquisition of HelloMD in June 2026 highlights this direction by integrating telemedicine, patient onboarding, and repeat prescribing within regulated medical programs, supporting growth in online and hybrid distribution models. Clinical and IP differentiation is expanding the medical-use set beyond chronic pain, with pipeline and trial activity reinforcing specialist adoption and payer engagement in neurology and oncology-supportive care.
Recent Industry Developments
- May 2026: Canopy Growth, through Spectrum Therapeutics, expanded its medical portfolio with additional softgel pack sizes (including 30- and 90-count options) and enhanced dosing choices. The update supports more consistent titration and refill behavior, aligning medical cannabis formats with conventional pharmacy dispensing and adherence needs.
- April 2026: Aurora Cannabis announced the acquisition of Safari Flower Company, an EU-GMP certified cultivator and manufacturer, to expand pharmaceutical-grade production capacity for international medical markets. The move reinforces supply reliability and compliance positioning in higher-margin jurisdictions that gate access through EU-GMP and medicinal-product documentation.
- April 2025: Cresco Labs opened a 25,000-sq-ft medical facility in Kentucky with 2,000-lb monthly capacity targeting PTSD and addiction treatment. The build-out adds regulated production scale in a new geography and strengthens in-state medical supply as operators prepare for stricter quality and documentation requirements.


Research Methodology Framework and Report Scope
Market Definition and Coverage
For this methodology, the medical marijuana market covers legally supplied cannabis flower and basic cannabis extracts that are used under a medical recommendation or prescription to help manage symptoms and medical conditions.
Scope exclusions: Adult-use or recreational cannabis purchases, non-medical wellness consumption, and illegal trade are excluded from the market totals.
Segmentation Overview
- By Formulation Type
- Capsules
- Oils
- Tinctures & Drops
- Topicals & Transdermal Gels
- By Cannabinoid Composition
- THC-dominant
- CBD-dominant
- Balanced THC:CBD
- By Route of Administration
- Oral
- Inhalation (Smoking & Vaping)
- Sublingual
- Topical / Transdermal
- By Application
- Chronic Pain
- Arthritis
- Migraine
- Cancer-related Symptoms
- Neurological Disorders
- Others
- By Distribution Channel
- Hospital Pharmacies
- Retail Dispensaries
- Online Platforms
- Geography
- North America
- United States
- Canada
- Mexico
- Europe
- Germany
- United Kingdom
- France
- Italy
- Spain
- Rest of Europe
- Asia-Pacific
- China
- Japan
- India
- South Korea
- Australia
- Rest of Asia-Pacific
- Middle East and Africa
- GCC
- South Africa
- Rest of Middle East and Africa
- South America
- Brazil
- Argentina
- Rest of South America
- North America
Data Sources, Market Sizing, and Validation
Desk Research
Desk work starts by mapping what is legally available for medical use by country or state, since local rules determine what can be sold, prescribed, and reimbursed. We typically rely on public sources such as national health agencies and medicines regulators, government gazettes for program updates, and official statistics portals that report healthcare and pharmacy trends.
To keep volumes and value assumptions realistic, we also review sources such as customs and trade statistics where applicable, peer reviewed medical journals on patient use and dosing ranges, and official law enforcement or public safety publications that help flag diversion risks and compliance changes. Company annual reports, investor presentations, and credible press are used to understand product mix shifts, distribution channel changes, and price direction. Where needed, paid subscriptions are used for company financials and intelligence, patent databases, and shipment-level import export checks. These examples are not exhaustive, and other public and paid sources were also used for data collection, validation, and clarification.
Primary Interviews and Surveys
Primary inputs were collected through expert interviews and structured surveys across key legal markets in the Americas, EMEA, and APAC. Coverage included cultivation and processing, medical prescribing influences, pharmacy and dispensary dispensing, and patient access dynamics. We used respondent input to confirm which product formats are actually purchased for medical use, how pricing changes by formulation and cannabinoid profile, and which policy changes are most likely to move demand in the next few years.
Distribution of primary research fieldwork respondents
| Company type | Respondent position | Region |
|---|---|---|
| Top tier: 31% | CXOs: 14% | APAC: 46% |
| Mid tier: 48% | Functional/Unit leaders: 34% | EMEA: 36% |
| Smaller Players: 21% | Managers: 52% | Americas: 18% |
Market-Sizing & Forecasting
Sizing is built using a mix of top-down and bottom-up approaches. The top-down approach starts from the eligible patient pool under medical programs, which is then converted into demand using treatment adoption, average consumption patterns by route of administration, and observed price ranges by product form.
To keep the model grounded, we cross-check totals with selective bottom-up approximations, such as supplier and channel roll-ups from sampled markets, checks on cultivation and extraction capacity utilization, and sampled average selling price times estimated medical volumes by product type. Where data is missing for smaller markets, we apply conservative proxy assumptions from similar regulatory setups and then adjust them after expert validation.
Key inputs used include the number of active medical patients, program coverage and qualifying condition changes, share of oral versus inhalation use, mix of flower versus oils and capsules, average THC and CBD product positioning that affects price, and pharmacy versus dispensary channel split. Forecasts are developed using scenario analysis around policy timing and access expansion, with assumptions reviewed by primary respondents so the final growth path stays practical rather than purely trend-based.
Data Validation & Update Cycle
Validation is done by checking the final market value against independent signals, including patient counts, observed price corridors, and timing of regulatory milestones, then reviewing any large variances market by market. When outliers appear, we revisit underlying adoption and pricing assumptions, and we re-contact sources when a policy change or supply shock could materially alter the result.
Before sign-off, the model and outputs go through multi-step analyst reviews, where calculations are replicated and key drivers are stress-tested for reasonableness. The report is refreshed annually, with interim updates when material events occur, and a final pre-delivery pass is completed so clients receive the most current view available.
Mordor Intelligence's Medical Marijuana Market Size Versus Other Published Estimates
Published market sizes for medical marijuana can look far apart due to uneven regulation across countries and due to different choices around what counts as medical demand and the year treated as the current baseline. Currency timing, whether prices are taken at retail versus a wholesale equivalent, and how quickly new medical programs are assumed to scale can also change the final number.
The largest gaps usually come from scope and counting rules. Some estimates include synthetic cannabinoid drugs, broader cannabis wellness products, or adult-use sales routed through similar channels, which can inflate totals even when the label says medical. Other differences come from how patient adoption is converted into grams or oil equivalents, how price compression is modeled after legalization milestones, and whether the estimate was updated after recent policy and reimbursement changes. Here, recreational sales and non-medical wellness are not counted, and the market is built from program-eligible patient demand with route and formulation mix checks, which explains the spread you see versus other figures, a modeling choice applied by Mordor Intelligence.
Benchmark comparison
| Source | Market Size | Gaps in Research Methodology |
|---|---|---|
| Mordor Intelligence | USD 28.38 B (2026) | |
| Industry Publisher A | USD 25.55 B (2024) | Uses an earlier base year and a different product grouping that can mix medical formats with adjacent cannabis types, and the long-range forecast is less explicit about how price compression is handled after policy shifts. |
| Advisory Firm B | USD 27.81 B (2025) | Includes a broader treatment of medical cannabis that can count synthetic cannabinoid drugs alongside plant-based products, which changes the included revenue pool even when the end-use is medical. |
The table shows that year choice and what is counted as medical revenue are the two biggest reasons for divergence. By keeping scope rules explicit and tying demand to observable patient access signals and price corridors, the sizing stays easier to trace and repeat when the market is updated.


Key Questions Answered in the Report
What is the current size of the medical marijuana market?
The market is valued at USD 28.38 billion in 2026 and is projected to reach USD 58.75 billion by 2031.
Which region dominates revenue today?
North America leads with 42.35% of global sales, supported by mature regulations and extensive clinical research.
What therapeutic area is expanding fastest?
Neurological disorders show an 18.06% CAGR through 2031, driven by epilepsy and Parkinson’s studies.
Which formulation type holds the largest share?
Oils account for 41.88% of 2025 revenue due to precise dosing and EU-GMP compliance.
How quickly are online sales channels growing?
Online platforms are advancing at a 19.98% CAGR, propelled by telemedicine and discreet fulfillment models.
Will insurance coverage become widespread?
Legislative changes such as Schedule III reclassification and state mandates indicate broader reimbursement adoption over the next two to four years.
Page last updated on:





