Market Overview
| Study Period | 2020 - 2031 |
|---|---|
| Market Size (2026) | USD 9.45 Billion |
| Market Size (2031) | USD 13.90 Billion |
| Growth Rate (2026 - 2031) | 8.02% CAGR |
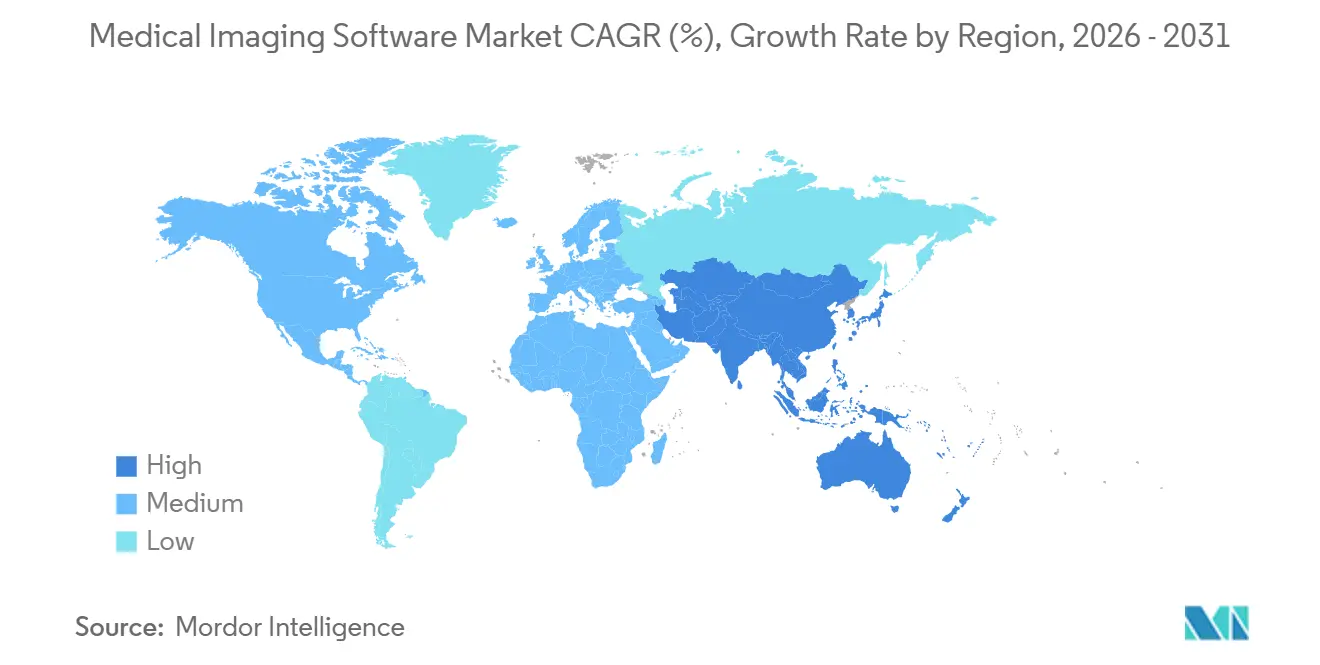
| Fastest Growing Market | Asia Pacific |
| Largest Market | North America |
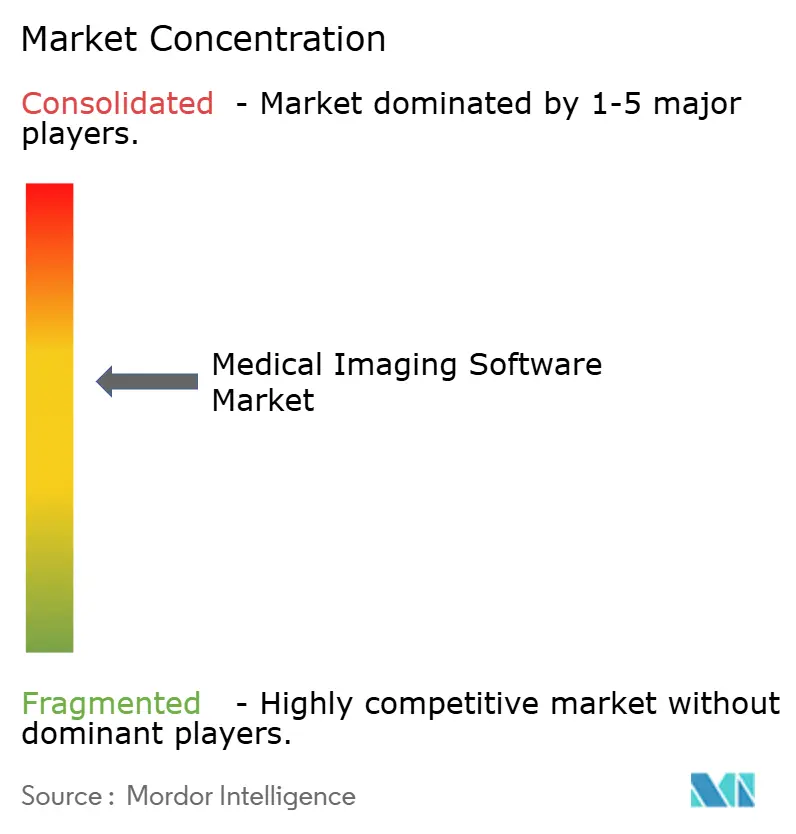
| Market Concentration | Medium |
Major Players*Disclaimer: Major Players sorted in no particular order Image © Mordor Intelligence. Reuse requires attribution under CC BY 4.0. | |
Medical Imaging Software Market Analysis by Mordor Intelligence
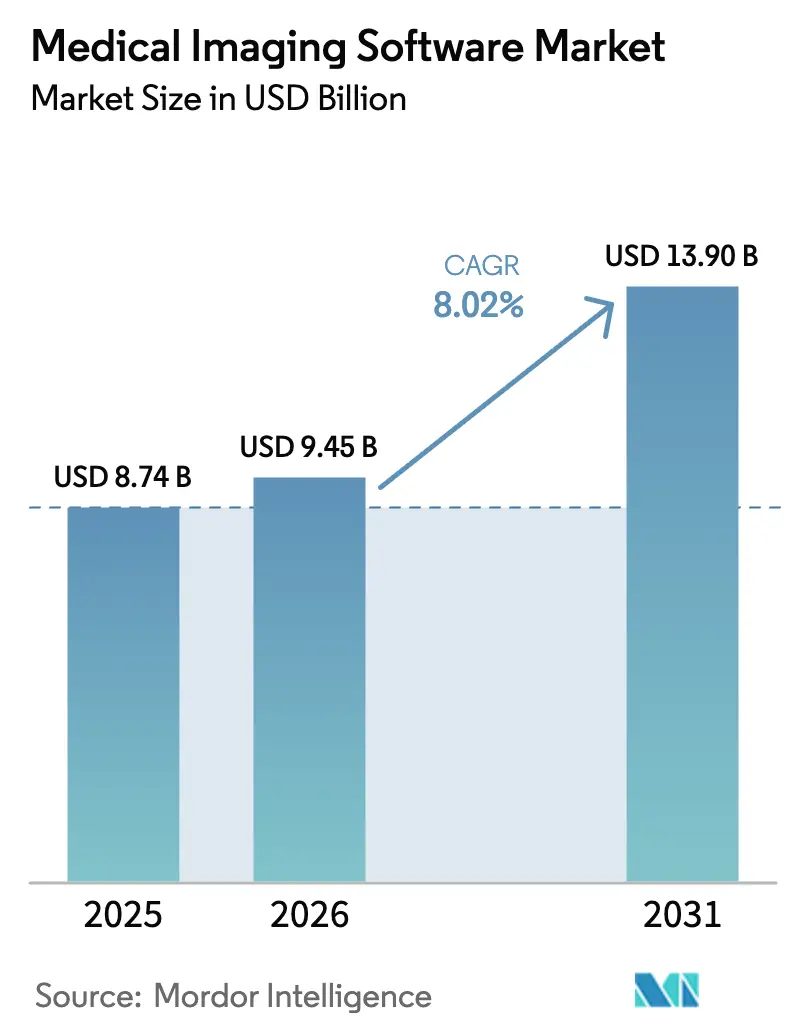
The Medical Imaging Software Market size is projected to expand from USD 8.74 billion in 2025 and USD 9.45 billion in 2026 to USD 13.90 billion by 2031, registering a CAGR of 8.02% between 2026 to 2031.
Strong reimbursement tailwinds, rapid FDA clearance of AI-enabled devices, and cloud-first modernizations are moving software from a capital afterthought to a core diagnostic asset. Hardware vendors are embedding inference engines at the console level, while pure-play developers monetize per-study transactions that scale with the volume of imaging. Providers are consolidating multi-site picture archiving systems into cloud vendor-neutral archives to cut storage refresh costs and unlock enterprise-wide analytics. In parallel, federated learning is letting algorithms train on dispersed data without breaching privacy law, trimming model bias, and broadening clinical generalizability. Cybersecurity breaches and staff shortages remain drag factors, yet the combined effect of regulatory clarity and AI-driven productivity keeps the medical imaging software market on a structural growth path.
Key Report Takeaways
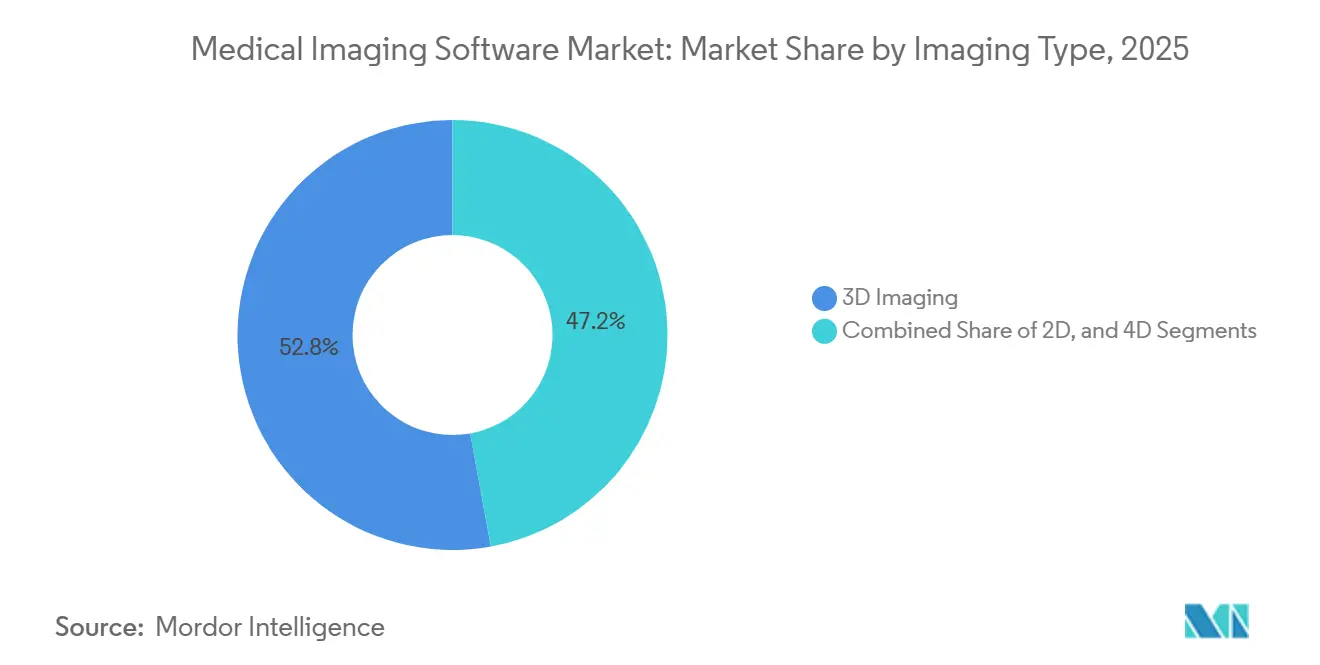
- By imaging type, 3D visualization led with 52.84% of medical imaging software market share in 2025, while 4D workflows are forecast to expand at a 9.11% CAGR through 2031.
- By modality, computed tomography accounted for 31.85% of the medical imaging software market size in 2025; PET and SPECT software is advancing at an 8.43% CAGR to 2031.
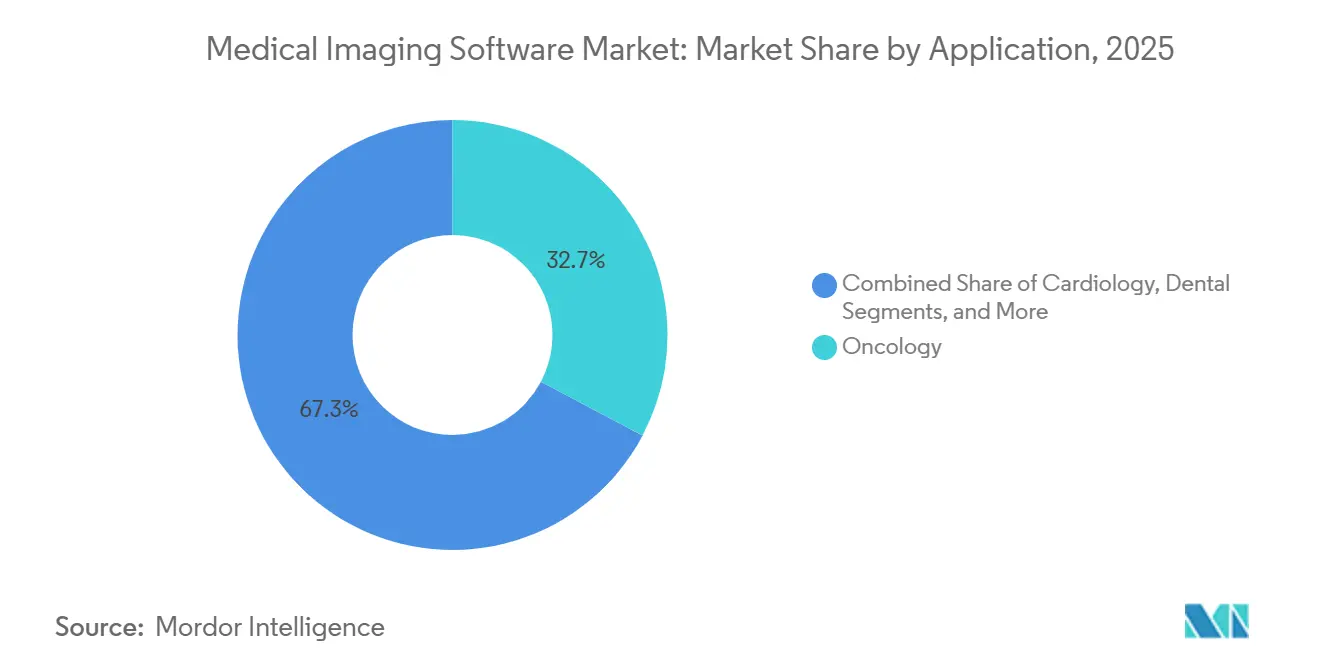
- By application, oncology captured 32.74% share of the medical imaging software market size in 2025 and is maintaining an 8.45% CAGR through 2031.
- By deployment model, on-premise systems held 68.62% of installations in 2025 of medical imaging software market, whereas cloud platforms exhibit a 9.23% CAGR to 2031.
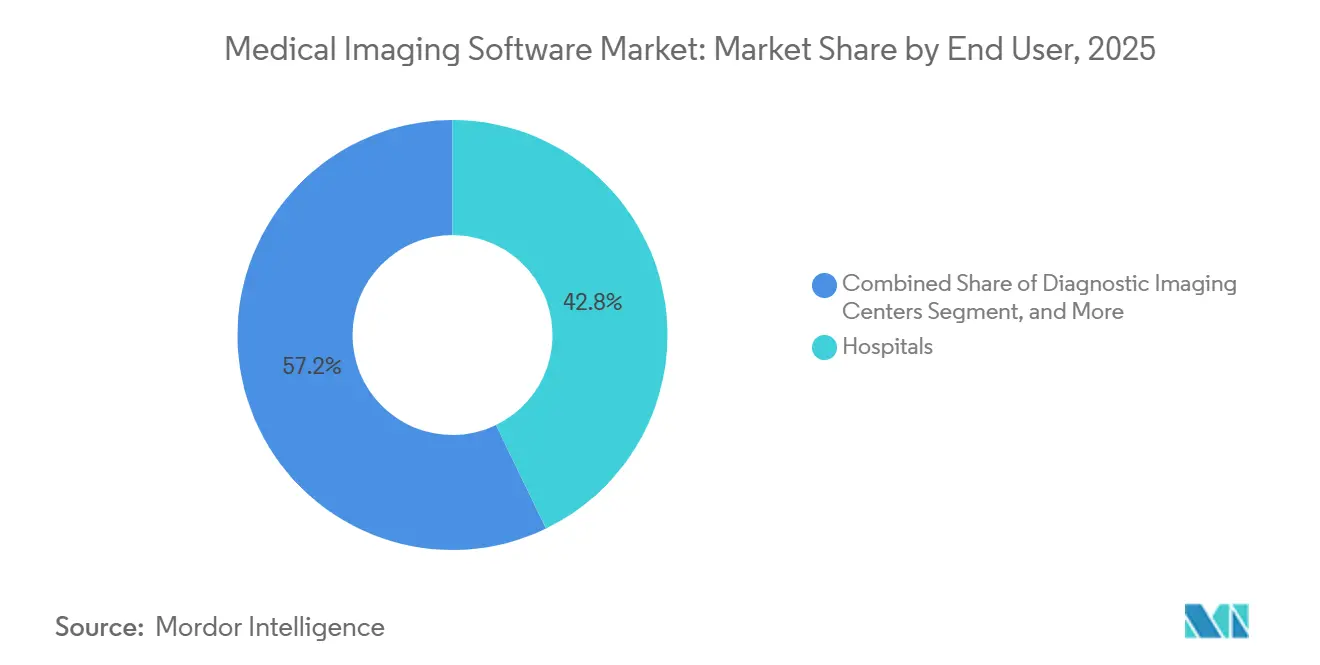
- By end user, hospitals represented 42.84% of demand in 2025 of medical imaging software market, but diagnostic imaging centers post the quickest rise at an 8.76% CAGR.
- By geography, North America commanded 35.62% revenue in 2025 of medical imaging software market, whereas Asia-Pacific is pacing ahead at an 8.67% CAGR over the forecast period.
Note: Market size and forecast figures in this report are generated using Mordor Intelligence’s proprietary estimation framework, updated with the latest available data and insights as of January 2026.
Global Medical Imaging Software Market Trends and Insights
Drivers Impact Analysis*
| Driver | (~) % Impact on CAGR Forecast | Geographic Relevance | Impact Timeline |
|---|---|---|---|
| Growing Adoption of AI-Powered Diagnostic Tools | +2.1% | Global, strongest in North America and Europe | Short term (≤ 2 years) |
| Increasing Chronic Disease Burden Requiring Advanced Imaging | +1.8% | Global, acute in Europe, North America, Japan | Long term (≥ 4 years) |
| Rapid Shift Toward 3D and 4D Visualization Workflows | +1.3% | North America, Europe, Asia-Pacific cities | Medium term (2-4 years) |
| Expansion of Cloud-Enabled Enterprise Imaging Platforms | +1.5% | North America and Europe, Asia-Pacific accelerating | Medium term (2-4 years) |
| Emergence of Federated Learning to Unlock Multi-Institutional Datasets | +0.7% | Europe and North America | Long term (≥ 4 years) |
| Increasing Use of Synthetic Data for Regulatory-Grade Validation | +0.6% | Early adopters in North America and Europe | Long term (≥ 4 years) |
| Source: Mordor Intelligence | |||
Growing Adoption of AI-Powered Diagnostic Tools
Regulators have moved from cautious gatekeepers to active enablers: the FDA cleared 171 AI-enabled devices in 2024, nearly doubling 2023 activity, and over half of them target radiology. Predicate-based 510(k) filings reduced review cycles from 18 months to under six, allowing vendors to achieve quicker revenue realization. Qure.ai’s qER suite demonstrates its commercial impact, flagging intracranial bleeds within 90 seconds and enabling rural emergency teams to bypass local radiologist queues. Hospitals are incorporating such algorithms into PACS worklists, so that critical studies surface first, turning AI usage into a per-scan fee generator rather than a fixed license sale. Consolidation is intensifying, as Tempus has absorbed Arterys to fuse genomics with imaging biomarkers and capture precision-oncology budgets. As payers issue separate CPT codes for AI-assisted reads, the revenue flywheel tightens further around algorithm performance and breadth.
Increasing Chronic Disease Burden Requiring Advanced Imaging
An aging world pushes imaging volumes beyond radiologist capacity. Adults aged 65 and above will comprise 21.6% of the U.S. population by 2040 and will consume over three times the number of imaging studies as younger cohorts. The United Kingdom saw CT and MRI usage increase by 12% annually from 2019 to 2024, driven by expanded cancer screening mandates. Software now automates repetitive quantification tasks, such as those used by Siemens Healthineers’ syngo.Via Frontier slashed cardiac chamber segmentation from 20 minutes to 90 seconds, freeing physicians for interpretive tasks.[2]Siemens Healthineers, “syngo.via Frontier Advanced Visualization Solutions,” siemens-healthineers.com Oncology underscores the throughput imperative, immunotherapy regimens require serial scans, multiplying image load per patient and enlarging the addressable software pool. By automating measurements, vendors translate demographic pressure into sustained demand, thereby reinforcing the market's trajectory for medical imaging software.
Rapid Shift Toward 3D and 4D Visualization Workflows
Photorealistic volume rendering left research labs and entered routine surgery planning once Siemens introduced cinematic CT imagery that reproduces lighting and shadow cues surgeons recognize in theater. Studies in orthopedic settings report 18% fewer intra-operative plan changes when such 3D models guide intervention. Moving from 3D to 4D adds the time dimension, GE HealthCare’s 4D ultrasound tracks fetal heart motion at 120 frames per second, enabling earlier diagnosis of congenital defects with higher sensitivity. Dataset sizes soar up to twentyfold, tilting preference toward scalable cloud storage. Subscription pricing aligns costs to actual utilization, making advanced visualization accessible to mid-tier centers and further widening adoption.
Expansion of Cloud-Enabled Enterprise Imaging Platforms
Cloud deployments crossed a tipping point as Philips’ IntelliSpace Enterprise Cloud eliminated seven-year on-premise storage refresh cycles that once ran USD 0.5-2 million per site.[3]Philips, “Philips Launches IntelliSpace Enterprise Cloud Edition,” philips.com GE HealthCare’s Edison Health Cloud trimmed customer IT labor by 40% by shifting patching and disaster recovery duties to the vendor. Elastic GPU provisioning lets hospitals spin up AI inference overnight without capital budgets. FDA guidance issued in 2024 clarified that cloud software vendors, not providers, bear cyber-security responsibility, easing legal concerns. Together, cost certainty, performance, and compliance accelerate the medical imaging software market toward cloud-native standards.
Restraints Impact Analysis*
| Restraint | (~) % Impact on CAGR Forecast | Geographic Relevance | Impact Timeline |
|---|---|---|---|
| High Software Licensing and Maintenance Costs | -1.2% | Global, acute in Asia-Pacific and South America | Short term (≤ 2 years) |
| Shortage of Trained Imaging-Informatics Professionals | -0.9% | Global, notable in North America and Europe | Medium term (2-4 years) |
| Cyber-Security Threats Targeting PACS and VNA Ecosystems | -0.6% | Global, highest breach count in North America | Short term (≤ 2 years) |
| Algorithmic Bias Concerns Hindering AI Approvals | -0.5% | North America and Europe | Long term (≥ 4 years) |
| Source: Mordor Intelligence | |||
High Software Licensing and Maintenance Costs
Enterprise PACS licenses range from USD 300,000 to USD 1.5 million, with annual support fees near 20% of the purchase price, straining mid-sized centers operating on single-digit margins. Cloud subscriptions only equalize outlays after seven years of steady volume growth, according to HFMA modeling. Migration away from an incumbent PACS can cost another USD 200,000-500,000 in interface rebuilds and staff retraining, locking buyers into long depreciation cycles. Price-sensitive Asian markets respond by adopting open-source stacks like Orthanc, which erase license fees but demand in-house expertise, a trade favored by large public hospitals but beyond reach for smaller private clinics. The resulting sticker shock slows refresh decisions and clips near-term medical imaging software market expansion.
Shortage of Trained Imaging-Informatics Professionals
Only 800 individuals hold North America’s Certified Imaging Informatics Professional credential against an estimated need of 2,500, leaving hospitals short of talent to integrate AI modules into legacy systems. An ACR survey revealed that 62% of institutions that purchased algorithms in 2024 had not activated them one year later, primarily due to IT staff being unavailable to map DICOM routing or implement EHR single sign-on. Compensation inflation, median informaticist pay reached USD 145,000 in 2025, pushing budgets higher and prompting outsourcing to managed service providers, which introduces new vendor lock-in dynamics. Without human expertise, software sits idle, a latent drag on the medical imaging software market until workforce pipelines widen.
*Our forecasts treat driver/restraint impacts as directional, not additive. The impact forecasts reflect baseline growth, mix effects, and variable interactions.
Segment Analysis
By Imaging Type: 4D Captures Dynamic Physiology
3D visualization commanded 52.84% of 2025 revenue, underpinning pre-operative planning across orthopedic, neuro, and maxillofacial specialties, while 4D workflows are set to grow at a 9.11% CAGR by capturing temporal cardiac and fetal motion. This evolution scales dataset weights ten-fold, testing on-premise storage but slotting neatly into cloud archives that tier cold data to low-cost object storage after 90 days. Clinical evidence strengthens the shift: respiratory-gated 4D CT narrows tumor treatment margins and reduces collateral tissue damage. Although 2D remains vital for high-throughput screenings, most vendors now ship universal viewers that read 2D, 3D, and 4D files through a single interface, limiting willingness to pay for stand-alone 2D licenses. Overall, robust upgrade incentives keep the medical imaging software market accelerating inside visualization suites.
The toolkit transition increases bandwidth requirements and pushes hospitals toward edge caching or direct-to-cloud ingestion, modernizing network fabrics as part of platform overhauls. FDA guidance now requires separate clearances when 4D functions introduce fresh clinical claims, slowing startup roadmaps but creating defensible moats for incumbents with regulatory capital. As subscription pricing spreads, providers match costs with volumes, making 4D modules less risky to trial. That flexibility feeds long-run adoption and reinforces the medical imaging software industry’s shift to real-time imaging.


By Modality: PET and SPECT Accelerate with Quantitative Biomarkers
Computed tomography software held 31.85% of 2025 spend thanks to CT’s ubiquity in trauma and emergency pathways, yet PET and SPECT platforms are advancing at an 8.43% CAGR through 2031. Oncology departments want quantitative biomarkers to monitor immunotherapy and adjust dosing without repeat biopsies. SubtlePET, now part of Bracco Imaging, halves patient radiation by enabling low-dose protocols while preserving diagnostic utility, letting centers scan more patients from the same radiotracer batch. MRI developments focus on synthetic reconstruction that trims exam times by more than half, sustaining upgrade waves among high-volume outpatient centers.
Ultrasound and X-ray modules remain commodity offerings unless layered with triage AI that flags life-threatening findings within minutes. Sectra’s modality-agnostic viewer bundles CT, MRI, and ultrasound into one license, curbing IT complexity and supporting cross-disciplinary collaboration. Modalities once walled off by proprietary workstations are collapsing into holistic platforms, redefining competitive battlegrounds across the medical imaging software market.
By Application: Oncology Leads Software Monetization
Oncology maintained 32.74% share in 2025 and continues to post an 8.45% CAGR as tumor burden measurement shifts from hand-drawn diameters to automated volume and radiomics extraction. FDA-cleared platforms from Tempus standardize segmentation, giving oncologists consistent metrics across longitudinal scans while freeing technologists from tedious contours. Cardiology’s ascent rests on per-patient functional reads enabled during visits; automated myocardial strain reporting can appear on the workstation before the cardiologist leaves the exam room, tightening care loops.
Neuro stroke triage and orthopedic surgical planning fill mid-tier growth lanes, while fetal anomaly detection rounds out high-throughput obstetrics use. Dental, mammography, and urology remain smaller sub-segments but collectively supply recurring revenue streams that diversify vendor portfolios. Application breadth is fast becoming a proxy for platform stickiness in the medical imaging software market.
By Deployment Model: Hybrid Cloud Finds the Middle Ground
On-premise deployments still captured 68.62% of 2025 installations but cloud systems clock a 9.23% CAGR, lifted by multi-site consolidation pressures and elastic compute benefits. Yet pure cloud can suffer latency in rural areas, so hybrid blueprints cache recent studies locally and sync to cloud archives for long-term retention. HFMA cost modeling shows break-even after seven years under 5% annual volume growth, a calculus increasingly favorable as scan counts climb. FDA guidance placing cyber-security on the vendor side relieved provider risk concerns and nudged purchase committees toward service-based contracts.
Capital freedom matters as inflation eats hardware budgets; operational spending spreads costs over time and aligns with volume changes. Vendors now pitch edge nodes bundled with cloud subscriptions, letting buyers transition incrementally and keeping the medical imaging software market accessible to organizations of all sizes.
By End User: Diagnostic Imaging Centers Embrace Remote Reads
Hospitals drove 42.84% of 2025 revenue, but independent imaging centers are rising fastest at an 8.76% CAGR as care shifts outpatient. These centers prize zero-footprint viewers enabling teleradiology staffing models that lower labor expenses up to one-third. Subscription imaging memberships, where consumers pay monthly for unlimited scans, experiment with cash-pay populations and circumvent payer complexity.
Academic and research institutes lean into federated learning frameworks to train AI on diverse cohorts without data pooling, reinforcing equity objectives and spawning data-for-algorithm access swaps. Ambulatory surgery centers add intraoperative imaging that integrates directly with navigation systems, generating demand for lightweight PACS that live inside procedure rooms. Each segment’s nuanced requirements create tiered product opportunities that collectively fuel the medical imaging software market size across care settings.
Geography Analysis
North America preserved 35.62% revenue share in 2025, powered by Medicare CPT codes that reimburse AI-assisted reads and elevate software to a billable line item. FDA clearance velocity converts regulatory friction into adoption fuel, and integrated delivery networks invest in proprietary platforms to lock in cost savings. Canada’s provinces enforce HL7 FHIR interfaces, steering buyers toward vendors with mature interoperability toolkits, while Mexico’s public hospitals direct limited budgets to modality hardware first.
Asia-Pacific is the pace car, growing at an 8.67% CAGR. China’s Healthy China 2030 project earmarked CNY 50 billion (USD 7 billion) in 2024 for AI-ready imaging networks, giving domestic suppliers like United Imaging a protected runway. India’s Ayushman Bharat Digital Mission connects 150,000 facilities to a national exchange, and new telemedicine rules permit cross-state radiology reads, catalyzing a unified teleradiology market. Japan’s super-aged demographic makes real-time triage AI indispensable as emergency departments strain under stroke caseloads. South Korea issued the region’s first reimbursement code for AI lung-nodule detection, signalling payer willingness to recognize software value.
Europe grapples with GDPR and the forthcoming AI Act. Vendors must evidence demographic fairness and avoid cross-border data transfers, so federated learning is baseline architecture rather than an innovation. The U.K.’s NHS saw CT and MRI volumes climb 12% annually through 2024, stretching consultant capacity. Germany demands disclosure of training-dataset demographics, delaying market entry for opaque models. France standardized 200 public hospitals on Sectra’s enterprise PACS, proving that national-scale rollouts can proceed once procurement hurdles clear.
South America contends with currency volatility such as Brazil and Argentina lean on open-source PACS to dodge exchange swings, limiting near-term commercial opportunity. Middle Eastern programs, notably Saudi Arabia’s Vision 2030, allocate USD 2.5 billion to health IT, positioning cloud PACS as the backbone of tertiary expansion. In Africa, South African private networks and Nigerian teaching hospitals pioneer teleradiology links that bridge urban-rural care gaps but remain early-stage contributors to overall medical imaging software market revenue.

Regulatory Landscape
Medical imaging software is regulated primarily as software as a medical device, with increasing specificity for AI-enabled functions. In the United States, the FDA finalized guidance in December 2024 on Predetermined Change Control Plans (PCCP) for AI-enabled device software functions, and in June 2026 issued a final order codifying radiological machine learning-based quantitative imaging software with PCCP as a Class II device with special controls (21 CFR 892.2055). These actions clarify pathways for iterative model updates while keeping clinical performance and cybersecurity requirements under FDA oversight.
In Europe, compliance is anchored in the Medical Device Regulation (MDR, Regulation (EU) 2017/745) for classification and conformity assessment of medical software, with additional governance and documentation demands emerging from the EU AI Act (Regulation (EU) 2024/1689) for high-risk AI systems. China is tightening full life-cycle oversight through the NMPA, including Announcement No. 63 (July 2025) to optimize regulation of high-end medical devices that include AI imaging and processing software, alongside the YY/T 1833.5-2024 standard (implemented October 2025) covering quality requirements and evaluation methods for pre-trained models used in AI-based medical devices.
Value Chain Analysis
The value chain spans data acquisition at modalities (CT, MRI, ultrasound, X-ray, PET/SPECT), image transport and interoperability layers (DICOM and integration into RIS/EHR), core imaging platforms (PACS, VNA, and enterprise viewers), and clinical AI applications (triage, quantification, and reporting support). Hardware-led vendors (GE HealthCare, Siemens Healthineers, Philips, Canon) increasingly package software with systems and console-level capabilities, while vendor-neutral providers (e.g., Sectra, Agfa-Gevaert, Carestream) compete on multi-vendor integration, workflow breadth, and enterprise consolidation. Cloud infrastructure and GPU provisioning have become critical upstream inputs for modern deployments, shifting recurring value toward hosting, cybersecurity, and managed services.
The main bottlenecks sit at integration and compliance points: deploying algorithms inside clinical workflows often requires scarce imaging-informatics resources, plus validation and documentation to satisfy FDA, EU MDR, and country-specific rules. Supply-chain volatility in imaging hardware can indirectly influence software refresh timing because PACS and enterprise imaging upgrades are frequently bundled with modality replacement cycles. Trade frictions and export controls (including China-announced limits in April 2025 on certain rare earth elements used in imaging supply chains) also add procurement uncertainty, which can delay capital projects and push buyers toward software-first, vendor-neutral, and cloud migration programs that decouple some upgrades from on-site hardware timelines.
Competitive Landscape
Market control is moderately consolidated. GE HealthCare, Siemens Healthineers, and Philips bundle software with modalities and together hold most of the revenue. Vendor-neutral challengers, such as Sectra, Agfa-Gevaert, and Carestream, court multi-vendor fleets by untying PACS from hardware purchases, often winning on the basis of interoperability speed. Platform scope eclipses isolated features; buyers favor stacks offering stroke triage, lung nodule detection, and cardiac quantification out of the box, avoiding costly one-off integrations.
Technology race lines center on cloud-native cores and edge inference. GE’s Edison Health Cloud delivers managed infrastructure and elastic GPU services, trimming customer IT staffing by 40%. Siemens embeds AI on the scanner, so images arrive pre-enhanced, eliminating latency and the need for extra servers. Philips bets on open FHIR APIs to halve project timelines. Siemens Healthineers is embedding AI directly into modality consoles, its SOMATOM X.cite CT scanner performs on-device image reconstruction and enhancement, bypassing third-party software integrations and reducing latency
Disruptors, including Arterys and Nurea, bypass full PACS replacement by slotting narrow algorithms into existing viewers and charging on a per-case basis. Patent filings concentrate in privacy-preserving learning and synthetic data, with NVIDIA submitting 23 related applications in 2024. Competitive pressure thus splits between horizontal platform wars and vertical AI niche plays, each vying for share of the growing medical imaging software market.
Medical Imaging Software Industry Leaders
General Healthcare Company (GE)
Koninklijke Philips N.V.
Canon Medical Systems Corporation
Agfa Gevaert HealthCare
Siemens Healthineers
- *Disclaimer: Major Players sorted in no particular order

Market Opportunities and Future Outlook
Enterprise imaging consolidation and cloud-first modernization create a clear whitespace for platforms that unify PACS, VNA, and embedded AI across multi-site health systems, while reducing on-premise refresh cycles and centralizing security and governance. GE HealthCare completing its acquisition of Intelerad in March 2026 is a concrete indicator of vendor push toward cloud-first, AI-enabled enterprise imaging stacks, and it increases competitive pressure on both traditional PACS vendors and niche AI firms that depend on third-party integrations. At the same time, hospitals and imaging centers are operationalizing per-study monetization models for AI and advanced visualization, aligning spend with imaging volumes and making broad algorithm catalogs more actionable than single-feature tools.
Unifying workflows inside clinical systems is also a tangible opportunity area, particularly where imaging review, diagnostics, and native AI can be accessed within the EHR context. The FDA 510(k) clearance for CliniComp's PACS Viewer as a Medical Image Management and Processing System (MIMPS) in July 2026 highlights continued regulatory acceptance for imaging software that bridges diagnostic imaging and enterprise health records, supporting purchasing motions around fewer interfaces and fewer integrations. Regulatory and compliance changes also shape near-term priorities. With the FDA Quality Management System Regulation (QMSR) effective in 2026 and the EU moving forward on infrastructure requirements such as EUDAMED core modules (mandatory application in May 2026), vendors that productize documentation, UDI-ready workflows, and controlled AI update processes can reduce buyer implementation burden and improve multi-country deployment readiness.
Recent Industry Developments
- July 2026: CliniComp received FDA 510(k) clearance for its PACS Viewer as a Medical Image Management and Processing System (MIMPS) to support diagnostic imaging access within its New Era EHR platform. The clearance reinforces EHR-embedded imaging as a competitive direction, reducing reliance on separate viewers and lowering workflow friction for enterprise deployments.
- September 2025: Philips debuted IntelliSpace Enterprise Cloud Edition, positioning a vendor-neutral archive that shifts storage economics from periodic capital refresh cycles to operating expense models. The launch supports multi-site consolidation programs and strengthens the company's cloud portfolio against enterprise imaging platform competitors.
- February 2024: Siemens Healthineers introduced Magnetom Flow, a 1.5T MRI platform using Dry Cool technology that reduces liquid helium requirements to 0.7 liters. Lower infrastructure complexity and operating constraints can expand scanner siting options, influencing downstream software demand as imaging volumes grow in settings that previously faced installation barriers.


Research Methodology Framework and Report Scope
Market Definition and Coverage
This market covers software used to create, view, process, store, and share medical images in clinical and research settings. It includes imaging software used across major modalities and image types, and it is sized as revenue generated from these software offerings.
Scope exclusions: Imaging hardware and general hospital IT systems that do not directly support imaging workflows are not counted.
Segmentation Overview
- By Imaging Type
- 2D Imaging
- 3D Imaging
- 4D Imaging
- By Modality
- Computed Tomography
- Magnetic Resonance Imaging
- X-Ray
- Ultrasound
- PET and SPECT
- Other Modalities
- By Application
- Orthopedic
- Oncology
- Cardiology
- Neurology
- Dental
- Obstetrics and Gynecology
- Mammography
- Urology and Nephrology
- By Deployment Model
- On-Premise
- Cloud-Based
- Hybrid
- By End User
- Hospitals
- Diagnostic Imaging Centers
- Ambulatory Surgical Centers
- Research and Academic Institutes
- Other End Users
- By Geography
- North America
- United States
- Canada
- Mexico
- South America
- Brazil
- Argentina
- Rest of South America
- Europe
- United Kingdom
- Germany
- France
- Italy
- Spain
- Rest of Europe
- Asia-Pacific
- China
- Japan
- India
- South Korea
- Australia and New Zealand
- Rest of Asia Pacific
- Middle East and Africa
- Middle East
- Saudi Arabia
- United Arab Emirates
- Turkey
- Rest of Middle East
- Africa
- South Africa
- Nigeria
- Rest of Africa
- Middle East
- North America
Data Sources, Market Sizing, and Validation
Desk Research
We start by building the demand picture using public and official sources that reflect imaging volumes and health system capacity. Sources such as the US FDA databases, the US Centers for Medicare and Medicaid Services, the OECD health statistics, World Health Organization datasets, and radiology society publications help anchor procedure trends and technology adoption, and they can be cross-checked against other public datasets.
Next, the market math is supported with company filings, investor presentations, reputable press coverage, and product documentation that clarifies which functions are sold as imaging software versus adjacent IT. For patchy private-company disclosure, a paid company financials and intelligence subscription and a patent database are used to sanity-check product focus and likely revenue scale. The desk sources listed here are illustrative only, and other public and paid references are reviewed during data collection and validation.
Primary Interviews and Surveys
Primary work is used to pressure-test assumptions that are hard to read from public data, like software pricing patterns, cloud migration timing, and how often modules are bundled into enterprise deals. We interview and survey a spread of software providers, channel partners, and hospital and imaging-center users across the Americas, EMEA, and APAC, so regional reimbursement dynamics, procurement timelines, and usage intensity show up in the final model.
Distribution of primary research fieldwork respondents
| Company type | Respondent position | Region |
|---|---|---|
| Top tier: 25% | CXOs: 16% | APAC: 48% |
| Mid tier: 58% | Functional/Unit leaders: 38% | EMEA: 29% |
| Smaller Players: 17% | Managers: 46% | Americas: 23% |
Market-Sizing & Forecasting
Sizing is built using a top-down demand pool approach where imaging procedure volumes and installed scanner capacity are used to estimate likely software consumption by care setting, and then converted into value using typical software mix and pricing ranges. Once that structure is in place, results are corroborated with selective bottom-up approximations, such as sampled vendor revenue roll-ups, channel checks on enterprise contract sizes, and ASP and volume checks by modality. Those comparisons are then used to adjust totals when the gap looks systematic.
Key inputs in the model include imaging procedure growth by modality, the shift from on-premise to cloud-based deployments, average annual license and subscription pricing, the share of facilities using advanced visualization and 3D or 4D imaging workflows, and replacement and upgrade cycles linked to PACS and related platform refreshes. Forecasts are taken forward using scenario analysis, where adoption speed and pricing progression are varied around a base case aligned to what primary respondents expect for procurement cycles and budget priorities. When bottom-up data is missing for smaller countries or smaller facility types, gaps are handled using proxies like hospital counts, imaging center density, and per-capita imaging intensity before being rechecked against regional totals.
Data Validation & Update Cycle
We run multi-step checks so the totals do not rely on a single source or a single assumption. Model outputs are compared with independent signals such as procedure trends, software deployment shares, and reported growth commentary, and then anomalies are reviewed by another analyst before sign-off.
If large variances show up by region or by deployment mode, we re-contact selected respondents to clarify whether the difference is real or driven by scope, pricing timing, or currency treatment. Reports are refreshed annually, with interim updates when material events occur, and a final pre-delivery review is completed so clients receive the most current view available at the time of publication.
Mordor Intelligence's Medical Imaging Software Market Market Size Versus Other Published Estimates
Published market sizes for medical imaging software often vary even when the topic looks similar on the surface. Differences usually come from what is counted as software, how bundled enterprise deals are treated, and whether the year and currency timing match the same base period.
The main gap comes from scope mixing, where Mordor Intelligence counts only medical imaging software revenue tied to imaging workflows, while some published figures also include broader radiology IT modules or related services that are priced and procured differently. A second driver is how cloud subscriptions are annualized, since some estimates use booked contract value while others use recognized revenue, which can move the same customer spend across years.
Benchmark comparison
| Source | Market Size | Gaps in Research Methodology |
|---|---|---|
| Mordor Intelligence | USD 9.45 B (2026) | |
| Global Consultancy A | USD 8.66 B (2026) | Uses a narrower software-only definition that leans on factory-gate revenue logic and may undercount enterprise viewer and advanced visualization modules when they are bundled into broader platform deals. |
| Industry Publisher B | USD 8.39 B (2026) | Mixes modality-led segmentation with a different inclusion set (often folding radiology information systems and AI modules into the core), and applies alternate pricing progression and currency timing that shifts subscription value across years. |
Across the three values, most of the spread is explained by what gets included in the software scope and how recurring revenue is timed, rather than a disagreement on imaging demand itself. When the scope is kept consistent and the pricing and subscription timing are stated clearly, the market size becomes easier to trace back to repeatable inputs like procedure volumes, deployment mix, and contract structures.


Key Questions Answered in the Report
How large is the medical imaging software market in 2026?
It stands at USD 9.45 billion and is forecast to reach USD 13.9 billion by 2031 at an 8.02% CAGR.
What imaging type is growing fastest?
4D visualization, used in cardiac and fetal applications, is expanding at a 9.11% CAGR through 2031.
Why are cloud platforms gaining traction in imaging?
Hospitals cut 40% of IT labor and avoid USD 0.5-2 million storage refreshes by shifting PACS to managed clouds.
Which region shows the highest growth momentum?
Asia-Pacific leads with an 8.67% CAGR, driven by large-scale digital health mandates in China and India.
How are AI algorithms monetized by vendors?
Many suppliers charge per-study transaction fees, aligning revenue with imaging volumes and easing capital barriers.
Page last updated on:


