Medical Carts Market Size and Share
Market Overview
| Study Period | 2020 - 2031 |
|---|---|
| Market Size (2026) | USD 4.19 Billion |
| Market Size (2031) | USD 7.41 Billion |
| Growth Rate (2026 - 2031) | 12.05% CAGR |
| Fastest Growing Market | Asia Pacific |
| Largest Market | North America |
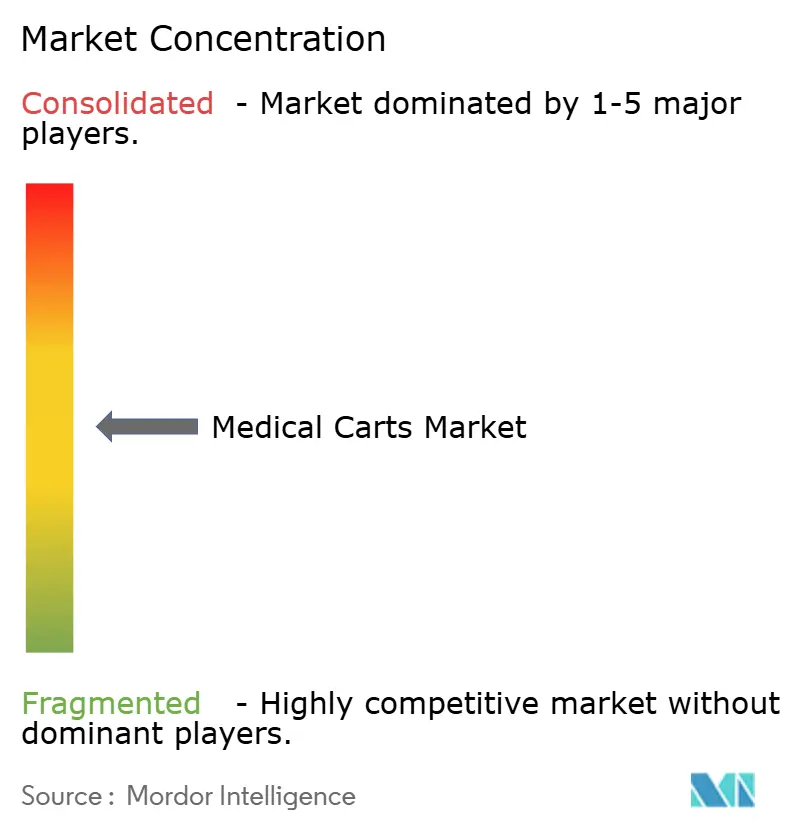
| Market Concentration | Medium |
Major Players *Disclaimer: Major Players sorted in no particular order Image © Mordor Intelligence. Reuse requires attribution under CC BY 4.0. | |
Medical Carts Market Analysis by Mordor Intelligence
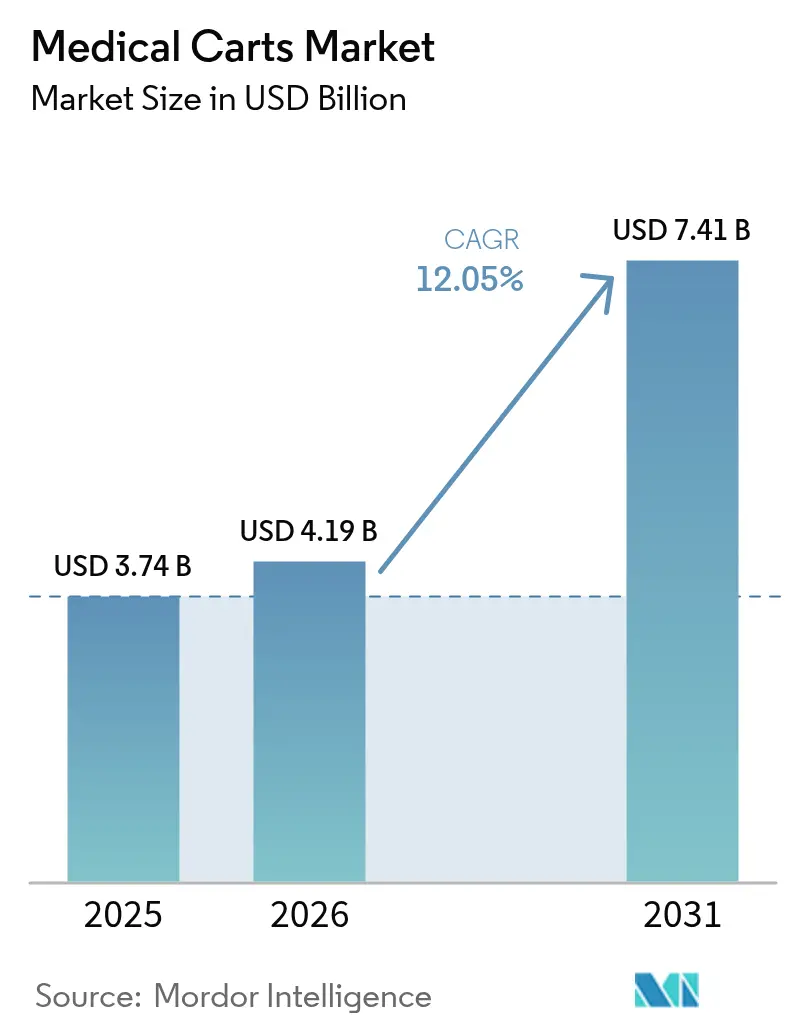
The medical carts market size is expected to grow from USD 3.74 billion in 2025 to USD 4.19 billion in 2026 and is forecast to reach USD 7.41 billion by 2031 at 12.05% CAGR over 2026-2031. Demand growth is anchored in the rapid digital overhaul of clinical workflows, where mobile workstations have become indispensable touchpoints for electronic health record access and bedside decision-making. Capital spending patterns favor platforms that cut staff hand-offs, improve medication traceability and safeguard infection control, positioning the medical carts market as a pivotal enabler of value-based reimbursement models. Emergency response, point-of-care documentation and hybrid telemedicine all elevate procurement urgency as health systems look to blunt workforce shortages, while regulatory shifts—such as EU Battery Regulation 2023/1542 and the forthcoming FDA Quality Management System Regulation—raise the technical bar for next-generation carts. Against this backdrop, the medical carts market is also under competitive pressure to embed cybersecurity layers that limit the 82% IoT-related attack incidence now reported across provider networks.
Key Report Takeaways
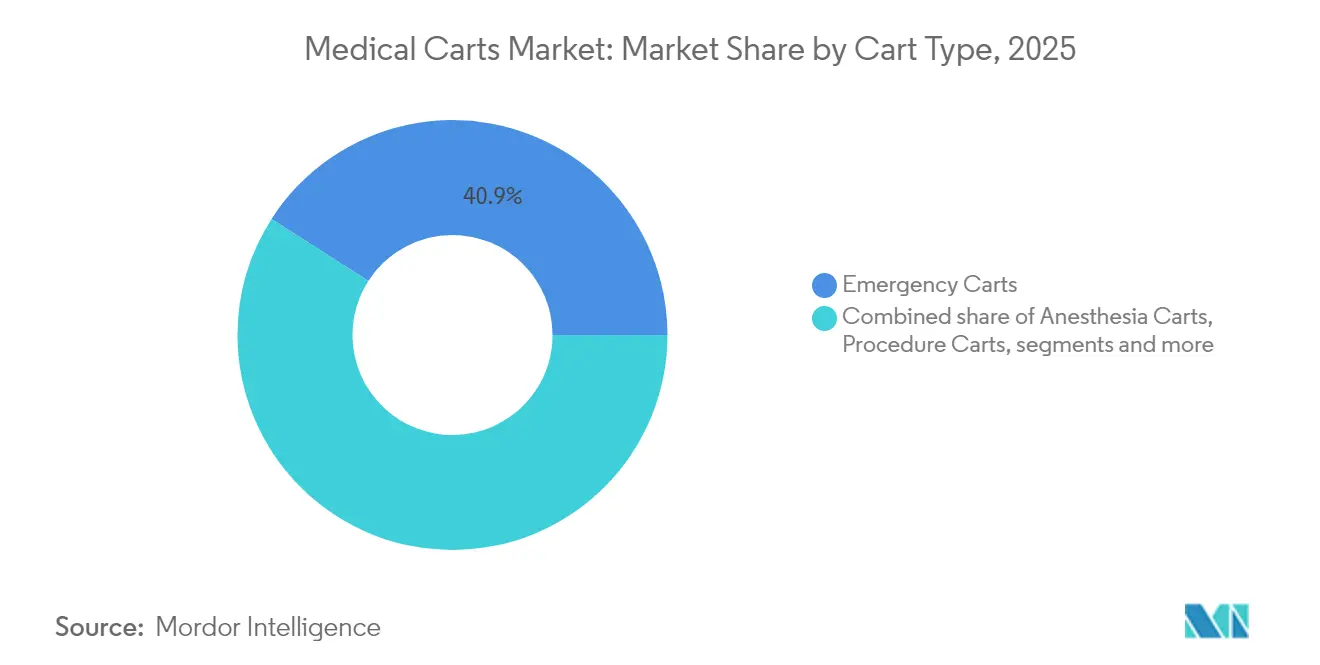
- By cart type, emergency carts led with 40.92% of the medical carts market share in 2025; workstations-on-wheels are expanding the fastest at a 14.15% CAGR through 2031.
- By power source, non-powered formats accounted for 52.63% of the medical carts market size in 2025, while powered variants are growing at a 13.05% CAGR to 2031.
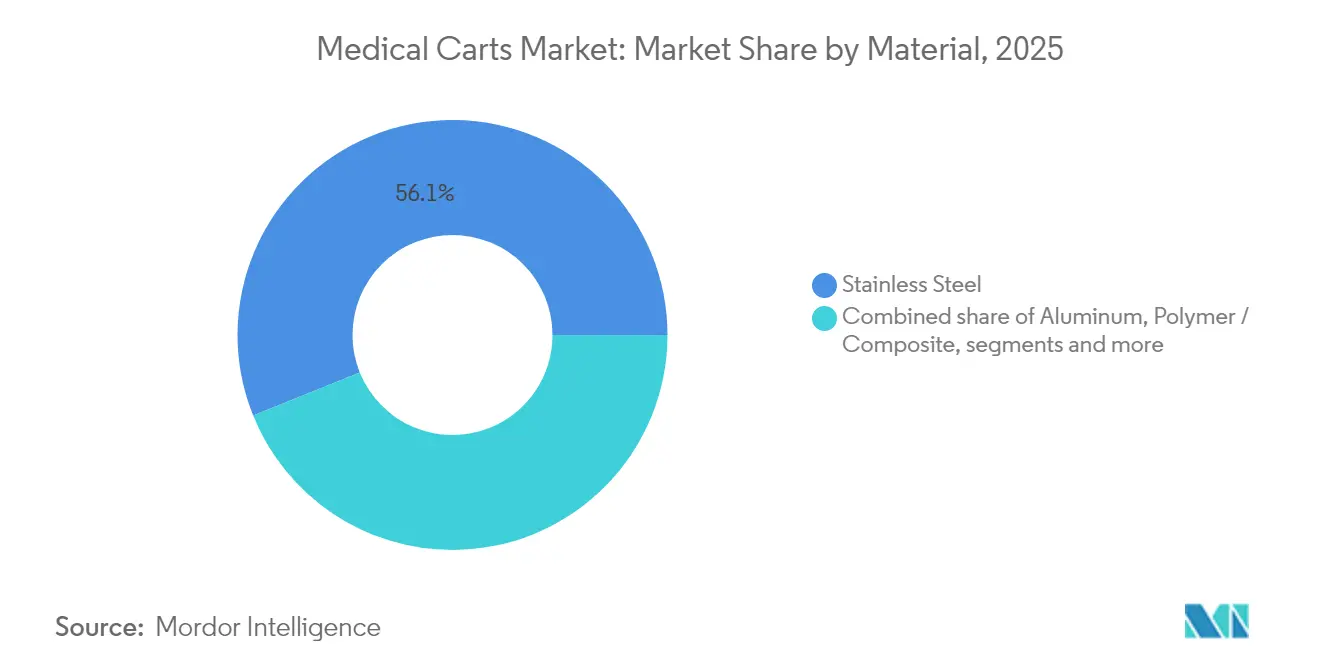
- By material, stainless steel held 56.11% revenue share in 2025; polymer and composite solutions are set to post a 13.29% CAGR through 2031.
- By end user, hospitals commanded 52.21% of the medical carts market in 2025; ambulatory surgical centers show the fastest CAGR at 13.89% to 2031.
- By geography North America maintained 42.74% regional share in 2025; Asia-Pacific is on track for the quickest advance at a 14.92% CAGR to 2031.
Note: Market size and forecast figures in this report are generated using Mordor Intelligence’s proprietary estimation framework, updated with the latest available data and insights as of 2026.
Global Medical Carts Market Trends and Insights
Drivers Impact Analysis*
| Driver | (~) % Impact on CAGR Forecast | Geographic Relevance | Impact Timeline |
|---|---|---|---|
| Rising investments in healthcare infrastructure & value-based care | +3.2% | North America & Europe lead | Medium term (2-4 years) |
| Growing chronic disease burden & emergency visits | +2.8% | Highest in developed markets | Long term (≥ 4 years) |
| EMR/EHR adoption fuels workstations-on-wheels | +2.1% | North America & Europe; APAC accelerating | Short term (≤ 2 years) |
| Tele-medicine carts for hybrid care models | +1.9% | Early adoption in urban centers worldwide | Medium term (2-4 years) |
| 24-hr lithium-ion power modules | +1.4% | Premium uptake in developed markets | Short term (≤ 2 years) |
| Antimicrobial-surface mandates post-COVID-19 | +0.9% | Strongest in North America & Europe | Short term (≤ 2 years) |
| Source: Mordor Intelligence | |||


Rising investments in healthcare infrastructure & value-based care
Hospital operating margins rely increasingly on real-time data capture that mobile workstations provide, making the medical carts market a priority line item for capital committees. Integrated carts now ship with RFID, bar-code scanning and automated medication drawers to shorten documentation time, allow track-and-trace audits and curb adverse drug events. Health systems in the United States, Canada and Germany report that bedside EHR input lowers transcription errors by up to 55%, while enabling time-and-motion savings equivalent to two full nursing shifts per week. Infrastructure grant programs in the European Union further stimulate bulk tenders that blend hardware, fleet-management software and multi-year service contracts.
Growing chronic disease burden & emergency visits among ageing populations
Emergency departments treat escalating volumes of cardiac, diabetic and respiratory cases, intensifying demand for rugged emergency carts stocked with defibrillators, infusion pumps and airway kits. Staffing shortages heighten the need for ergonomic layouts that let one clinician complete formerly two-person tasks, reinforcing spend on carts with auto-lift columns and 270-degree drawer access. In the United States alone, ED arrivals from patients aged ≥ 65 grew 6.4% year-over-year in 2024, a trend mirrored in Japan and Italy. Advanced crash carts now integrate point-of-care testing modules for lactate or troponin, trimming lab turnaround by 20 minutes on average.
EMR/EHR adoption drives Workstations-on-Wheels (WoWs)
Mandatory electronic charting timelines oblige clinicians to log observations in real time, spurring hospitals to deploy WoWs that link securely to core HIT systems. Battery-assisted units support dual 24-inch monitors, speech-recognition dictation and embedded AI triage aides, allowing physicians to complete rounds 18% faster than tablet-only alternatives. Encryption modules certified to FIPS 140-2 are now standard as CIOs tighten network hardening protocols. Device makers also market “hot-swap” power trays that swap in under 15 seconds, keeping carts online for shifts that stretch beyond 12 hours.
Surge in tele-medicine carts for hybrid care models
Pay-for-performance contracts reward virtual consult completion rates, prompting investments in tele-medicine carts outfitted with HD cameras, digital stethoscopes and otoscopes. Deployment of 39 Visionflex carts across Northern Queensland aged-care facilities widened specialist reach by 35% while cutting patient transfer costs, showcasing rapid ROI.[1]Healthcare IT News Staff, “Australian Aged-Care Homes Roll Out Visionflex Telehealth Carts,” healthcareitnews.com Urban centers in Singapore, Seoul and Dubai report similar success as 5G backbones eliminate latency issues that once hampered remote auscultation.
Restraints Impact Analysis*
| Restraint | (~) % Impact on CAGR Forecast | Geographic Relevance | Impact Timeline |
|---|---|---|---|
| Limited skilled operators for advanced carts | -1.8% | Acute in developing markets | Medium term (2-4 years) |
| High capital & maintenance outlay | -1.5% | Chiefly in LMICs | Long term (≥ 4 years) |
| Cyber-security concerns over connected carts | -1.2% | Heightened in regulated markets | Short term (≤ 2 years) |
| Lithium-cell supply-chain bottlenecks | -0.9% | Manufacturing hub concentration in Asia | Medium term (2-4 years) |
| Source: Mordor Intelligence | |||
Limited skilled operators for advanced carts
Complicated user interfaces on AI-enabled carts require formal upskilling that many rural or under-funded facilities cannot afford, leading to underutilization of premium features. Surveys in Thailand and Vietnam found that only 43% of clinical staff felt confident calibrating multi-parameter docking modules, resulting in delayed adoption schedules and extended ROI horizons. Manufacturers now bundle e-learning platforms and augmented-reality tutorials, reducing onboarding time by up to 40% yet raising total solution price.
Cyber-security concerns over connected carts
Threat actors increasingly probe medical carts as network entry points; ransomware attacks on two Mid-Atlantic hospital groups in 2024 exploited deprecated wireless protocols embedded in older fleets. The FDA issued safety communications urging multilayer authentication, real-time firmware patching and asset-tracking dashboards for mobile workstations.[2]Machan International Product Release, “BAILDIA Smart IoT Medication Trolley Wins Gold,” machangroup.com Providers consequently run lengthy penetration tests before issuing purchase orders, extending procurement cycles and dampening near-term sales velocity, particularly in the United States and Germany.
*Our forecasts treat driver/restraint impacts as directional, not additive. The impact forecasts reflect baseline growth, mix effects, and variable interactions.
Segment Analysis
By Cart Type: Emergency Carts Lead Market Share
Emergency carts captured 40.92% of the medical carts market in 2025. Their dominant footprint stems from regulatory mandates that every critical-care bay and operating suite maintain crash-ready gear within one arm’s reach. Mobile computing workstations-on-wheels, meanwhile, post the highest 14.15% CAGR, illustrating how bedside digital documentation now supersedes fixed terminals for throughput gains. The medical carts market size for workstations is projected to climb from USD 0.98 billion in 2025 to USD 2.17 billion in 2031, buoyed by AI-driven triage tools that require high-processing GPUs. Machan International’s BAILDIA Smart IoT Medication Trolley, made of 99.7% recyclable materials, highlights design shifts toward sustainability and IoT linkage, cutting search cycles for high-alert drugs by 25%.
Demand diversification persists across procedure and medication carts that support routine ward rounds, while specialty tele-medicine carts gain visibility inside geriatric and psychiatric wings. Many providers bundle procurement to secure volume discounts across cart families, an approach that can slice lifecycle costs 12% below piecemeal buying. The medical carts market is thus evolving into a platform play where unified control software and interchangeable accessory rails advance standardization goals.


By Power Source: Non-Powered Carts Dominate Current Market
Non-powered formats held 52.63% of the medical carts market share in 2025, chiefly because they carry lower sticker prices and simpler maintenance regimens. That advantage weakens as lithium-ion chemistry attains >2,000 charge cycles, slashing replacement frequency. Powered units are growing at a 13.05% CAGR and are forecast to top USD 2.86 billion by 2031. The medical carts market size for powered variants equated to USD 1.35 billion in 2025 and is expected to double within five years, a shift further prompted by EU Regulation 2023/1542, which compels safer, recyclable battery modules. Integrated smart chargers now self-throttle to extend battery health, while predictive analytics schedule swap-outs before capacity dips below 80%.
Despite supply-chain hiccups around anode materials, global assemblers maintain dual sourcing in South Korea and Poland, limiting shipment delays to under four weeks in most cases. Providers still favor at-a-glance SOC (state of charge) LEDs and audible prompts that simplify clinical workflows. Over the forecast interval, power efficiency will become a core tender criterion as hospitals chase decarbonization targets aligned with national climate pledges.
By Material: Stainless Steel Maintains Dominance
Stainless steel preserved 56.11% of the medical carts market in 2025, prized for durability, heat resistance and proven compatibility with hospital-grade disinfectants. However, growth gravitates to next-gen polymer and composite frames at 13.29% CAGR as infection-control leaders embrace antimicrobial surfaces validated under ISO 7581:2023 dry-contact protocols. Hospitals pursuing wide-area robot decontamination routines now prefer cart panels that withstand repeated hydrogen-peroxide vapor cycles without pitting.
Aluminum remains relevant for lightweight anesthesia carts, trimming nurse push force by 18% compared with steel. Hybrid material builds—steel chassis with ABS drawer fronts—balance rigidity and design flexibility, allowing color-coding that supports rapid identification of narcotics or pediatric dosing kits. Over the projection window, material choice will intertwine with sustainability metrics as life-cycle assessments become standard in EU tenders.
By End User: Hospitals Dominate Current Demand
Hospitals accounted for 52.21% of medical carts market revenue in 2025, reflecting varied departmental requisites and 24-hour operational profiles. Teaching hospitals install as many as 1.5 carts per acute-care bed to guarantee redundancy during shift overlaps. Ambulatory surgical centers, while smaller, register a 13.89% CAGR, benefiting from outpatient orthopedic and ophthalmology booms. The medical carts market size for ASCs is poised to reach USD 1.19 billion by 2031, propelled by Medicare payment policies that move low-risk procedures outside full-service hospitals.
Specialty clinics focused on dialysis, oncology and cardiology form a stable customer base that values modular drawers pre-configured for disease-specific consumables. Long-term care facilities and home-health providers gain ground as reimbursement codes for remote vitals monitoring enter mainstream usage. Vendors now court these segments with narrow-frame carts that fit elevator thresholds and doorway clearances typical of residential settings.
Geography Analysis
North America commanded 42.74% of 2025 revenue on the strength of mature IT backbones, large-scale EHR mandates and a payer mix that rewards digital efficiency. Federal grants supporting the Rural Emergency Hospital designation further spur purchases of compact tele-treatment carts that link distant specialists via broadband. The region’s medical carts market continues to introduce safeguards such as UL-listed battery assemblies and FIPS-validated encryption modules to satisfy stringent inspection regimes.
Asia-Pacific records the fastest 14.92% CAGR, with China, India and Australia spearheading hospital build-outs that integrate fleet-management dashboards from day one. Public-private initiatives subsidize cart acquisitions equipped with multilingual UI overlays to accommodate diverse clinical workforces. The medical carts market size in Asia-Pacific is projected to exceed USD 2.18 billion by 2031, supported by domestic production clusters in Shenzhen, Pune and Osaka. Europe shows steady replacement cycles as directives on antimicrobial stewardship and carbon footprints drive swap-outs to lightweight composites. Tier-one manufacturers open refurbishing centers in Germany and the Netherlands to capture circular-economy incentives. In the Middle East and Africa, greenfield hospital construction in Saudi Arabia, the United Arab Emirates and Egypt fuels first-time purchases, though supply-chain latency and tariff regimes temper near-term acceleration. South American growth hovers in mid-single digits, led by Brazil where private insurers specify powered WoWs for oncology infusion suites.


Competitive Landscape
In the medical carts industry, major players command a significant share, leading to a focus on robust product rollouts over price competition. Competitors differentiate via proprietary battery diagnostics, antimicrobial nanocoatings and AI-ready GPU docks. Machan International secured visibility through its BAILDIA IoT Medication Trolley recognition in November 2024, highlighting a pivot to sustainability and data analytics at drawer level.
Omnicell’s December 2024 launch of OmniSphere cloud software transformed the fleet from static assets into nodes in a medication-management platform, opening recurring licensing revenues and enabling predictive drug restock algorithms. U.S. incumbents partner with cybersecurity firms to certify firmware to IEC 81001-5-1, a response to rising ransomware episodes. Start-ups focus on SLAM-enabled self-driving carts that transport linens and labs, though penetration remains niche pending OSHA guidance on autonomous devices in patient corridors.
Vertical integration is resurging as OEMs invest in battery pack production in North Carolina and Bavaria, reducing exposure to cobalt supply shocks. Meanwhile, contract manufacturers in Malaysia and Mexico scale polymer-over-injection lines to chase composite cart demand. As regulatory harmonization deepens—particularly with the February 2026 FDA QMSR alignment to ISO 13485—brands that front-load compliance gain bidding advantages, shortening tender evaluation cycles by up to three months.
Medical Carts Industry Leaders
Advantech Co Ltd
ITD GmbH
Capsa Healthcare
AFC Industries Inc
JACO Inc. (GCX Corporation)
- *Disclaimer: Major Players sorted in no particular order

Recent Industry Developments
- January 2025: Northern Queensland Primary Health Network deployed 39 Visionflex carts to extend virtual specialist access across aged-care sites.
- December 2024: Omnicell introduced OmniSphere, a cloud-native engine that orchestrates robotics and smart devices for medication workflows.
- November 2024: Machan International’s BAILDIA Smart IoT Medication Trolley won 2025 Taiwan Excellence Gold for its recyclable build and 25% efficiency uplift.
- March 2024: Ultralife and Karta unveiled a joint medical cart power platform at HIMSS, showcasing hot-swap lithium-iron-phosphate packs for 24-hour uptime.


Global Medical Carts Market Report Scope
As per the report's scope, medical carts are used for medical aid as they simplify processes, such as recording data as EMRs and storing dispensed equipment, supplies, and patient information to achieve better health outcomes at lower costs. They are medical trolleys and workstations comprising compartments, trays, and a set of drawers that help healthcare providers transport and dispense emergency medical supplies and medical devices.
The medical carts market is segmented by cart type and geography. By cart type, the market is segmented into anesthesia carts, emergency carts, procedure carts, and other cart types. The report also covers the market sizes and forecasts in major countries across different regions. For each segment, the market size is provided in terms of value (USD).
| Anesthesia Carts |
| Emergency Carts |
| Procedure Carts |
| Medication Carts |
| Mobile Computing / WoW Carts |
| Other Cart Types |
| Powered Carts |
| Non-Powered Carts |
| Aluminum |
| Stainless Steel |
| Polymer / Composite |
| Others |
| Hospitals |
| Ambulatory Surgical Centers |
| Specialty Clinics |
| Others |
| North America | United States |
| Canada | |
| Mexico | |
| Europe | Germany |
| United Kingdom | |
| France | |
| Italy | |
| Spain | |
| Rest of Europe | |
| Asia-Pacific | China |
| Japan | |
| India | |
| Australia | |
| South Korea | |
| Rest of Asia-Pacific | |
| Middle East and Africa | GCC |
| South Africa | |
| Rest of Middle East and Africa | |
| South America | Brazil |
| Argentina | |
| Rest of South America |
| By Cart Type | Anesthesia Carts | |
| Emergency Carts | ||
| Procedure Carts | ||
| Medication Carts | ||
| Mobile Computing / WoW Carts | ||
| Other Cart Types | ||
| By Power Source | Powered Carts | |
| Non-Powered Carts | ||
| By Material | Aluminum | |
| Stainless Steel | ||
| Polymer / Composite | ||
| Others | ||
| By End User | Hospitals | |
| Ambulatory Surgical Centers | ||
| Specialty Clinics | ||
| Others | ||
| By Geography | North America | United States |
| Canada | ||
| Mexico | ||
| Europe | Germany | |
| United Kingdom | ||
| France | ||
| Italy | ||
| Spain | ||
| Rest of Europe | ||
| Asia-Pacific | China | |
| Japan | ||
| India | ||
| Australia | ||
| South Korea | ||
| Rest of Asia-Pacific | ||
| Middle East and Africa | GCC | |
| South Africa | ||
| Rest of Middle East and Africa | ||
| South America | Brazil | |
| Argentina | ||
| Rest of South America | ||


Key Questions Answered in the Report
What is the current size of the medical carts market?
The medical carts market size stood at USD 4.19 billion in 2026 and is projected to grow to USD 7.41 billion by 2031.
Which cart type generates the highest revenue today?
Emergency carts lead with 40.92% of medical carts market share thanks to mandatory presence in emergency and surgical suites.
Which geographic region is expanding fastest?
Asia-Pacific posts the quickest 14.92% CAGR, underpinned by hospital construction and national digital health programs.
Why are powered carts gaining popularity?
Advances in lithium-ion batteries now provide shift-long uptime, meeting IT demands for continuous EHR access while complying with new EU safety rules.
Page last updated on:


