Sports Media Market Size and Share
Market Overview
| Study Period | 2020 - 2031 |
|---|---|
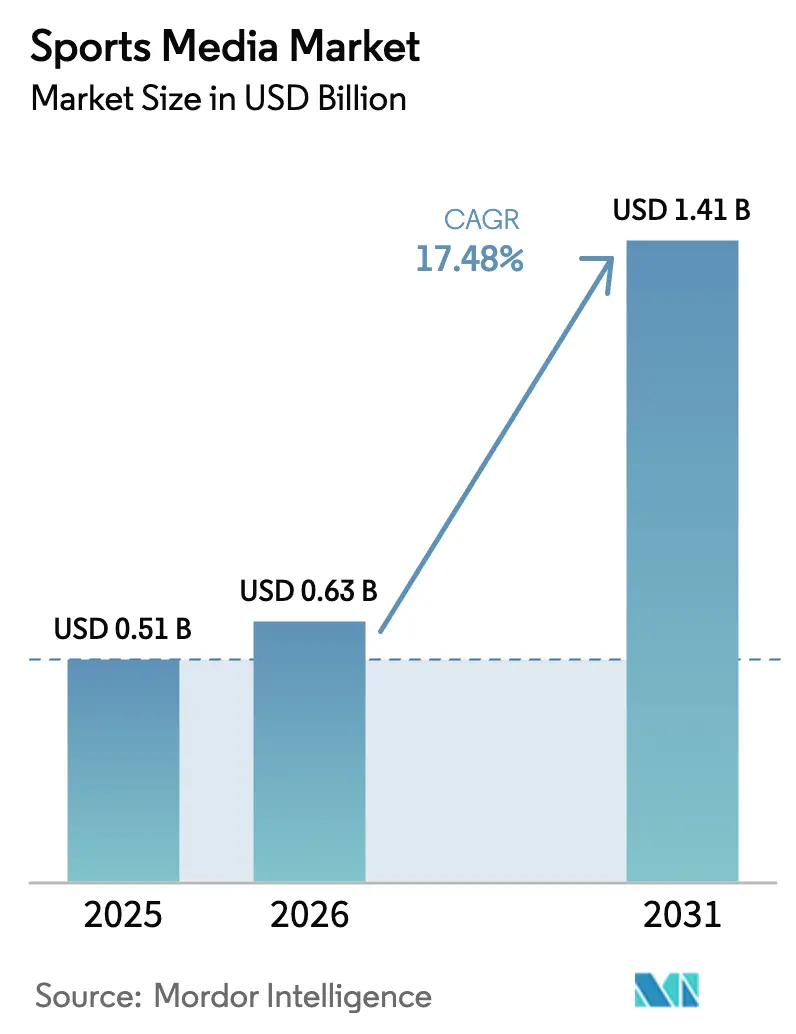
| Market Size (2026) | USD 0.63 Billion |
| Market Size (2031) | USD 1.41 Billion |
| Growth Rate (2026 - 2031) | 17.48% CAGR |
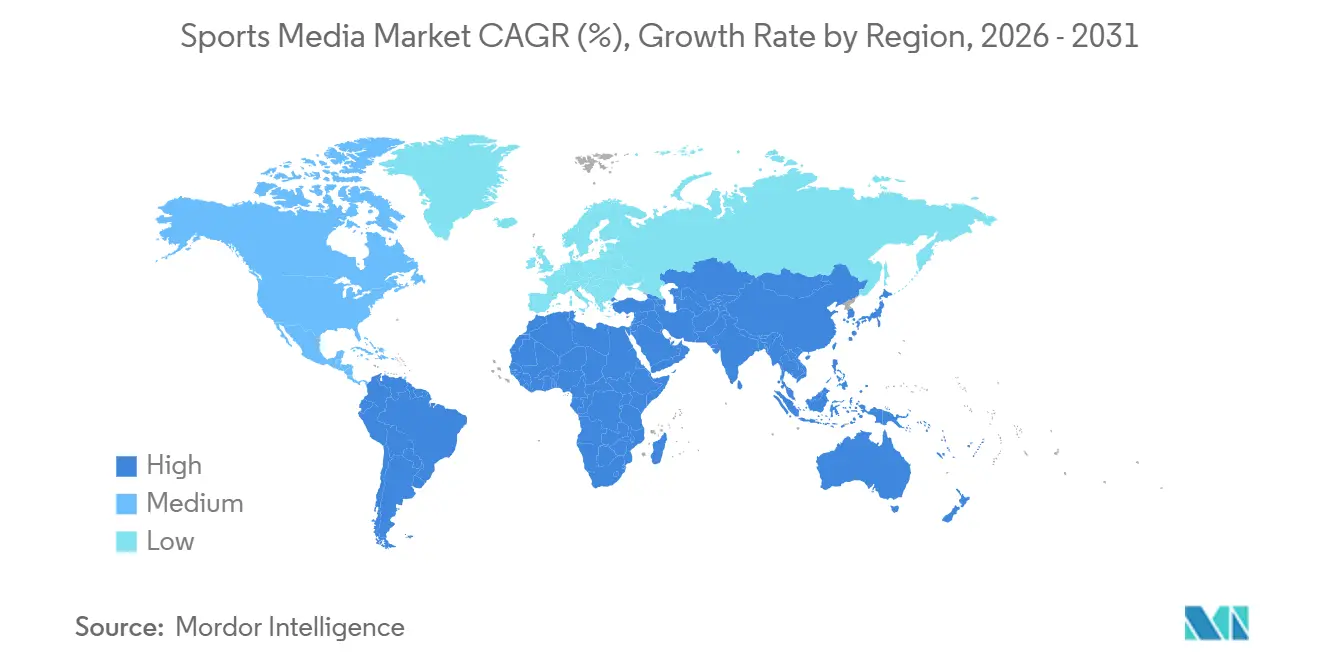
| Fastest Growing Market | Middle East |
| Largest Market | North America |
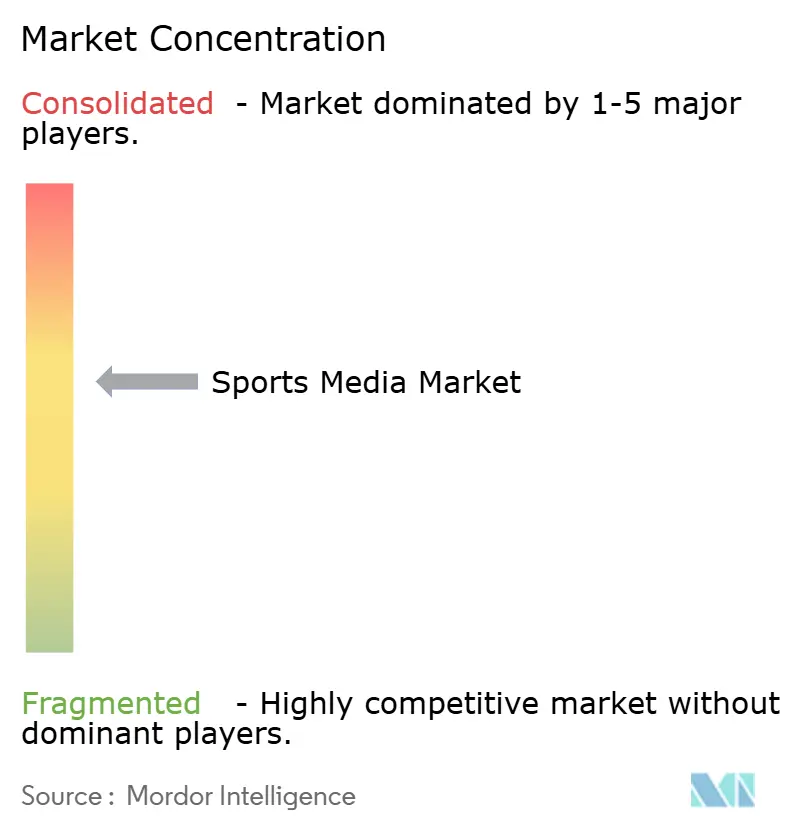
| Market Concentration | Medium |
Major Players *Disclaimer: Major Players sorted in no particular order Image © Mordor Intelligence. Reuse requires attribution under CC BY 4.0. | |
Sports Media Market Analysis by Mordor Intelligence
The sports media market size was valued at USD 0.51 billion in 2025 and estimated to grow from USD 0.63 billion in 2026 to reach USD 1.41 billion by 2031, at a CAGR of 17.48% during the forecast period (2026-2031). A mobile-first audience, lower-latency 5G delivery, and next-generation codecs continue to lift viewer time spent across digital touchpoints. Rights holders are packaging live matches with micro-payment extras such as alternate camera angles and real-time betting data, expanding average revenue per user while easing entry for casual fans. Advertising formats are shifting from thirty-second spots to programmatic overlays that adjust to the individual viewer, a capability made possible by cloud production and first-party data. Platform fragmentation, however, forces leagues to adopt hybrid distribution so that high-value tent-pole events reach mass audiences on linear television while the long tail migrates to subscription streaming. Meanwhile, piracy and surging rights fees compress margins, driving alliances between broadcasters and telecommunication operators that can underwrite costs with bundled connectivity offerings.
Key Report Takeaways
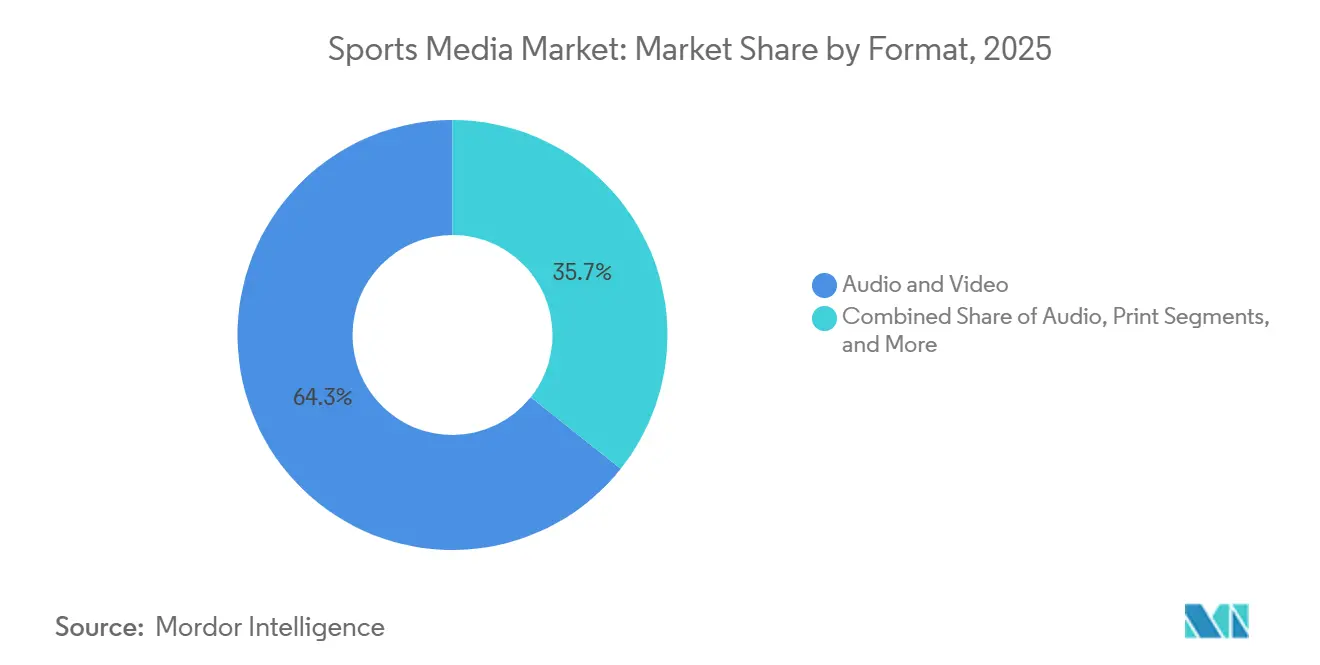
- By format, audio and video captured 64.31% of the sports media market share in 2025 and are projected to grow at a 17.88% CAGR through 2031.
- By platform type, linear television networks held 46.53% of 2025 revenue, while social media platforms are forecast to register the fastest 18.27% CAGR through 2031.
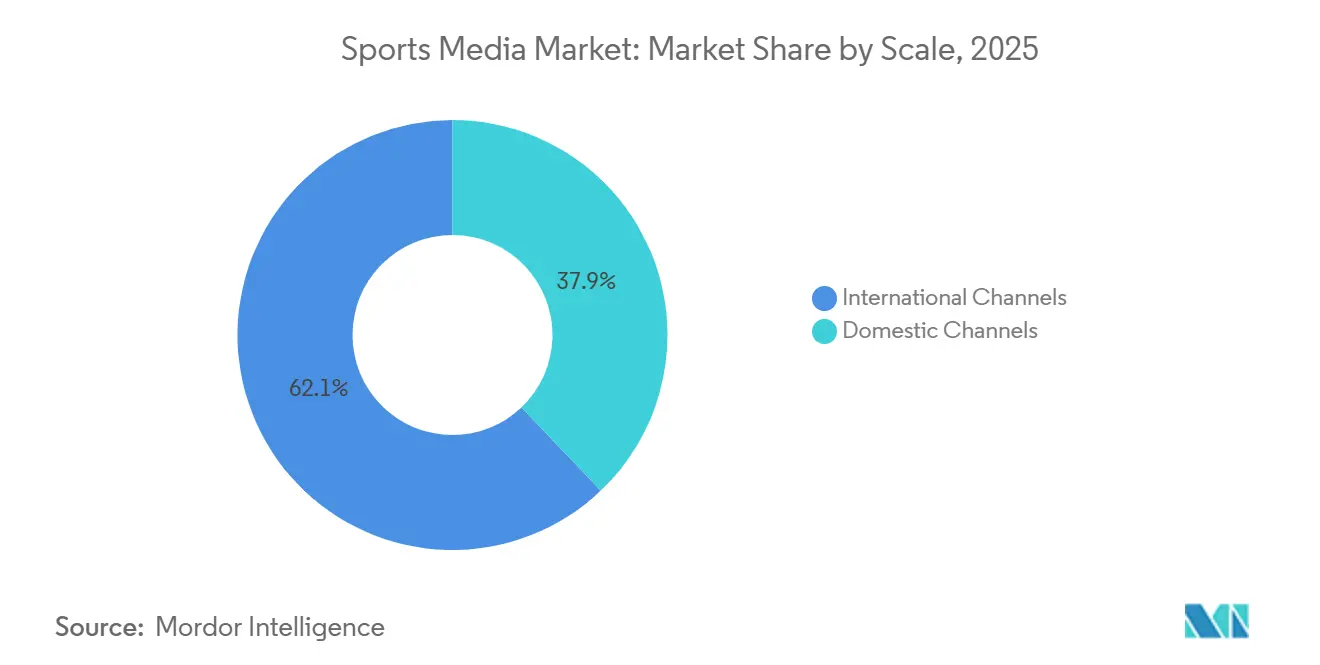
- By scale, international channels commanded 62.12% share in 2025 and are expected to expand at a 17.93% CAGR to 2031, outpacing domestic distribution.
- By revenue source, advertising accounted for 54.98% of 2025 sales, whereas sponsorship and licensing is poised for the highest 18.62% CAGR over 2026-2031.
- By geography, North America contributed 38.88% of value in 2025, while the Middle East is projected to advance at an 18.18% CAGR through 2031.
Note: Market size and forecast figures in this report are generated using Mordor Intelligence’s proprietary estimation framework, updated with the latest available data and insights as of January 2026.
Global Sports Media Market Trends and Insights
Drivers Impact Analysis*
| Driver | (~) % Impact on CAGR Forecast | Geographic Relevance | Impact Timeline |
|---|---|---|---|
| Advancements in Streaming Compression Codecs | +3.2% | Global, with early adoption in North America and Europe | Medium term (2-4 years) |
| Rise of 5G Enabling Mobile Live Sports Viewing | +4.1% | Global, concentrated in North America, Europe, Asia Pacific; emerging in Middle East | Short term (≤ 2 years) |
| Emergence of Micro-payment Pay-per-View Models | +1.8% | Global, with higher traction in North America and Europe | Medium term (2-4 years) |
| Integration of Sports Betting Odds in Broadcasts | +2.5% | North America, Europe; regulatory constraints in Asia Pacific and Middle East | Short term (≤ 2 years) |
| Growth of Women's Sports Leagues Media Rights | +2.9% | Global, led by North America; expanding in Europe and Asia Pacific | Long term (≥ 4 years) |
| Augmented Reality Enhancements for At-home Fans | +1.6% | Global, early adoption in North America and Europe | Long term (≥ 4 years) |
| Source: Mordor Intelligence | |||
Advancements in Streaming Compression Codecs
AV1 and similar codecs lower bandwidth consumption by about 40%, allowing 4K and even 8K live feeds to reach mobile screens without exhausting data caps.[1]Alliance for Open Media, “AV1 Deployment Update,” aomedia.org Broadcasters consequently unlock premium tiers that were previously cost-prohibitive, improving margins for over-the-top providers. The efficiency gain also supports adaptive bitrate ladders that reduce buffering, a known cause of churn. Markets with dense urban populations, such as Tokyo and Seoul, particularly benefit, because limited spectrum can now accommodate more concurrent high-definition streams. In parallel, chipset vendors are embedding hardware-based AV1 decoders, shrinking battery usage and extending average viewing sessions.
Rise of 5G Enabling Mobile Live Sports Viewing
Commercial 5G network slicing is now present in more than 40 jurisdictions, giving content rights holders deterministic bandwidth and latency below two seconds.[2]GSMA, “Network Slicing for Live Sports,” gsma.com The improvement narrows the gap between mobile and linear broadcast, enabling synchronized social chat and betting overlays that rely on real-time data. Telcos sell premium data plans bundling live sports access, a revenue-sharing model that mitigates escalating licensing costs for broadcasters. Stadium operators deploy private 5G to feed in-venue replays to fans’ handsets, deepening engagement even inside arenas. Short-form highlight clips optimized for 5G further amplify reach on social feeds, expanding the funnel for full-game subscriptions.
Integration of Sports Betting Odds in Broadcasts
Embedding dynamic odds transforms a passive viewing experience into an interactive session that lengthens average watch time by 15% in ESPN’s NFL coverage. The dual monetization affiliate commissions and incremental ad inventory creates a cushion against cyclic advertising budgets. Regional compliance remains a hurdle, so broadcasters maintain modular graphics that auto-disable wagering prompts in prohibition zones, adding engineering complexity yet preserving scale. Sophisticated data capture from in-broadcast betting provides granular fan profiles, enhancing future sponsorship pitches. Sportsbooks reciprocate with marketing budgets that displace traditional beverage or automotive categories on media plans.
Growth of Women’s Sports Leagues Media Rights
The WNBA’s 2025 pact worth roughly USD 200 million per season more than tripled prior fees, underscoring newfound commercial momentum. Advertisers value the balanced gender split and younger demographics of women’s sports audiences, yielding higher engagement than saturated men’s leagues. Rights owners mix free-to-air distribution for early-season fixtures with paywalled late-round matchups, maximizing reach and monetization. Brands align campaigns with social-impact messaging inherent in women’s sports, justifying longer-term sponsorship deals. As valuations climb, secondary leagues such as women’s cricket and soccer replicate the WNBA template to court global investors.
Restraints Impact Analysis*
| Restraint | (~) % Impact on CAGR Forecast | Geographic Relevance | Impact Timeline |
|---|---|---|---|
| Escalating Sports Rights Acquisition Costs | -2.8% | Global, most acute in North America and Europe | Short term (≤ 2 years) |
| Piracy of Live Streams Undermining Revenues | -2.1% | Global, highest impact in Asia Pacific, South America, and Middle East | Short term (≤ 2 years) |
| Saturation of Traditional Pay-TV Subscribers | -1.5% | North America and Europe; limited impact in Asia Pacific and Middle East | Medium term (2-4 years) |
| Fragmented Consumer Attention Across Platforms | -1.3% | Global, particularly acute in North America and Europe | Medium term (2-4 years) |
| Source: Mordor Intelligence | |||
Escalating Sports Rights Acquisition Costs
Record-breaking deals USD 77 billion for the NBA and around USD 111 billion for the NFL stretch broadcaster balance sheets, encouraging syndication and sub-licensing that confuse fans and dilute exclusivity. Linear networks with legacy overheads find it difficult to bid against diversified tech giants willing to treat sports as a loss leader. To cope, some buyers secure narrow windows, such as early-season packages, lowering upfront outlays at the cost of audience fragmentation. Smaller leagues experience a bifurcated market, enjoying modest uplifts yet struggling to stay visible amid marquee properties. Rights inflation thus pressures subscription prices, testing consumer tolerance in a landscape already burdened by platform fatigue.
Piracy of Live Streams Undermining Revenues
Encrypted messaging apps and social networks now distribute high-definition stolen feeds that rival official streams, eroding willingness to pay.[3]Asia-Pacific Video Industry Association, “Piracy Via Social Media,” avia.org Grant Thornton logged 26.2 million takedown notices for sports content in 2025, illustrating the scale and resource drain of enforcement. Asia Pacific, South America, and the Middle East record the highest incident growth, coinciding with price-sensitive segments and inconsistent intellectual property enforcement. Rights holders invest in forensic watermarking and real-time AI detection, yet pirates migrate domains within minutes. Lost revenue complicates capital recovery for ever-rising rights fees, perpetuating a challenging feedback loop.
*Our forecasts treat driver/restraint impacts as directional, not additive. The impact forecasts reflect baseline growth, mix effects, and variable interactions.
Segment Analysis
By Format: Video Integration Drives Consumption
Audio and video accounted for a commanding 64.31% sports media market share in 2025, reflecting consumer demand for immersive storytelling that legacy print cannot replicate. The format segment is projected to grow at a 17.88% CAGR to 2031 as mobile and connected-TV adoption widens the addressable base. Video podcasts illustrate the convergence, with YouTube passing 1 billion monthly podcast viewers and Spotify adding visuals to over 60% of top shows in 2025.[4]Ofcom, “UK Podcast Listening 2025,” ofcom.org.uk Advertisers benefit from higher completion rates and product-placement flexibility, enabling shoppable overlays that outperform static pre-rolls.
Print remains niche, serving collectors and an archival readership. Sports Illustrated’s pivot to a digital-first model under Minute Media highlights a broader industry transition that protects heritage titles while aligning with on-demand habits. Audio-only content, especially commuter-friendly talk radio, retains loyal followings; Ofcom found 22% of U.K. adults listened to podcasts weekly in 2025. Yet even stalwart audio publishers embed highlight reels into RSS feeds, indicating that pure-audio silos are fading. The sports media market for video formats will therefore grow disproportionately, sustaining monetization innovations such as mid-roll dynamic ad insertion.


By Platform Type: Social Media Gains Share
Linear television networks still held 46.53% revenue in 2025 on the back of carriage fees and marquee exclusives, but social media platforms are on track for an 18.27% CAGR through 2031. Algorithmic discovery on TikTok, Instagram, and YouTube introduces casual viewers to highlight clips, expanding fandom beyond core demographics. YouTube’s USD 2 billion-per-year acquisition of the NFL Sunday Ticket formalized social platforms as credible live-sports distributors. For rights holders, short-form video doubles as a marketing funnel and direct monetization via creator partnerships.
Sports media industry strategists note that over-the-top streamers such as DAZN and ESPN’s direct-to-consumer app exploit cord-cutting trends, yet churn persists when event calendars lapse. Consequently, bundling experiments Fox One plus ESPN Unlimited at USD 39.99 per month seek to recreate cable-like breadth without set-top boxes. Digital sports publishers like The Athletic deploy subscription journalism that complements live coverage, creating layered consumption journeys. As attention fragments, the sports media market relies on cross-platform reach to maintain overall audience scale.
By Scale: International Rights Command Premium
International channels controlled 62.12% of 2025 revenue, a signal that leagues now court global audiences as domestic bases mature. The trend accelerates at a projected 17.93% CAGR to 2031, powered by sovereign wealth funds in the Middle East and large tech budgets in Asia. The NFL’s commitment to eight regular-season games abroad in 2025 exemplifies the push to seed fandoms on new continents. International packages often bundle grassroots development clauses, leveraging sport for national branding.
Domestic networks still curate local commentary and minor league fixtures, yet carriage disputes and regional sports network insolvencies in North America undercut long-standing models. Some teams launch in-house streaming to insulate against distributor turbulence, further splintering access. For platforms, reconciling heterogenous advertising rules and data-privacy regimes adds cost but also localizes monetization levers. Over time, incremental gains abroad are expected to outstrip plateauing home-market growth, cementing the sports media market’s global orientation.
By Revenue Source: Sponsorship Outpaces Advertising
Advertising formed 54.98% of topline in 2025, but sponsorship and licensing is forecast to climb at 18.62% CAGR through 2031, eclipsing ad-only contributions late in the decade. Advertisers increasingly prefer multi-asset packages that secure logo placement, influencer content, and social amplification in one contract. Sky Media’s six-brand Premier League deal demonstrates the appetite for year-round storytelling that extends beyond match windows. SponsorUnited valued NFL team sponsorship at USD 2.7 billion in 2025, up 8% year on year.
Subscription income also rises as offerings like ESPN’s USD 29.99 plan roll multiple channels into a single login, although stacking fees across platforms risks fatigue. Pay-per-view maintains relevance for combat sports, where high-stakes events justify one-time buys. As cookies deprecate, contextual and first-party data from live sports interactions make sponsorship even more attractive, anchoring the next phase of sports media market monetization.
Geography Analysis
North America generated 38.88% of sports media market value in 2025 thanks to blockbuster rights deals and mature streaming infrastructure. ESPN’s direct-to-consumer launch signaled the break from the cable bundle, encouraging rivals to mimic a dual-revenue approach that combines subscription and advertising. Tech entrants such as YouTube and Amazon validate willingness to spend billions on exclusives, intensifying bidding wars and cementing the region’s premium pricing benchmark. Simultaneously, legalized sports betting adds an incremental monetization vector, albeit under regulator oversight.
The Middle East, forecast for an 18.18% CAGR to 2031, illustrates the leverage of state capital in accelerating infrastructure and rights acquisition. beIN Sports’ GBP 550 million Premier League package and Saudi Arabia’s USD 2 billion equity stake in DAZN typify sovereign ambitions to brand the region as a sports nexus. Investments extend beyond rights into studio complexes and talent academies, underpinning both production quality and content supply. While market concentration around state-backed entities could dampen private competition, deep funding pools ensure premium events remain visible to regional audiences.
Europe maintains a sizeable slice of the sports media market, headlined by the Premier League and Bundesliga, whose domestic and international packages together exceed tens of billions in commitments. Sponsorship sophistication is evident in integrated campaigns that blend broadcast, social, and experiential assets. The continent’s stringent data and advertising rules, however, impose compliance overhead that weighs on smaller entrants. Asia Pacific’s ascent from USD 145 billion in 2025 toward USD 165 billion by 2029 shows scale, but rampant piracy, highlighted by 49% of illegal streams emanating from social platforms, dilutes lawful revenue. South America and Africa trail in absolute size yet exhibit high mobile video growth potential, drawing early mover investments from digital-first publishers.

Competitive Landscape
Competition in the sports media market is intensifying as legacy broadcasters, tech conglomerates, and venture-backed pure plays vie for overlapping rights windows. Traditional networks such as ESPN and NBC leverage production pedigree but face subscriber erosion as younger viewers eschew cable. Netflix’s USD 5 billion WWE agreement illustrates how subscription video on demand can marshal global reach absent linear affiliates, attracting approximately 30 million viewers for its first NFL simulcast. DAZN amassed USD 8.7 billion in fresh capital, enabling bids for events like the FIFA Club World Cup and spreading risk across emerging markets.
Platform differentiation now hinges on experience. Amazon and Apple integrate multi-angle streams, real-time statistics, and low-latency delivery through proprietary device ecosystems, raising consumer expectations. Minute Media’s acquisitions of STN Video and AI-enabled Magnifi showcase convergence between rights ownership and tooling that automates highlight clipping, personalization, and programmatic syndication. Smaller specialists occupy value pools in women’s leagues, niche sports, and region-specific commentary, often partnering with major platforms to extend distribution while maintaining editorial independence.
As rights costs rise, consortium bids and revenue-sharing with telecom operators reappear, spreading financial exposure. Broadcasters also hedge through vertical integration, purchasing betting affiliates or ticketing platforms to extract additional margins. Failure to evolve risks churn to agile foes, underscoring why investment in cloud production, data analytics, and user-centric design is now table stakes across the sports media industry.
Sports Media Industry Leaders
Walt Disney Company
Comcast Corporation
Amazon.com Inc.
Paramount Global
Fox Corporation
- *Disclaimer: Major Players sorted in no particular order

Recent Industry Developments
- January 2026: Minute Media launched SI TV, expanding Sports Illustrated into streaming and adding an owned-and-operated premium video channel.
- October 2025: ESPN and Fox Corporation unveiled a USD 39.99 bundle combining ESPN Unlimited with Fox One to mitigate subscription fatigue.
- September 2025: ESPN introduced its flagship direct-to-consumer service at USD 29.99 per month, merging linear and digital assets.
- September 2025: Minute Media acquired AI video company VideoVerse to automate highlight generation for its sports portfolio.


Global Sports Media Market Report Scope
The global sports media market is experiencing significant growth, driven by increasing consumer demand for live sports coverage, advancements in digital streaming technologies, and the rising popularity of sports across various regions. The market is also benefiting from the integration of innovative technologies, such as augmented reality (AR) and virtual reality (VR), which enhance viewer engagement and provide immersive experiences.
The Sports Media Market Report is Segmented by Format (Audio, Audio and Video, Print, Other Formats), Platform Type (Linear Television Networks, Over-the-Top Streaming Services, Social Media Platforms, Digital Sports Publishers), Scale (Domestic Channels, International Channels), Revenue Source (Advertising, Subscription, Pay-per-View, Sponsorship and Licensing), and Geography (North America, South America, Europe, Asia Pacific, Middle East, Africa). The Market Forecasts are Provided in Terms of Value (USD).
| Audio |
| Audio and Video |
| Other Formats |
| Linear Television Networks |
| Over-the-Top (OTT) Streaming Services |
| Social Media Platforms |
| Digital Sports Publishers |
| Domestic Channels |
| International Channels |
| Advertising |
| Subscription |
| Pay-per-View |
| Sponsorship and Licensing |
| North America | United States |
| Canada | |
| Mexico | |
| South America | Brazil |
| Argentina | |
| Europe | Germany |
| United Kingdom | |
| France | |
| Rest of Europe | |
| Asia Pacific | China |
| Japan | |
| India | |
| Rest of Asia Pacific | |
| Middle East | United Arab Emirates |
| Saudi Arabia | |
| Rest of Middle East | |
| Africa | South Africa |
| Rest of Africa |
| By Format | Audio | |
| Audio and Video | ||
| Other Formats | ||
| By Platform Type | Linear Television Networks | |
| Over-the-Top (OTT) Streaming Services | ||
| Social Media Platforms | ||
| Digital Sports Publishers | ||
| By Scale | Domestic Channels | |
| International Channels | ||
| By Revenue Source | Advertising | |
| Subscription | ||
| Pay-per-View | ||
| Sponsorship and Licensing | ||
| By Geography | North America | United States |
| Canada | ||
| Mexico | ||
| South America | Brazil | |
| Argentina | ||
| Europe | Germany | |
| United Kingdom | ||
| France | ||
| Rest of Europe | ||
| Asia Pacific | China | |
| Japan | ||
| India | ||
| Rest of Asia Pacific | ||
| Middle East | United Arab Emirates | |
| Saudi Arabia | ||
| Rest of Middle East | ||
| Africa | South Africa | |
| Rest of Africa | ||


Key Questions Answered in the Report
How fast is the sports media market expected to grow through 2031?
It is projected to register a 17.48% CAGR between 2026 and 2031, expanding the sports media market size from USD 0.63 billion in 2026 to USD 1.41 billion by 2031.
Which segment currently holds the largest sports media market share?
Audio and video formats lead with a 64.31% share in 2025, reflecting consumer preference for immersive experiences.
Why are sponsorship revenues rising faster than traditional advertising?
Integrated deals across broadcast, social, and experiential channels offer exclusivity and stronger brand alignment, driving an 18.62% CAGR for sponsorship and licensing revenue.
What technology change most improves live mobile streaming quality?
5G network slicing, paired with AV1 compression, cuts latency below two seconds and reduces bandwidth use by roughly 40%, enhancing viewer experience.
Which region is forecast to grow the quickest?
The Middle East is poised for an 18.18% CAGR through 2031, underpinned by sovereign wealth fund investments in rights and infrastructure.
How are broadcasters combating sports piracy?
They deploy forensic watermarking, AI-driven content recognition, and rapid takedown protocols, though pirates adapt quickly across social and messaging platforms.
Page last updated on:


