Market Overview
| Study Period | 2020 - 2031 |
|---|---|
| Forecast Data Period | 2026 - 2031 |
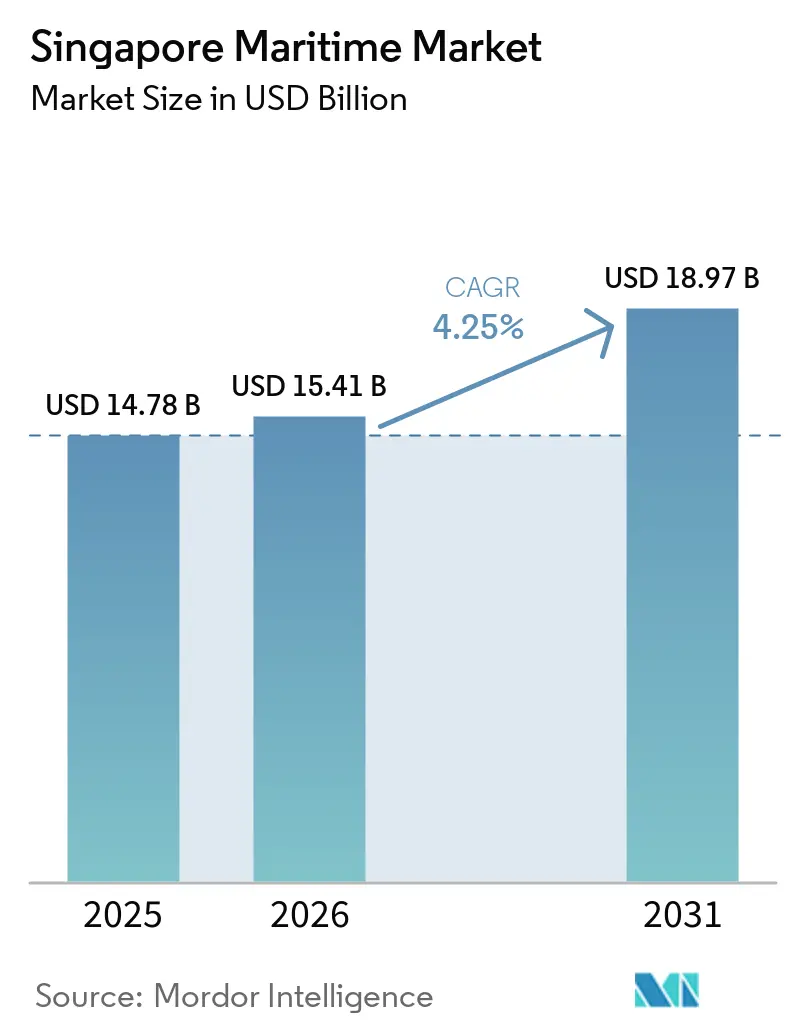
| Base Year Market Size (2025) | USD 14.78 Billion |
| Market Size (2026) | USD 15.41 Billion |
| Market Size (2031) | USD 18.97 Billion |
| Growth Rate (2026 - 2031) | 4.25% CAGR |
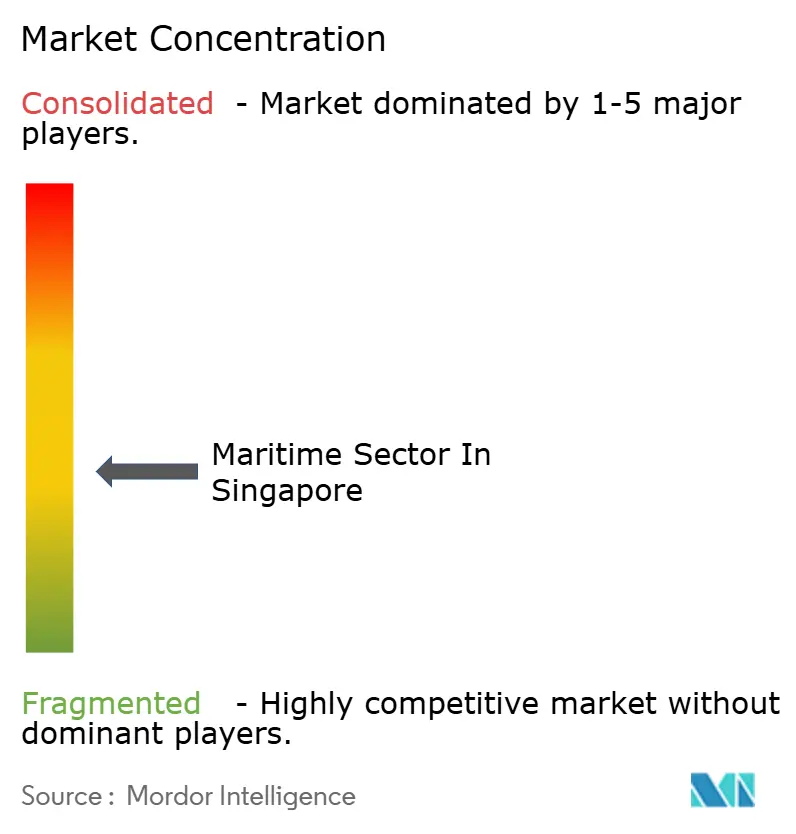
| Market Concentration | Medium |
Major Players *Disclaimer: Major Players sorted in no particular order Image © Mordor Intelligence. Reuse requires attribution under CC BY 4.0. | |
Singapore Maritime Market Analysis by Mordor Intelligence
The Maritime Sector In Singapore Market size in 2026 is estimated at USD 15.41 billion, growing from 2025 value of USD 14.78 billion with 2031 projections showing USD 18.97 billion, growing at 4.25% CAGR over 2026-2031.
Accelerated automation at Tuas Port, the electronic bunker-delivery-note mandate, and expanding green-fuel corridors underpin the Maritime Sector in Singapore market’s momentum, even as EU Emissions Trading System (EU-ETS) surcharges compress liner margins. Container throughput hit a record 41.12 million TEU in 2024, highlighting the city-state’s resilience as a trans-shipment nexus despite Red Sea rerouting disruptions[1]Port Technology editorial team, “Singapore Port Throughput Hits Record 41.12M TEU in 2024,” Port Technology, porttechnology.org. Bunker volumes of 54.92 million tonnes in 2024 reaffirm Singapore’s role as the world’s largest bunkering hub, with LNG, methanol, and ammonia trials scaling quickly[2]Maritime and Port Authority of Singapore, “Mandatory Electronic Bunker Delivery Notes from April 2025,” mpa.gov.sg. Maritime-5G coverage due in mid-2025 promises real-time vessel-traffic coordination, while X-Press Feeders’ 21.8% fleet expansion shows how agile operators capture schedule-reliability premiums.
Key Report Takeaways
- By activity, Port and Terminal Operations held 40.78% of the Maritime Sector in Singapore market share in 2025, while Bunkering Services is projected to expand at a 4.62% CAGR through 2031.
- By vessel type, Container Vessels accounted for 47.92% share of the Maritime Sector in Singapore market size in 2025, and Tankers are forecast to advance at a 4.36% CAGR to 2031.
- By end user, Electronics and Semiconductors led with 30.86% revenue share in 2025; Retail and E-commerce is expected to grow at a 4.66% CAGR through 2031.
Note: Market size and forecast figures in this report are generated using Mordor Intelligence’s proprietary estimation framework, updated with the latest available data and insights as of 2026.
Singapore Maritime Market Trends and Insights
Drivers Impact Analysis*
| Driver | (~) % Impact on CAGR Forecast | Geographic Relevance | Impact Timeline |
|---|---|---|---|
| Surge in mega-containership traffic & hub-port trans-shipment demand | +0.9% | Global, with concentration in ASEAN-Europe-North America corridors | Medium term (2-4 years) |
| Singapore Government's Tuas Port capacity expansion & full automation roadmap | +1.2% | National, spill-over to Malaysia-Indonesia feeder routes | Long term (≥ 4 years) |
| Record bunker-fuel volumes and first-in-class digital bunkering mandate | +0.7% | Global, Singapore as primary bunkering hub | Short term (≤ 2 years) |
| Green & Digital Shipping Corridors accelerating alternative-fuel uptake | +0.8% | Singapore-Rotterdam, Singapore-Los Angeles, Singapore-China | Medium term (2-4 years) |
| Move to integrate air-sea intermodal cargo within 24-hour windows | +0.5% | National, early adoption in pharmaceuticals and e-commerce | Short term (≤ 2 years) |
| AI-enabled Next-Gen Vessel-Traffic-Management & Maritime-5G coverage | +0.6% | National, with pilot extensions to regional waters | Medium term (2-4 years) |
| Source: Mordor Intelligence | |||
Surge in Mega-Containership Traffic and Hub-Port Trans-Shipment Demand
Ultra-large container vessels exceeding 20,000 TEU now call weekly at Singapore in greater numbers, concentrating cargo into fewer port rotations and magnifying berth-delay penalties. Throughput reached 41.12 million TEU in 2024, about 85% of which was transshipment cargo. Red Sea diversions added up to two weeks on Asia-Europe schedules, pushing 90% of sailings off timetable and funneling overflow to Singapore.Legacy terminals strained under yard-density spikes, prompting the Maritime and Port Authority (MPA) to deploy predictive-analytics berth allocation via digitalPORT@SG, although full effectiveness depends on universal real-time data feeds.
Singapore Government’s Tuas Port Capacity Expansion and Full Automation Roadmap
Tuas Port targets 65 million TEU annual capacity by the 2040s, consolidating four legacy terminals into a mega-facility featuring automated guided vehicles, remote-controlled quay cranes, and the iWX digital-twin platform[3]PSA International communications, “PSA Supply Chain Hub Tuas Groundbreaking 2024,” globalpsa.com. Phase 1 is operational, and PSA broke ground in October 2024 on a 2 million-sq-ft automated supply-chain hub that integrates customs pre-clearance and warehouse robotics. The SGD 20 billion investment promises labor-cost savings but carries technology-obsolescence risk as regional rivals roll out lower-cost semi-automated terminals.
Record Bunker-Fuel Volumes and Digital Bunkering Mandate
Singapore bunker fuel sales reached 54.92 million tonnes in 2024, accounting for approximately 20% of global marine fuel demand. Electronic bunker-delivery notes became mandatory in April 2025, replacing paper forms with blockchain-anchored records that cut fraud and speed customs clearance. Real-time mass-flow-meter reconciliation and quality verification now integrate directly with vessel-performance dashboards.
Green and Digital Shipping Corridors Accelerating Alternative-Fuel Uptake
Singapore has launched corridors with Rotterdam, Los Angeles, and key Chinese ports to pilot ammonia, methanol, and bio-LNG supply chains. The Singapore-Rotterdam route leverages petrochemical clusters for ammonia and methanol, while the Singapore-Los Angeles corridor focuses on bio-LNG for container and ro-ro vessels. Corridor economics rely on monetizing carbon credits whose volatile pricing can unsettle business cases.
Restraints Impact Analysis*
| Restraint | (~)% Impact on Market CAGR | Geographic Relevance | Impact Timeline |
|---|---|---|---|
| Red-Sea rerouting congestion spikes exposing berth/yard bottlenecks | -0.6% | Global, acute impact on Singapore trans-shipment flows | Short term (≤ 2 years) |
| Rising carbon-cost pass-through (EU-ETS, IMO CII) eroding operator margins | -0.8% | Global, concentrated in Europe-Asia trade lanes | Medium term (2-4 years) |
| Fragmented harbour-craft ownership slowing electrification economics | -0.4% | National, specific to Singapore harbour operations | Medium term (2-4 years) |
| Talent pipeline gaps for ammonia/methanol bunkering safety skills | -0.3% | National, with regional spill-over to ASEAN ports | Long term (≥ 4 years) |
| Source: Mordor Intelligence | |||
Red Sea Rerouting Congestion Spikes Exposing Berth/Yard Bottlenecks
Houthi attacks forced Asia-Europe services around the Cape of Good Hope, adding up to 14 days per voyage and removing roughly 15% of effective fleet capacity. Schedule reliability plunged to 10%, driving yard-density surges at legacy Singapore terminals. While digitalPORT@SG reallocates berths dynamically, it depends on accurate arrival forecasts that remain elusive during geopolitical disruptions.
Rising Carbon-Cost Pass-Through (EU-ETS, IMO CII) Eroding Operator Margins
EU-ETS coverage steps up to 100% of maritime emissions by 2026, with 2024 allowances priced between EUR 90 and EUR 150 per tonne of CO₂. Liner surcharges face resistance from cargo owners, squeezing profitability. IMO’s Carbon Intensity Indicator (CII) adds pressure, obliging owners to slow-steam or retrofit vessels. Singapore risks losing bunker share if it lags in ammonia and methanol infrastructure development.
*Our forecasts treat driver/restraint impacts as directional, not additive. The impact forecasts reflect baseline growth, mix effects, and variable interactions.
Segment Analysis
By Activity: Bunkering Services Gain Momentum
Port and Terminal Operations contributed 40.78% to overall 2025 revenue, benefiting from 41.12 million TEU throughput and PSA International’s scale. Bunkering Services, although smaller, are set for 4.62% CAGR, the quickest among activities, thanks to the electronic bunker-delivery-note rule and surging alternative-fuel demand. The Maritime Sector in Singapore market size for bunkering is expected to widen steadily as LNG, methanol, and ammonia adoption rises across liner and tanker fleets. Shipping Line Services capture upside from diverted Asia-Europe volumes but bear EU-ETS pass-through costs. Shipbuilding, Repair, and Maintenance accelerate after Seatrium’s creation, which consolidated dry-dock capacity and positioned the yard for green-retrofit projects. Maritime Support Services thrive on compliance advisory demand as operators navigate CII ratings and carbon-credit procurement.
Automated berth allocation and Maritime-5G will further lift productivity for terminal activities. Conversely, the fragmented harbour-craft segment drags on electrification targets, limiting near-term emissions gains in port waters. Seatrium’s focus on ammonia-ready conversions aligns with Tuas Port’s strategy of anchoring full-cycle green-fuel infrastructure within Singapore. Financing and legal advisory firms leverage Singapore’s common-law framework to structure green-transition loans, drawing additional professional-services revenue into the Maritime Sector in Singapore market.


By Vessel Type: Tankers Take the Growth Lead
Container Vessels maintained 47.92% revenue share in 2025, reflecting sustained trans-shipment dominance. Tankers, however, are positioned for 4.36% CAGR through 2031 as ammonia and methanol logistics ramp up on Jurong Island. The Maritime Sector in Singapore market share for tankers will expand as chemical and LNG bunker vessels proliferate. Bulk Carriers see moderate growth tied to commodity flows, while Passenger Vessels remain a niche recovering from pandemic-induced volatility. The “Others” category, including offshore support vessels and harbour craft, benefits from Keppel’s electric tugboat trials yet waits on battery-cost deflation for large-scale electrification.
Ultra-large containership calls drive equipment upgrades, prompting PSA to install higher lift-height cranes. Chemical tankers retrofit cargo-handling systems to accommodate toxic ammonia, creating shipyard demand that Seatrium is well placed to capture. Cruise-line deployment into Southeast Asia rebounds, adding consistent, though smaller, passenger-terminal revenue. Across vessel classes, predictive-maintenance analytics reduce unscheduled downtime, enhancing berth reliability—an increasingly critical differentiator within the Maritime Sector in Singapore market.

By End User Industry: E-Commerce Logistics Accelerates
Electronics and Semiconductors generated 30.86% of 2025 revenue, underpinned by the city-state’s 11% share of global semiconductor output. Retail and E-commerce is forecast to post the highest 4.66% CAGR, driven by sub-24-hour air-sea handoffs and omnichannel fulfillment models. Pharmaceuticals and Healthcare gain from DHL’s EUR 10 million pharma hub, while Chemicals and Petrochemicals leverage Jurong Island’s refining complex. Food and Beverage traffic grows steadily on regional protein demand but faces bunker-cost sensitivity. The diversified end-user base cushions the Maritime Sector in Singapore market against cyclical shocks in any single industry.
High-velocity e-commerce parcels spur investment in automated storage and retrieval systems at Tuas. Semiconductor manufacturers prioritize reliability over cost, reinforcing Singapore’s hub status. Pharma cargo growth demands tight temperature control, prompting cold-chain upgrades across warehousing and vessel-hold infrastructure. These evolving requirements create new service niches, expanding the Maritime Sector in Singapore industry’s value proposition beyond pure port handling.
Geography Analysis
Singapore’s strategic location astride the Straits of Malacca and Singapore places it at the crossroads of 25% of world seaborne trade and 40% of LNG flows. The Maritime Sector in Singapore market benefits from a corruption-free regulatory environment and a common-law legal system that attracts ship registries; the Singapore Registry of Ships surpassed 108 million gross tonnes in 2024. Red Sea diversions, however, intensified berth congestion, exposing the vulnerability of a hub reliant entirely on trans-shipment.
Regional competition tightens as Malaysia’s Port of Tanjung Pelepas upgrades to semi-automation at lower cost, and Indonesia’s Patimban Port targets automotive exports with subsidy-driven tariffs. Singapore’s counterstrategy hinges on full automation, Maritime-5G, and green-fuel infrastructure that rivals cannot replicate quickly. The Maritime Sector in Singapore market size will partly depend on how decisively the city-state rolls out ammonia and methanol bunkering ahead of wider IMO decarbonization deadlines.
Air-sea integration increases in importance as Changi’s logistics park expands. DigitalPORT@SG reduced average container dwell time to below 10 minutes in 2024, an efficiency benchmark unmatched by neighboring ports. These speed advantages underpin Singapore’s value proposition and should sustain trans-shipment share even as alternative hubs chase cost-sensitive cargo segments.
Competitive Landscape
The Maritime Sector in Singapore market is moderately concentrated. PSA International dominates container handling and is rolling out the iWX digital-twin platform at Tuas to optimize stacking and predict equipment failures. Jurong Port focuses on bulk and breakbulk cargo, leveraging proximity to petrochemical complexes. Feeder operators such as X-Press Feeders increased fleet capacity by 21.8% to seize volume spikes from schedule disruptions.
Technology investment is the main differentiator. PSA’s autonomous straddle carriers and remote-controlled cranes set a productivity bar that capital-constrained rivals struggle to match. Compliance complexity around EU-ETS and CII drives demand for advisory services from Wilhelmsen and Marsh, adding depth to the Maritime Sector in Singapore.
Electric harbour-craft trials by Keppel and Seatrium show potential for emissions reduction, yet fragmentation among more than 200 operators slows scale adoption. White-space opportunities include ammonia bunkering and safety-training services, with the MPA’s request for proposals on Jurong Island signaling upcoming infrastructure commitments.
Singapore Maritime Industry Leaders
PSA International
CMA CGM
Sinoda Shipping Agency Pte Ltd
Singapore Shipping Corporation Limited
X‑Press Feeders
- *Disclaimer: Major Players sorted in no particular order

Recent Industry Developments
- October 2024: PSA International broke ground on a SGD 1.5 billion automated supply-chain hub at Tuas Port, slated for 2027 completion.
- August 2024: X-Press Feeders expanded fleet capacity by 34,000 TEU via USD 180 million in newbuilds and acquisitions.
- July 2024: CMA CGM announced a USD 250 million investment in Singapore warehousing and cold-chain facilities.
- June 2024: Hutchison Ports secured a 30-year concession extension at Pasir Panjang, pledging SGD 800 million for upgrades.


Research Methodology Framework and Report Scope
Market Definitions and Key Coverage
Our study defines Singapore's maritime sector as all commercial sea-freight activity handled within the nation's territorial waters, including terminal operations, cargo handling, and associated water-transport support services that make containerized, bulk, and general cargo movements possible. Mordor Intelligence treats reported revenues from bunkering, vessel call fees, and value-added port logistics as in-scope, while mapping them back to the port estate where they are earned.
Scope exclusion: Passenger ferry services, shipbuilding, marine equipment manufacturing, and leisure craft marinas are kept outside the frame.
Segmentation Overview
- By Activity
- Port and Terminal Operations
- Shipping Line Services (combines cargo and passengers)
- Bunkering Services
- Shipbuilding, Repair and Maintenance
- Maritime Support Services (finance, insurance, broking, legal)
- By Vessel Type
- Container Vessels
- Bulk Carriers
- Tankers
- Passenger Vessels
- Others
- By End User Industry
- Electronics and Semiconductors
- Chemicals and Petrochemicals
- Food and Beverage
- Pharmaceuticals and Healthcare
- Retail and E-commerce
- Others
Detailed Research Methodology and Data Validation
Primary Research
Next, we spoke with shipping-line route planners, terminal engineering managers, and port community system vendors across Singapore, Hong Kong, and Rotterdam. The interviews validated crane productivity, container dwell time, and forward capacity utilization assumptions, while short surveys of exporters using Tuas Mega-Port clarified average load factors for dry and reefer boxes.
Desk Research
We began by extracting throughput and revenue series from the Maritime and Port Authority of Singapore, ASEANstats, and UNCTAD Port Calls, then lined these up with carrier disclosures in annual reports and 10-Ks. Mordor analysts supplemented core figures with Dow Jones Factiva news feeds, Baltic Exchange rate indices, and shipment-level trade data sourced through Volza to benchmark freight rates and bunker spreads. Journal of Commerce articles and World Bank Port Performance papers filled historical gaps. The sources cited are illustrative, not exhaustive.
Market-Sizing & Forecasting
Mordor Intelligence applies a top-down build in which total TEUs and bulk tonnage published by the Port Authority are multiplied by verified average revenue per unit to create the 2024 baseline. Selective bottom-up checks, supplier roll-ups of gate moves and sampled freight invoices, help fine-tune totals. Key model drivers include berth automation productivity ramps, vessel call frequency linked to ASEAN manufacturing shifts, bunker price indices, and trade agreement elasticity. Multivariate regression blended with scenario analysis projects 2025-2030, and missing splits are cautiously imputed from comparable hub ratios before sensitivity testing.
Data Validation & Update Cycle
Each update runs through variance checks against historical series, peer review by a senior analyst, and anomaly flags when implied port capacity nears saturation. Models refresh annually, with mid-cycle reviews triggered by material events such as new terminal phases or tariff changes.
Why Our Singapore Sea Freight Transport Baseline Commands Confidence
Published estimates diverge because some providers fold inland logistics or cruise tourism into the same pot, while others convert currencies at different cut-off dates.
Differences usually stem from service scope breadth, untested revenue assumptions, and refresh cadence. Our figure removes passenger and leisure lines, uses a common 2024 FX base, and is re-benchmarked every year, a discipline several external consultancies postpone.
Benchmark comparison
| Market Size | Anonymized source | Primary gap driver |
|---|---|---|
| USD 7.32 B (2025) | Mordor Intelligence | - |
| USD 4.98 B (2024) | Global Consultancy A | Narrow scope limited to chartering services and minimal primary validation |
| USD 4.75 B (2025) | Regional Consultancy B | Historical CAGR extrapolation without cross-checking port throughput |
| USD 200 B (2024) | Trade Journal C | Blended shipping revenue and offshore engineering, inflating scope |
These comparisons show that our disciplined variable selection and annual refresh provide a balanced, transparent baseline that decision-makers can replicate and trust.


Key Questions Answered in the Report
How large is the Maritime Sector in Singapore market in 2026?
The Maritime Sector in Singapore market size is USD 15.41 billion in 2026 and is forecast to reach USD 18.97 billion by 2031.
Which activity segment is growing fastest?
Bunkering Services lead with a projected 4.62% CAGR through 2031, buoyed by the electronic bunker-delivery-note mandate and alternative-fuel uptake.
What vessel category is expected to see the highest growth?
Tankers are set for 4.36% CAGR to 2031 as ammonia and methanol bunkering infrastructure scales at Jurong Island.
How will EU-ETS charges affect operators using Singapore?
Rising carbon-cost pass-throughs compress margins, driving demand for green fuels and retrofits, which Singapore supports through new bunkering and shipyard capacity.
What technology upgrades differentiate Singapore’s port operations?
Full automation at Tuas Port, Maritime-5G connectivity, and the iWX digital-twin platform cut turnaround times and enhance reliability for high-value cargo.
Page last updated on:


