Market Overview
| Study Period | 2020 - 2031 |
|---|---|
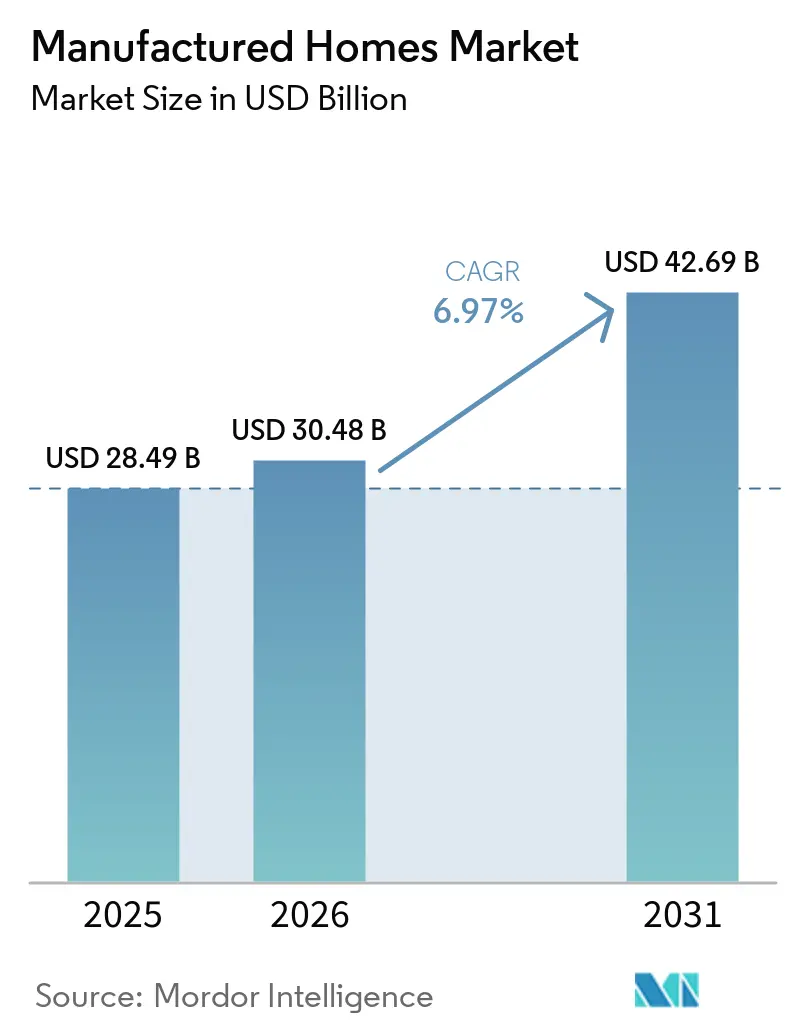
| Market Size (2026) | USD 30.48 Billion |
| Market Size (2031) | USD 42.69 Billion |
| Growth Rate (2026 - 2031) | 6.97% CAGR |
| Fastest Growing Market | Asia Pacific |
| Largest Market | North America |
| Market Concentration | Medium |
Major Players *Disclaimer: Major Players sorted in no particular order Image © Mordor Intelligence. Reuse requires attribution under CC BY 4.0. | |
Manufactured Homes Market Analysis by Mordor Intelligence
The Manufactured Homes Market size is projected to expand from USD 28.49 billion in 2025 and USD 30.48 billion in 2026 to USD 42.69 billion by 2031, registering a CAGR of 6.97% between 2026 to 2031.
Factory construction delivers a 60-65% cost edge, with the average manufactured home priced at USD 123,000 before land versus well above USD 300,000 for conventional housing, a disparity that is steering first-time buyers and downsizers toward off-site solutions. The September 2024 HUD code update, allowing up to four-unit configurations, combined with duty-to-serve financing from Fannie Mae and Freddie Mac, has positioned manufactured housing as a scalable centrepiece for workforce and build-to-rent pipelines. Shipments climbed 16% year-over-year to 103,000 units in 2024, yet remain far below the 1980s average of 247,000 units, signalling extensive latent capacity that institutional capital is beginning to unlock[1]https://www.census.gov/. Investors are increasingly attracted by predictable rent rolls, faster delivery timelines, and growing policy support in North America, Europe, and Asia-Pacific, reinforcing a favourable demand outlook despite persistent zoning and financing frictions.
Key Report Takeaways
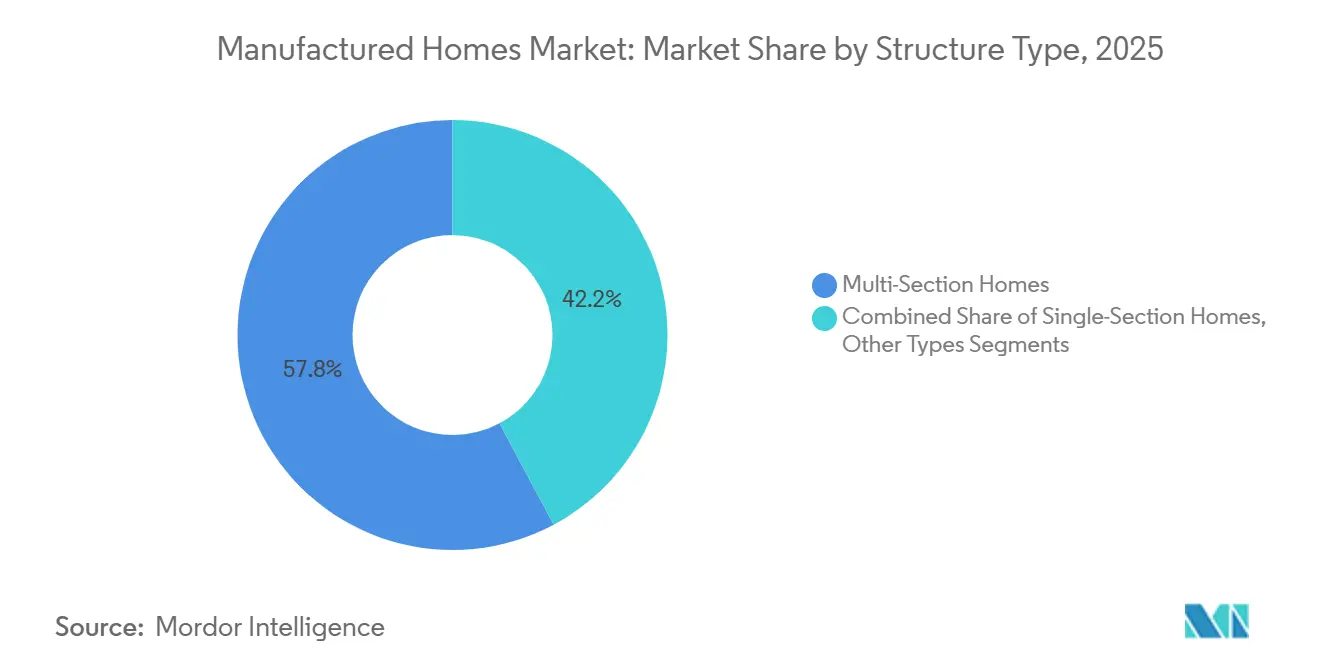
- By structure type, multi-section units held 57.8% of the manufactured homes market share in 2025, while tiny homes are forecast to expand at a 7.71% CAGR through 2031.
- By application, single-family deployments commanded 76.4% of the manufactured homes market size in 2025, whereas multi-family formats are projected to grow at a 7.95% CAGR to 2031.
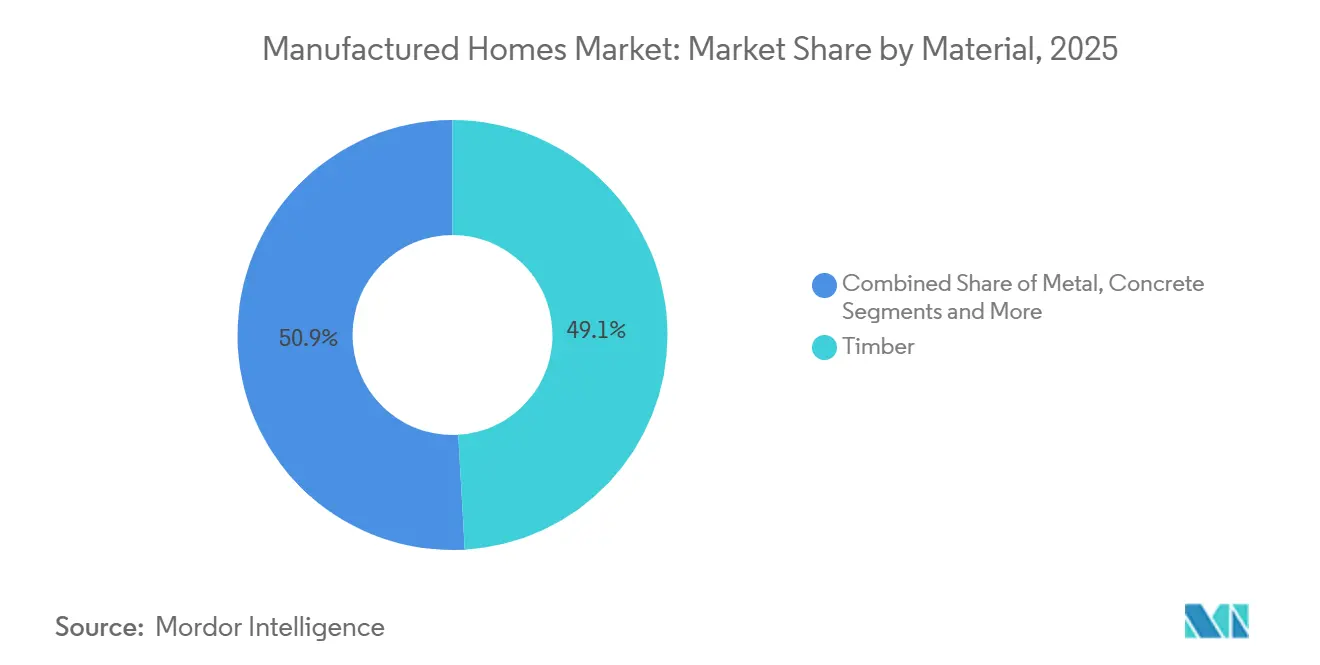
- By material, timber-framed units captured 49.1% of 2025 revenue, but concrete-based systems represent the fastest lane, advancing at an 8.11% CAGR through 2031.
- By geography, North America generated 40.8% of 2025 revenue in the manufactured homes market; Asia-Pacific is set to accelerate at an 8.77% CAGR on the back of China’s 30% prefabrication mandate and India’s affordable-housing shortfall.
Note: Market size and forecast figures in this report are generated using Mordor Intelligence’s proprietary estimation framework, updated with the latest available data and insights as of January 2026.
Global Manufactured Homes Market Trends and Insights
Drivers Impact Analysis*
| Drivers | (~) % Impact on CAGR Forecast | Geographic Relevance | Impact Timeline |
|---|---|---|---|
| Worsening housing affordability | +2.1% | Global, strongest in North America, Europe, and urban Asia-Pacific | Medium term (2-4 years) |
| Faster delivery and predictable schedules | +1.5% | North America, Europe, China, India, Australia | Short term (≤ 2 years) |
| Institutional pipelines for land-lease & BTR | +1.3% | United States, Canada, spill-over to Europe & Australia | Medium term (2-4 years) |
| Policy tailwinds expanding placement options | +1.2% | California, Texas, Oregon, Washington; maturing in parts of Europe | Medium term (2-4 years) |
| Energy-efficient, green-certified designs | +0.9% | Global, led by North America and the EU | Long term (≥ 4 years) |
| Source: Mordor Intelligence | |||
Worsening Housing Affordability Pushing Demand for Lower-Cost, Factory-Built Dwellings
Median site-built home prices topped USD 300,000 in 2024, while manufactured models averaged only USD 123,000 before land, preserving a 60% cost gap that continues to widen as labour and material inflation erode traditional affordability. The FHFA price index for manufactured homes rose 7.9% between Q2 2023 and Q2 2024, still below the 11.4% jump for site-built comparables, reinforcing the value proposition for households earning 80–120% of the area median income. In India, a 10-million-unit affordable-housing deficit is pushing state agencies and private developers toward modular builds that deliver units 40% faster, while Australia’s 106,000-home shortage is fueling double-digit growth for factory-built options. Household budgets strained by rising mortgage rates and stagnant real-wage growth are therefore redirecting demand toward the manufactured homes market. With affordability challenges expected to persist through 2031, the driver provides a structural uplift rather than a cyclical spike.
Faster Delivery and Predictable Quality/Schedule Versus Site-Built Construction
Factory-controlled production eliminates weather delays and reduces skilled-labor requirements, enabling 30–50% shorter build cycles compared with site-built housing. Daiwa House, Sekisui House, and leading U.S. suppliers report 60% completion inside the factory, shrinking on-site assembly to mere weeks, which allows developers to meet tight lease-up schedules for build-to-rent portfolios. China’s “Made in China 2025” program mandates 30% prefabrication for urban projects by 2026, with subsidies tied to modular adoption that trims construction time by nearly 40%. Predictable schedules also de-risk cost overruns; factory builds see only 5–10% budget variance versus the 20–30% typical of site projects, strengthening lender confidence. The time-saving advantage feeds directly into net present value calculations for institutional investors, making schedule certainty a meaningful catalyst for market growth.
Institutional Interest in Land-Lease Communities and Build-to-Rent (BTR) Creating Scalable Pipelines
Private-equity groups injected close to USD 10 billion into manufactured-housing communities during 2021, representing roughly one-quarter of park acquisitions in the ensuing 24 months. Blackstone’s USD 3 billion acquisition of Tricon Residential underscores the appetite for portfolios combining manufactured and site-built units that can generate stable, inflation-protected cash flows. Lot rents average USD 746 per month and are escalating 6–8% annually, creating an attractive yield profile for REITs and institutional funds. Build-to-rent developers gain 30–40% construction savings and 50% faster delivery with factory-built homes, enabling competitive rents of USD 1,200–1,800 versus USD 2,000-plus for comparable apartments. Scaling capital has begun professionalising park management, expanding utility infrastructure, and improving tenant amenities, although escalating rents raise policymaker scrutiny.
Policy Tailwinds Expanding Placement Options
HUD’s September 2024 revision of 24 CFR 3280 permits up to four-unit designs and modernises fire-safety criteria, unlocking manufactured solutions for multi-family and workforce projects. Texas Senate Bill 785, enacted in May 2025, obliges every municipality to designate at least one zone for HUD-code homes, breaking a longstanding exclusionary barrier in the nation’s fastest-growing state. California’s ADU reforms have already lifted permits from 3,000 in 2017 to more than 23,000 in 2022, with factory-built ADUs capturing a rising share thanks to week-long installation timelines. The USDA enlarged its Section 502 program in January 2025 to finance pre-owned manufactured homes, filling a crucial gap for rural borrowers. Although local boards and homeowners’ associations can still impose design or foundation constraints, the cumulative effect of state and federal reforms materially enlarges placement opportunities over the forecast horizon.
Restraints Impact Analysis*
| Restraints | (~) % Impact on CAGR Forecast | Geographic Relevance | Impact Timeline |
|---|---|---|---|
| Zoning/exclusionary ordinances and NIMBY resistance limiting sites and park expansions | -1.4% | North America (suburban U.S., Canada), Europe (UK, Germany) | Medium term (2-4 years) |
| Financing frictions—chattel loans with higher rates and limited mortgage access | -1.1% | North America (U.S., Canada), emerging in Asia-Pacific and South America | Short term (≤ 2 years) |
| Perception and appraisal gaps versus site-built homes affecting resale values and uptake | -0.8% | Global, with acute impact in North America and Europe where site-built comparables dominate | Long term (≥ 4 years) |
| Source: Mordor Intelligence | |||
Zoning/Exclusionary Ordinances and NIMBY Resistance Limiting Sites and Park Expansions
Texas had to legislate city-level zoning access via SB 785 because many municipalities still bar HUD-code homes, a reminder that land-use power remains highly localised in the United States[2]https://capitol.texas.gov/. Even progressive California imposes setback, design review, and utility-connection rules that add USD 15,000-25,000 to placements, eroding the cost advantage of factory-built ADUs. In Europe, Ilke Homes collapsed in 2024 after protracted planning delays, illustrating that modular providers can be derailed even with ample equity. Community pushback also surfaces when private-equity owners lift lot rents, prompting U.S. lawmakers to study rent-control measures, which could dampen investor appetite. Until uniform zoning reform gains momentum, siting friction will cap the manufactured homes market’s ability to recapture historical shipment peaks.
Financing Frictions—Chattel Loans with Higher Rates and Limited Mortgage Access
Chattel loans, backed by the home but not the land, carry 7–9% interest compared with 3–5% for standard mortgages, raising monthly payments by USD 150-250 on a USD 100,000 balance. Eligibility for Fannie Mae MH Advantage and Freddie Mac CHOICEHome programs requires a permanent foundation and minimum square footage, conditions that exclude many single-section units and most tiny homes. FHA Title I caps of USD 92,904 fall short of multi-section price points, while USDA’s Section 502 Direct loans apply only in rural ZIP codes, limiting urban reach. Appraisers still assume accelerated depreciation, leading to manufactured homes selling 15–25% below site-built comparables, which deters lenders from offering low-rate products. Captive finance programs from leading builders help bridge gaps but lack the scale to resolve systemic underwriting constraints in the near term.
*Our forecasts treat driver/restraint impacts as directional, not additive. The impact forecasts reflect baseline growth, mix effects, and variable interactions.
Segment Analysis
By Structure Type: Multi-Section Dominance, Tiny Homes Accelerating
Multi-section homes captured 57.8% of the manufactured homes market share in 2025, propelled by family demand for 1,200-2,000 square-foot layouts priced near USD 125,000, a sharp discount to site-built equivalents. Manufacturers such as Skyline Champion and Clayton Homes optimised 48 and 40 facilities, respectively, for multi-section output, achieving learning-curve cost advantages and strengthening distributor networks that shorten order-to-delivery windows. Financing access is also more favourable: multi-section units on permanent foundations often qualify for MH Advantage or CHOICEHome, delivering conventional rates that expand the buyer pool. Meanwhile, single-section homes priced at USD 85,000 or less remain popular among retirees and entry-level households but face mortgage barriers that restrict volume potential[3]https://www.census.gov/.
Tiny homes, grouped under “other types,” represent the fastest-growing niche with a 7.71% CAGR forecast to 2031 as remote work, minimalism, and sustainability reshape consumer preferences. Units between 200-400 square feet, often set on wheels, appeal to millennials seeking mobility and low carbon footprints. California’s AB 2782 and Oregon’s pioneering tiny-home definition give this category a clearer regulatory runway, while ADU-friendly municipalities encourage backyard placements at a cost of USD 30,000-100,000. Builders such as Tumbleweed and Escape Traveller leverage social-media marketing to tap lifestyle demand, but zoning ambiguity and insurance hurdles limit mass-market scale. Over the forecast period, multi-section dominance will persist, yet tiny homes will secure incremental share in urban infill and vacation-property subsegments.


By Application: Single-Family Leads, Multi-Family Surges
Single-family uses accounted for 76.4% of the manufactured homes market size in 2025, reflecting U.S. cultural preferences for detached ownership and the prevalence of land-lease parks. Buyers benefit from MH Advantage and CHOICEHome mortgages when a permanent foundation and land parcel are bundled in the transaction, narrowing the rate differential with site-built alternatives. Increased adoption of smart-home packages, as evidenced by Cavco’s SKYX partnership, is enhancing value perception and resale prospects. Ageing demographics further underpin demand, with downsizers attracted to single-level layouts and community amenities found in modern parks.
Multi-family formats, although smaller today, are projected to expand at a 7.95% CAGR as build-to-rent funds deploy manufactured four-plexes and duplexes sanctioned by the 2024 HUD code update. Institutional investors appreciate the 30–40% construction savings and 50% faster occupancy compared with traditional garden apartments, which boosts internal rates of return. UMH Properties, operating 144 communities at 88.1% occupancy, derives 40% of revenue from rental homes, showcasing the hybrid ownership-rental approach gathering momentum. Commercial lenders underwrite these assets on cash flow rather than consumer credit, avoiding chattel-loan constraints. As inflationary pressures curb single-family affordability in gateway metros, multi-family manufactured housing offers a scalable pathway to relieve rental shortages.
By Material: Timber’s Cost Edge, Concrete’s Resilience Premium
In the manufactured homes market timber framing maintained a 49.1% share of 2025 revenue, favoured for its light weight, established supply chains, and 20-30% lower freight costs relative to steel or concrete panels. Skyline Champion and Clayton Homes have decades-old lines calibrated for wood construction, enabling throughput efficiencies that are difficult for emerging materials to match. Cross-laminated timber is also gaining traction in the higher-end segment as buyers pay USD 10,000-15,000 premiums for certified sustainable options that store carbon.
Concrete-based systems, however, are on track to post the highest growth at an 8.11% CAGR through 2031 as wildfire and hurricane zones tighten resilience codes. Precast panels can meet 150-mph wind standards while cutting on-site labour by up to 50%, a decisive advantage amid skilled-labour shortages. CarbonCure technology further reduces concrete’s CO₂ profile by 5-7%, aligning with corporate ESG mandates. Insurers respond favorably, offering policy discounts that accelerate payback periods on the higher initial outlay. Metal framing rounds out the material mix, appealing in termite-prone regions where maintenance costs for timber have risen sharply, yet its share remains modest due to higher spot prices for steel since 2023.
Geography Analysis
North America generated 40.8% of 2025 revenue in the manufactured homes market, powered by the United States’ 103,000 unit shipments in 2024, a 16% annual jump that nonetheless leaves ample headroom versus historical peaks. Fannie Mae’s USD 70 billion duty-to-serve commitment through 2027 and private-equity inflows exceeding USD 10 billion have professionalised park operations and delivered broader financing options. Texas’s SB 785 and California’s ADU streamlining have improved zoning access, yet suburban NIMBYism and chattel-loan interest rates still hamper penetration into high-income enclaves. Canada’s colder climate raises insulation requirements, adding USD 8,000-10,000 per unit, while Mexico’s nascent mortgage infrastructure restricts throughput despite a growing urban housing deficit.
Asia-Pacific is the fastest-growing arena in the manufactured homes market, expected to advance at an 8.77% CAGR to 2031 on the back of China’s 30% prefabrication mandate for urban projects and India’s 10-million-unit affordable-housing shortfall under PM Awas Yojana. Japanese majors Sekisui House and Daiwa House have parlayed earthquake-resistant designs into a combined USD 52 billion in 2024 revenue, with Sekisui targeting net-zero energy for all Australian deliveries by 2030. Australia’s 106,000-home shortage is prompting state governments to offer modular incentives, while Indonesia and Vietnam experiment with prefab models to meet surging urban demand. Financing ecosystems remain uneven, yet governmental subsidies and rapid urbanisation underpin long-run potential.
Europe holds a smaller yet strategically significant share in the manufactured homes market. The United Kingdom’s goal of 300,000 new dwellings per year relies heavily on modular factories like Legal & General’s 550-unit Leeds plant, though Ilke Homes’ 2024 failure highlighted lingering planning bottlenecks. Germany, Scandinavia, and Austria, already accustomed to timber-frame culture, integrate factory-built systems into nearly 20% of new starts, spurred by the EU’s zero-emission mandate for 2030. Eastern Europe remains fragmented, yet rising labour costs and EU recovery-fund allocations could accelerate adoption. Outside the tri-regional core, Saudi Arabia and the UAE apply modular methods for megaprojects but lack frameworks for mass-market housing, whereas South America and Africa stay nascent due to financing hurdles and political volatility.


Competitive Landscape
Skyline Champion, Clayton Homes, and Cavco Industries collectively controlled roughly 50–55% of U.S. production in 2025, giving the manufactured homes market a mid-concentration profile. Skyline Champion’s 22% wholesale share reflects an aggressive acquisition strategy capped by its USD 328 million Regional Homes purchase, expanding reach across the U.S. Southeast. Clayton leveraged Berkshire Hathaway's backing to add a USD 42 million Conway, Arkansas, plant that lifts annual capacity by 3,000 units and introduces solar-ready roofs under its eBuilt label. Cavco, operating at 75% capacity in Q1 2026, teamed with SKYX Technologies to embed plug-and-play smart-lighting kits, differentiating offerings in an increasingly commoditised field.
Second-tier manufacturers—Fleetwood, Palm Harbor, Commodore, Deer Valley, Nobility, Kit Custom, Sunshine, TruMH—preserve regional flavours and often specialise in niche formats such as oil-patch workforce housing or premium log cabins. The cost of retooling for concrete or steel framing (USD 5-10 million per facility) slows material diversification, giving startups that focus solely on resilient structures an entry window. Japanese players Sekisui House and Daiwa House study North American market entry via joint ventures that transfer earthquake-ready and net-zero know-how, while European modular builders Legal & General and Honkarakenne test export channels through dealer networks in Florida and Texas..
Technology integration is a unifying theme in the manufactured homes market. Cavco’s SKYX tie-up targets tech-savvy buyers with USD 2,000-5,000 smart bundles; Skyline Champion’s lending arm with Triad Financial and ECN Capital seeks to mitigate chattel frictions; and Clayton pilots blockchain-based supply-chain tracking to certify sustainable timber sources. ESG compliance offers a new battleground: Energy Star Version 2.0, DOE Zero Energy Ready, and forthcoming microgrid-ready certifications could yield pricing premiums for early adopters. Rapid consolidation, however, raises antitrust scrutiny and may provoke state-level interventions if lot-rent inflation erodes perceived affordability.
Manufactured Homes Industry Leaders
Clayton Homes (Berkshire Hathaway)
Skyline Champion Corporation
Cavco Industries
Fleetwood Homes
Palm Harbor Homes
- *Disclaimer: Major Players sorted in no particular order

Recent Industry Developments
- June 2025: FullStack Modular activated a 130,000-square-foot plant in Carson, California. The new line adds West Coast capacity for mid- and high-rise modular projects and brings 140 skilled jobs to the region.
- June 2025: Frontier Housing began producing DreamBuild units from a 55,000-square-foot facility in Martin County, Kentucky. Management expects to recruit 40 workers within two years as demand for affordable modular homes accelerates.
- May 2025: GMF Group closed its second fund at roughly USD 250 million. Proceeds are earmarked for 43 manufactured-housing community acquisitions in North Carolina and Florida, plus five additional sites under contract across the Midwest and Southeast.
- March 2025: Cavco Industries unified all subsidiary labels under the single Cavco brand, simplifying marketing and operations across its 27-plant network.


Global Manufactured Homes Market Report Scope
Manufactured homes are built as dwelling units of at least 320 square feet with a permanent chassis to assure the initial and continued transportability of the home. The requirement to have a wheeled chassis permanently attached differentiates manufactured housing from other types of prefabricated homes, such as modular homes. The manufactured homes market is segmented by type (single-family and multi-family) and by geography (North America [US, Canada, and Mexico], Europe [Germany, UK, France, Italy, Spain, and the rest of Europe], Asia-Pacific [India, China, Japan, and Rest of the Asia-Pacific], and the Rest of the World [Latin America, and the Middle East and Africa]). The report offers market size and forecast values (USD billion) for all the above segments.
By Structure Type
| Single-Section Homes |
| Multi-Section Homes |
| Other Types |
By Application
| Single Family |
| Multi Family |
By Material
| Timber |
| Metal |
| Concrete |
| Others |
By Geography
| North America | United States |
| Canada | |
| Mexico | |
| South America | Brazil |
| Argentina | |
| Chile | |
| Rest of South America | |
| Europe | United Kingdom |
| Germany | |
| France | |
| Italy | |
| Spain | |
| Netherlands | |
| Rest of Europe | |
| Middle East and Africa | Saudi Arabia |
| United Arab Emirates | |
| South Africa | |
| Nigeria | |
| Rest of Middle East and Africa | |
| Asia-Pacific | China |
| India | |
| Japan | |
| South Korea | |
| Australia | |
| Indonesia | |
| Rest of Asia-Pacific |
| By Structure Type | Single-Section Homes | |
| Multi-Section Homes | ||
| Other Types | ||
| By Application | Single Family | |
| Multi Family | ||
| By Material | Timber | |
| Metal | ||
| Concrete | ||
| Others | ||
| By Geography | North America | United States |
| Canada | ||
| Mexico | ||
| South America | Brazil | |
| Argentina | ||
| Chile | ||
| Rest of South America | ||
| Europe | United Kingdom | |
| Germany | ||
| France | ||
| Italy | ||
| Spain | ||
| Netherlands | ||
| Rest of Europe | ||
| Middle East and Africa | Saudi Arabia | |
| United Arab Emirates | ||
| South Africa | ||
| Nigeria | ||
| Rest of Middle East and Africa | ||
| Asia-Pacific | China | |
| India | ||
| Japan | ||
| South Korea | ||
| Australia | ||
| Indonesia | ||
| Rest of Asia-Pacific | ||


Key Questions Answered in the Report
What is the current value of the manufactured homes market?
The manufactured homes market size reached USD 30.48 billion in 2026 and is forecast to grow to USD 42.69 billion by 2031.
How fast is the sector expected to expand?
The market is projected to register a 6.97% CAGR over the 2026-2031 period as affordability concerns redirect buyers toward factory-built options.
Which structure type dominates sales?
Multi-section units held 57.8% of 2025 revenue, favored for their 1,200-2,000 square-foot layouts at significantly lower prices than site-built homes.
Why are institutional investors interested in manufactured housing?
Land-lease communities and build-to-rent portfolios provide predictable cash flows, 30-40% construction savings, and faster delivery, factors that enhance yields for private-equity and REIT investors.
What policy changes most benefit the sector?
HUD’s 2024 code update permitting four-plex designs and state-level zoning reforms such as Texas SB 785 expand placement options and stimulate multi-family deployments.
How do financing terms differ from conventional mortgages?
Buyers using chattel loans often face 7–9% rates compared with 3–5% for standard mortgages, although MH Advantage and CHOICEHome programs provide conventional financing when the home is placed on a permanent foundation.
Page last updated on:


