
Mannitol Market Size and Share
Market Overview
| Study Period | 2021 - 2031 |
|---|---|
| Market Size (2026) | USD 498.2 Million |
| Market Size (2031) | USD 638.03 Million |
| Growth Rate (2026 - 2031) | 5.08 % |
| Fastest Growing Market | Asia Pacific |
| Largest Market | North America |
| Market Concentration | Medium |
Major Players *Disclaimer: Major Players sorted in no particular order Image © Mordor Intelligence. Reuse requires attribution under CC BY 4.0. | |
Mannitol Market Analysis by Mordor Intelligence
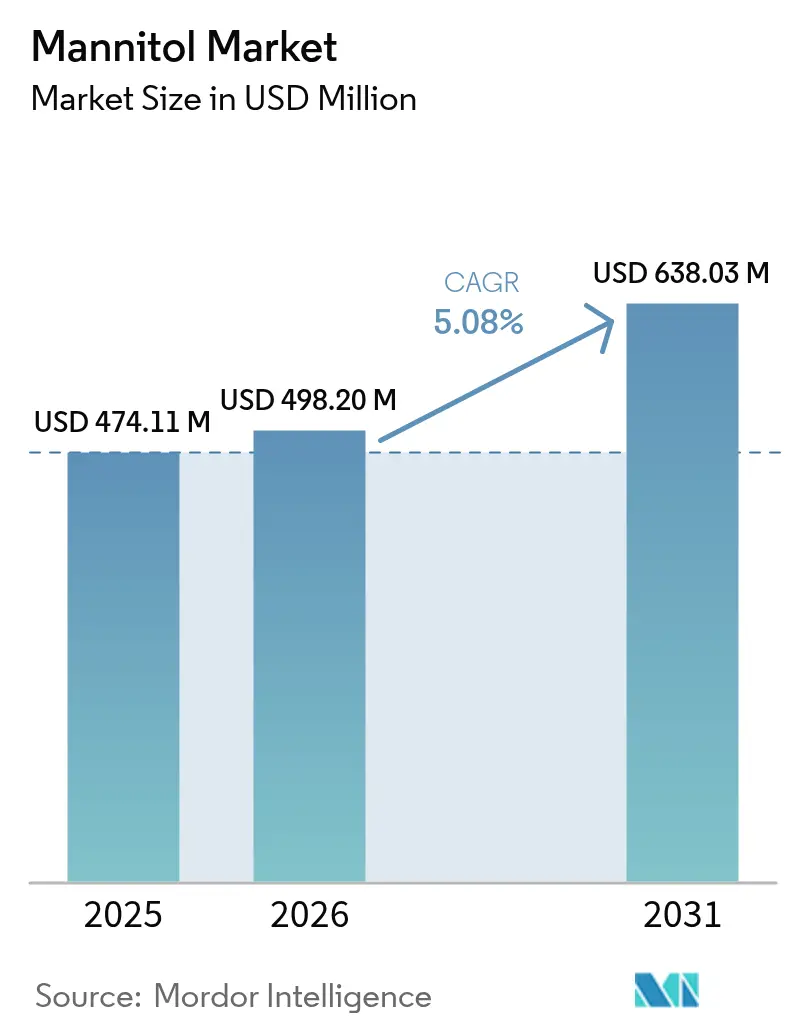
The mannitol market size was valued at USD 474.11 million in 2025 and estimated to grow from USD 498.2 million in 2026 to reach USD 638.03 million by 2031, at a CAGR of 5.08% during the forecast period (2026-2031). This steady expansion reflects the increasing adoption of mannitol across pharmaceutical excipient applications and food industry sugar reduction initiatives, driven by regulatory pressures and evolving consumer preferences for healthier alternatives. Pharmaceutical formulators require stable, non-hygroscopic excipients, while food manufacturers demand low-calorie bulk sweeteners to align with global sugar-reduction mandates. This intersection presents a significant growth opportunity. Additionally, rapid regulatory developments, such as the European Medicines Agency's revised variations framework effective January 2025, are driving manufacturers to focus on ingredients with strong, multi-jurisdictional compliance records. Rising diabetes prevalence is further shifting consumer preferences toward sugar-free products, fueling demand. Strategic acquisitions by Roquette and Ingredion emphasize the competitive push to integrate scale, specialty-grade offerings, and regulatory expertise to serve both pharmaceutical and food industries effectively.
Key Report Takeaways
- By form, powder accounted for 63.12% of the Mannitol market share in 2025 while granules post the fastest 6.2% CAGR through 2031.
- By application, food and beverages led with 42.31% revenue share in 2025; pharmaceuticals are forecast to expand at a 6.41% CAGR to 2031.
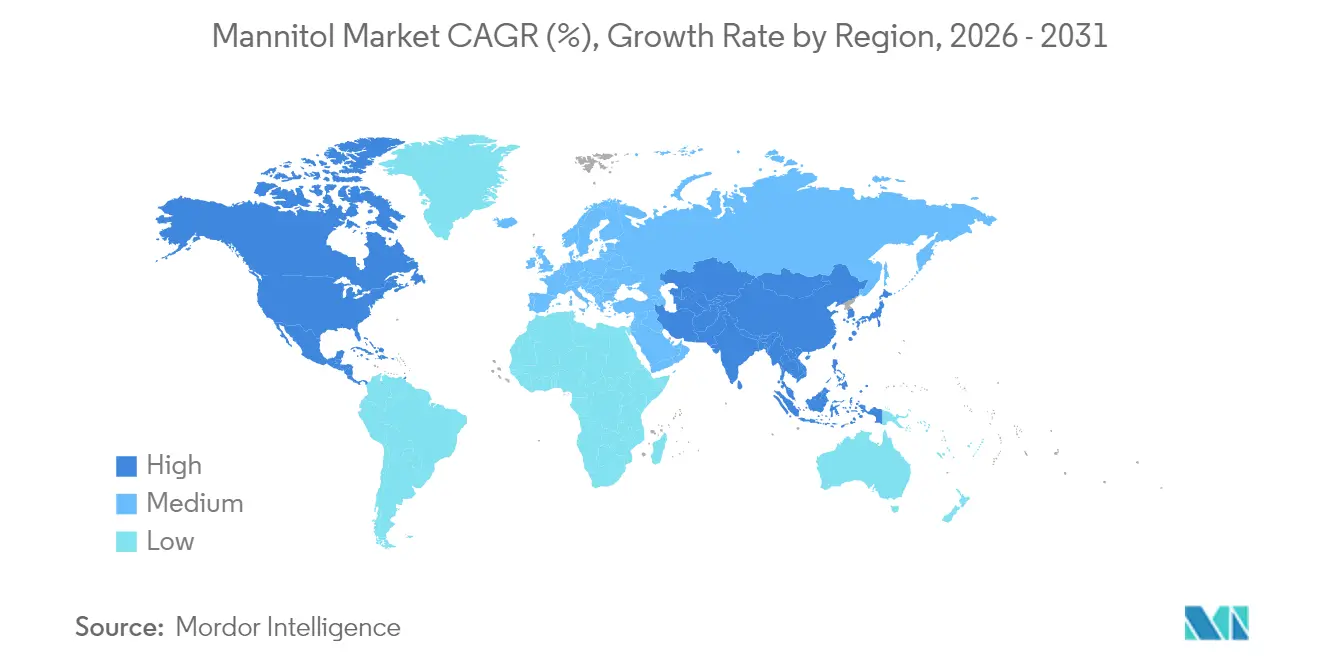
- By geography, North America held 35.12% of the Mannitol market size in 2025, whereas Asia-Pacific records the quickest 6.05% CAGR to 2031.
Note: Market size and forecast figures in this report are generated using Mordor Intelligence’s proprietary estimation framework, updated with the latest available data and insights as of 2026.
Market Trends and Insights
Drivers Impact Analysis of Mannitol Market*
| Driver | (~) % Impact on CAGR Forecast | Geographic Relevance | Impact Timeline |
|---|---|---|---|
| Growing demand for low-calorie sweeteners in food and beverages | +1.2% | Global, with the strongest impact in North America and Europe | Medium term (2-4 years) |
| Rising diabetic population driving sugar-free product adoption | +0.9% | Global, particularly Asia-Pacific and North America | Long term (≥ 4 years) |
| Increased use of mannitol as a bulking agent in pharmaceuticals | +1.1% | North America, Europe, and Asia-Pacific manufacturing hubs | Medium term (2-4 years) |
| Superior stability and non-hygroscopic nature favoring formulations | +0.8% | Global pharmaceutical manufacturing regions | Long term (≥ 4 years) |
| Surging demand of mannitol as an excipient in tablet and capsule manufacturing | +1.3% | Asia-Pacific, North America, Europe | Short term (≤ 2 years) |
| Global focus on reducing sugar consumption encouraging polyyol use | +1.0% | Global, led by developed markets | Medium term (2-4 years) |
| Source: Mordor Intelligence | |||
Growing demand for low-calorie sweeteners in food and beverages
Leading corporations, such as PepsiCo, are driving the food industry's transition toward sugar reduction as a strategic business initiative. PepsiCo has set a target to ensure that 67% of its beverages deliver 100 calories or fewer from added sugars by 2025. This approach goes beyond regulatory compliance, positioning companies to gain a competitive edge. According to industry data, 96% of food and beverage businesses in Asia are prioritizing reformulation efforts to align with this trend[1]Source: ASEAN Food & Beverage Alliance, “The Reformulation Challenge”, www.afba.co. Mannitol, a multifunctional ingredient, offers manufacturers the ability to reduce caloric content while preserving product texture, addressing the dual objectives of taste retention and health-focused positioning. In Germany, the National Reduction and Innovation Strategy mandates a 20% reduction in sugar for breakfast cereals and a 15% reduction for soft drinks by 2025, creating regulatory momentum for the adoption of polyols[2]Source: Federal Ministry of Food and Agriculture, “The National Reduction and Innovation Strategy for Sugar, Fats and Salt in Processed Foods”, www.bmel.de. The alignment of consumer demand with regulatory pressures underscores the growing need for scalable solutions that can be implemented across diverse product categories and regulatory frameworks.
Rising diabetic population driving sugar-free product adoption
As healthcare systems face escalating treatment costs, the WHO's Global Diabetes Compact highlights the critical importance of dietary interventions to address the growing global diabetes crisis. This challenge is driving innovation in food formulation strategies, expanding beyond traditional diabetic-specific products to mainstream offerings, with sugar-free alternatives capturing a larger market share. Saudi Arabia and the UAE have implemented a 50% excise tax on sugar-sweetened beverages, a policy expected to significantly reduce childhood obesity rates by 2030[3]Source: World Health Organization, “A review of sugar-sweetened beverages taxation in Saudi Arabia and United Arab Emirates,” who.int. Mannitol, with its metabolic profile requiring minimal insulin response, is strategically positioned to benefit from increasing diabetes prevalence, particularly in developing markets undergoing rapid dietary transitions. The WHO's June 2024 warning about counterfeit diabetes medications further underscores the urgent need for reliable and accessible dietary management solutions.
Increased use of mannitol as a bulking agent in pharmaceuticals
The pharmaceutical manufacturing industry is advancing toward complex drug delivery systems, driving demand for multifunctional excipients that ensure stability under diverse storage conditions. The European Medicines Agency's revised variation regulations, effective January 2025, highlight the sector's shift toward sophisticated formulation strategies. With production increasingly moving to the Asia-Pacific region, manufacturers are focusing on stability in humid climates, where mannitol's non-hygroscopic properties offer a competitive advantage by simplifying formulations while maintaining product integrity. WuXi STA's launch of a 169-acre API facility in China, operational since January 2024, reflects the industry's strategic move toward cost-efficient manufacturing hubs. Additionally, the WHO's updated GMP guidelines for excipients emphasize quality management and risk assessment, creating opportunities for suppliers with strong compliance capabilities. This regulatory focus on excipient quality, coupled with the regionalization of manufacturing, positions globally compliant mannitol suppliers to capture significant market value.
Superior stability and non-hygroscopic nature favoring formulations
The pharmaceutical industry's transition to biologics and complex molecules has heightened the importance of excipient selection. Traditional formulation methods often fail to ensure drug stability and bioavailability. Mannitol, known for its crystalline structure and moisture resistance, offers strategic advantages in formulations, particularly in environments where humidity control is either difficult or costly. This is increasingly relevant as manufacturing operations expand into tropical and subtropical regions. The European Pharmacopoeia's Supplement 11.7, requiring CEP holders to update applications by April 2025, highlights the regulatory focus on maintaining quality standards in a globalized supply chain. The Ministry of Chemicals and Fertilizers underscores the critical need for consistent quality across diverse climatic conditions. As manufacturing shifts geographically and regulatory demands increase, excipients capable of maintaining performance across varied environmental conditions, without relying on advanced packaging or storage solutions, are positioned for competitive advantage.
Restraints Impact Analysis of Mannitol Market*
| Restraint | (~) % Impact on CAGR Forecast | Geographic Relevance | Impact Timeline |
|---|---|---|---|
| Potential laxative effect at higher dosages limiting consumption | -0.7% | Global, particularly in food applications | Medium term (2-4 years) |
| Regulatory limitation on daily intake in food and beverage | -0.5% | Europe, North America, Asia-Pacific | Long term (≥ 4 years) |
| Volatility in raw material supply | -0.6% | Global, with acute impact on seaweed-dependent regions | Short term (≤ 2 years) |
| Unpleasant aftertaste reported in certain applications | -0.4% | Global food and beverage applications | Medium term (2-4 years) |
| Source: Mordor Intelligence | |||
Potential laxative effect at higher dosages limiting consumption
The physiological limitations of polyol consumption impose a natural cap on market growth, which cannot be addressed through technological advancements or marketing efforts. This inherently restricts mannitol's addressable market within food applications. The FDA, under 21 CFR 180.25, requires labeling warnings indicating that excessive consumption may cause laxative effects. This regulatory mandate reflects the scientific consensus on polyol tolerance thresholds. While individual tolerance levels vary, market strategies must consider the most sensitive consumers. The European Food Safety Authority is currently reassessing mannitol (E 421) as a sweetener, with a focus on these tolerance levels, which could lead to stricter usage regulations. Unlike other market challenges that can be mitigated through innovation or supply chain improvements, the laxative effect represents a biological constraint that directly impacts product formulation strategies and consumer acceptance across all applications.
Regulatory limitation on daily intake in food and beverage
Global food safety regulations pose significant compliance challenges for businesses. These challenges extend beyond ingredient approvals to include usage levels, labeling requirements, and application-specific restrictions, which vary widely across regions. For instance, China's planned implementation of the GB 2760-2024 food additive standard in February 2025 highlights how regulatory updates can impact market dynamics by altering permitted usage levels and application categories. Additionally, the WHO's Joint FAO/WHO Expert Committee on Food Additives continues to review acceptable daily intake levels for polyols, with their decisions influencing global trade and product formulation strategies. However, regulatory frameworks often lag behind scientific advancements and market demands, leading to commercially restricted applications due to outdated safety assessments or conservative regulatory approaches. This challenge is further amplified for companies operating in multiple markets, where the strictest jurisdiction dictates global product specifications, thereby limiting innovation and market expansion opportunities.
*Our forecasts treat driver/restraint impacts as directional, not additive. The impact forecasts reflect baseline growth, mix effects, and variable interactions.
Mannitol Market Segment Analysis
By Form:
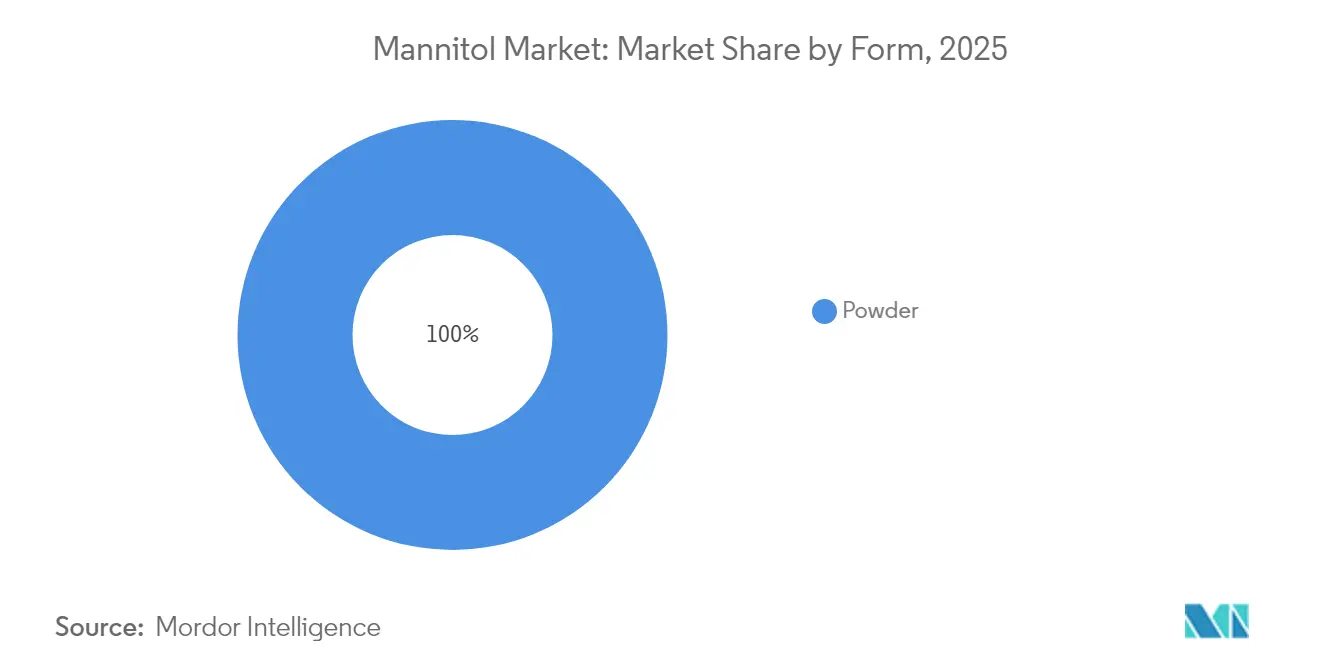
Powder Dominance Drives Manufacturing EfficiencyPowder presently captures 63.12% of Mannitol market share in 2025, reflecting its compatibility with large-scale blending and automated feeding systems in both drug and food facilities. Powder forms allow continuous processing lines to meter excipients precisely, trimming downtime and validating batch uniformity under strict GMP audits. Granular mannitol enjoys the highest 6.2% CAGR as tablet makers adopt direct compression technologies that cut costly wet granulation steps. The Mannitol market size for granules is forecast to enlarge robustly alongside investment in oral-solid-dose capacity across India and China. Suppliers that offer consistent particle distribution for both forms gain leverage with multi-plant customers seeking single-specification procurement.
The pharmaceutical sector increasingly favors powder grades for dry-powder inhalers and lyophilized biologics, where flowability and low hygroscopicity are critical. In beverages, powder remains preferred because it dissolves rapidly, minimizing production cycles. Granules, however, support chewable tablets and sustained-release matrices thanks to improved compressibility. Regulatory scrutiny under revised EMA variations guidelines pushes manufacturers to validate each form separately, so dual-platform suppliers can unlock cross-selling gains. As a result, form flexibility will remain a competitive pivot inside the broader Mannitol market.



By Application:
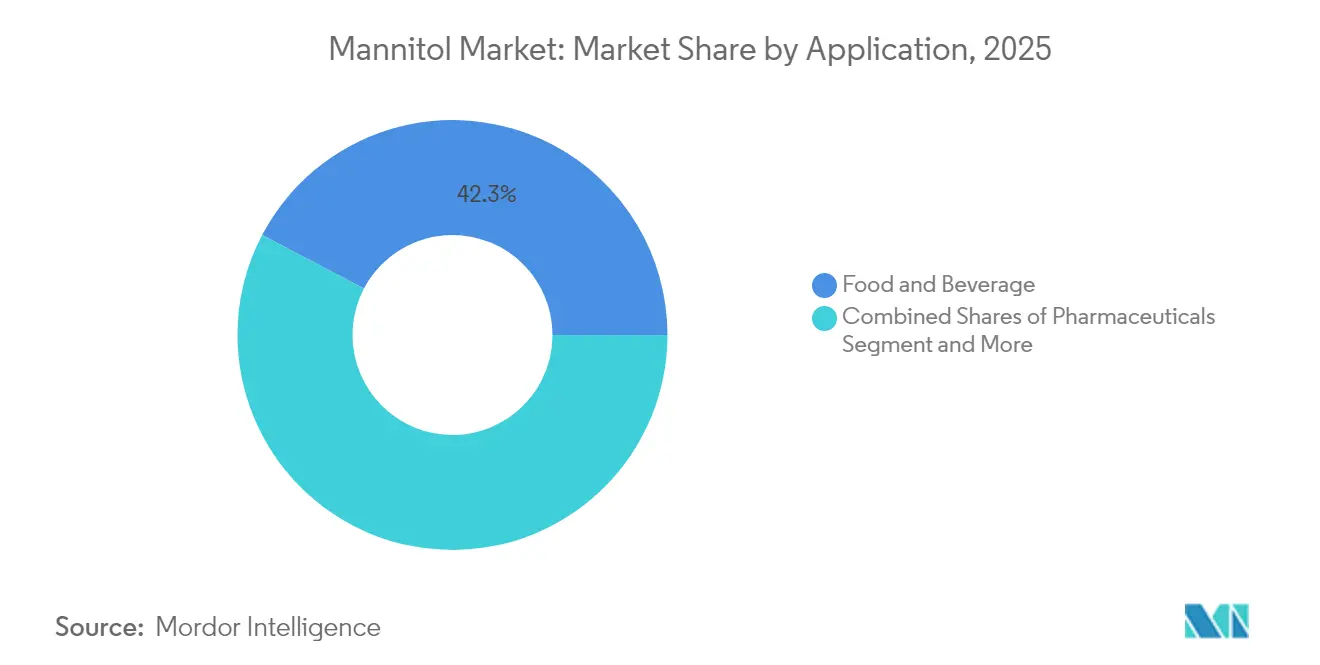
Pharmaceuticals Accelerate Past Food DominanceFood and beverages accounted for 42.31% of revenue in 2025, while the pharmaceutical segment is growing faster at a 6.41% CAGR and is expected to overtake food and beverages by mid-decade. Drug makers value mannitol’s osmotic properties in parenteral formulations and its stability in high humidity, elevating average selling prices compared with food grades. The pharmaceutical industry focuses on continuous manufacturing and advanced therapies like biologics, further embeds mannitol into next-generation dosage forms. As the pharmaceutical sector expands, mannitol's role is becoming increasingly pivotal. This shift underscores the evolving dynamics of the mannitol market, with pharmaceuticals taking center stage.
Industrial and other application uses show steady but slower increments, capturing niche needs in personal care scrubs and fermentation broths. However, food-industry headwinds such as dosage limits and digestive tolerance create a ceiling, whereas pharmaceutical applications face fewer physiological constraints. The Mannitol industry therefore, sees margin expansion driven by specialized drug-grade material even as volume from confectionery remains sizable. While the food sector grapples with limitations, the pharmaceutical realm offers broader horizons. This divergence in application underscores the shifting balance of mannitol's market demand.
Geography Analysis
North America and APAC Mannitol Market
North America contributed 35.12% of 2025 revenue, anchored by sophisticated drug-delivery research and widespread availability of reduced-sugar snacks. FDA initiatives around excipient traceability may tighten approved-supplier lists, favoring incumbent producers with transparent chains. Canada and Mexico add incremental demand through cross-border pharmaceutical supply lines and joint labeling rules that recognize mannitol’s safe history in foods. Asia-Pacific expands fastest at 6.05% CAGR through 2031, reflecting investments in excipient hubs and escalating consumption of sugar-free foods among swelling middle-class populations.. China’s new additive code boosts confidence in local applications, while Southeast Asian governments adopt sugar levies that nudge formulators toward polyols. This region’s combined pull from manufacturing and consumer sides underpins future Mannitol market gains.
Europe Mannitol Market
Europe balances tight regulatory oversight with high purchasing power, sustaining premium prices for pharma-grade material. EFSA’s ongoing re-evaluation of mannitol will shape future usage caps but also signals a commitment to science-based regulation that industry can plan around. National strategies such as Germany’s sugar-reduction roadmap create stable demand in processed cereals and beverages. Eastern European contract-manufacturing clusters further augment regional volumes as they supply the broader European Economic Area.
MEA and South America Mannitol Market
South America and the Middle East and Africa trail in absolute size, yet offer upside tied to rising urbanization and evolving diet patterns. Brazil’s large confectionery sector already uses mannitol in niche products, and Gulf Cooperation Council sugar taxes create early mover opportunities for local beverage bottlers. As regulatory frameworks converge with Codex Alimentarius, cross-regional trade in mannitol-containing goods should expand, enhancing visibility of the Mannitol market in emerging economies.

Regulatory Landscape
Mannitol is broadly permitted as a food additive across major markets, but conditions of use and labeling rules differ by jurisdiction. In the United States, the FDA lists mannitol (CAS 69-65-8) under 21 CFR 180.25, including specific use-level limits across categories (for example, higher allowances in certain confections and lower limits in chewing gum and soft candy), and requires the label statement "Excess consumption may have a laxative effect" when reasonably foreseeable intake reaches 20 g/day. These requirements shape formulation ceilings and package-claim strategies for higher-consumption formats such as candies and gums.
In Europe and the United Kingdom, mannitol is authorized as E 421 within the polyols group under the food additive framework (retained/assimilated Regulation (EC) 1333/2008 and related implementing/specification rules), with quantum satis applying for some functions other than sweetening. EFSA continues its sweeteners workstream, which includes re-evaluation activities relevant to polyols, keeping tolerance and conditions-of-use under regulatory watch for EU-facing brands. In Great Britain, updated government guidance published in June 2026 reaffirmed E 421 authorization, supporting continuity for manufacturers supplying UK retail and OTC channels that rely on stable additive listings.
Value Chain Analysis
The mannitol value chain starts with carbohydrate feedstocks and processing inputs, then splits into food-grade and pharmaceutical excipient-grade pathways governed by different quality systems. Upstream, producers typically source glucose and fructose-rich syrups derived from corn or sugar, along with hydrogen and catalysts (commonly nickel), then run hydrogenation followed by purification, crystallization, drying, and milling or agglomeration to reach powder or granular specifications. Particle engineering and moisture control are key differentiators, because downstream users in direct-compression tablets and sugar-reduced confectionery require consistent flow, compressibility, and sensory performance.
Downstream, distribution moves through ingredient distributors and direct supply to large food manufacturers and pharmaceutical formulators, with documentation and compliance acting as a gating factor for higher-margin pharma volumes. Harmonized additive identifiers (INS 421 / E 421) support global trade, but the chain still requires region-specific labeling and compliance controls, including the US laxative-warning threshold at 20 g/day and jurisdictional rules for permitted uses. This drives many buyers toward dual-application inventory strategies (food and pharma compatible specifications) and increases the importance of validated packaging, traceability, and third-party audits across storage and distribution.
Competitive Landscape
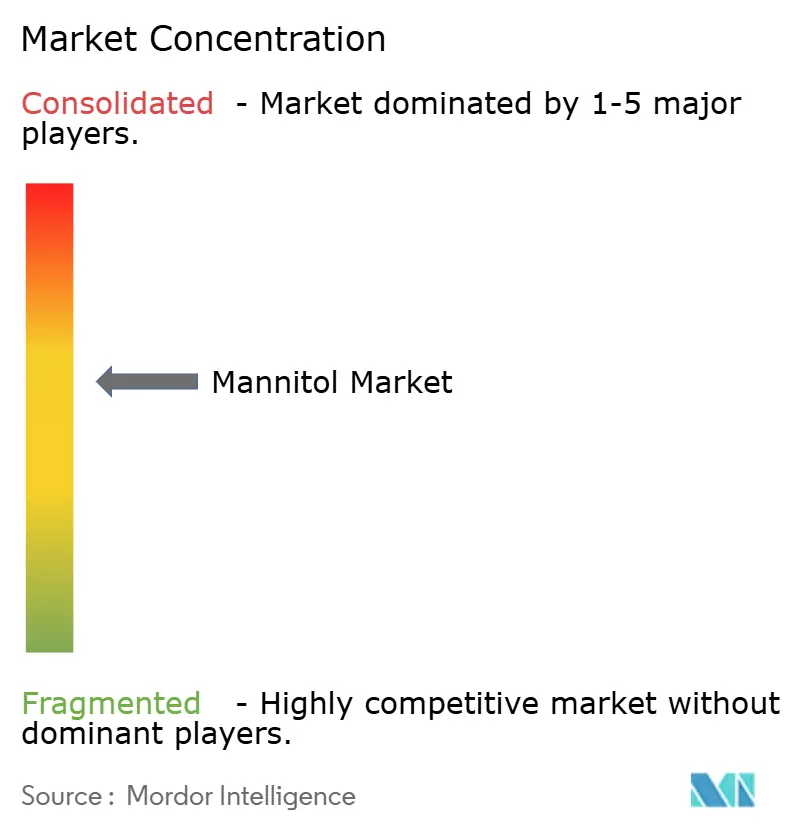
The mannitol market is a moderately concentrated market with the presence of various large and small regional players. Leading manufacturers in the artificial sweetener market are using advanced technologies to provide safe, affordable, and efficient artificial sweeteners. Moreover, due to the extensive use of mannitol in pharmaceutical and chemical applications, the manufacturers have enlarged the production scales due to the high demand. The major players include Roquette Frères, Cargill Incorporated, Bright Moon Seaweed Group, Ingredion Incorporated, and Merck KGaA.
Technological investment centers on continuous crystallization, real-time release testing, and digital batch records that satisfy EMA and FDA expectations for data integrity. These capabilities lower conversion costs and expedite regulatory filings, creating competitive barriers. Smaller regional players differentiate through agility and tailored grades but face scaling hurdles in meeting multinational audit standards. Government incentives, like India’s PLI scheme, can tilt the field by subsidizing capacity expansion for qualified producers, potentially altering share distribution over the next five years.
Opportunities revolve around biologics stabilizers and 3-D printed oral solid forms where mannitol’s flow and thermal characteristics fit emerging production technologies. As the pharmaceutical landscape evolves, these niches present lucrative avenues for growth. However, market entrants aiming at these niches must pair application support with global quality dossiers to bypass trial-and-error costs for pharmaceutical clients. This strategic alignment not only streamlines processes but also enhances trust with clients. Overall, competitive advantage leans heavily on regulatory fluency and consistent global specifications rather than novel chemistry, making mergers a preferred route to faster market coverage. In this dynamic environment, agility and foresight are paramount for sustained success.
Mannitol Industry Leaders
Roquette Frères
Cargill, Incorporated.
Bright Moon Seaweed Group
Ingredion Incorporated
Merck KGaA
- *Disclaimer: Major Players sorted in no particular order
Mannitol Market Companies Covered in this Report
- Roquette Freres
- Cargill, Incorporated.
- Bright Moon Seaweed Group
- Ingredion Incorporated
- Merck KGaA
- SPI Pharma
- Rongde Seaweed Co.
- Shijiazhuang Huaxu Pharma
- Singsino Group
- Archer Daniels Midland
- ZuChem Inc.
- BASF SE
- Mitsubishi Shoji Foodtech
- Qingdao Xuyang Biochem
- Associated British Foods (ABF)
- Zhejiang Huakang Pharma
- B. Braun Medical
- Anhui BBCA Biochemical
- TCI America
- Spectrum Chemical

Market Opportunities and Future Outlook
Cross-compliance and dual-certified supply stand out as an opportunity, given that mannitol sits at the intersection of food sugar reduction and pharmaceutical excipient demand. As regulators and buyers scrutinize additive compliance and documentation, suppliers that can support multi-standard specifications (food additive compliance plus pharma excipient quality systems) gain leverage with multinational accounts looking to reduce SKU complexity. A concrete signal is the April 2026 EXCiPACT GMP and GDP certification awarded (via SGS) to Mannitab Pharma Specialities Pvt. Ltd., which aligns with buyer preference for independently verified quality management across manufacturing and distribution for excipients used in regulated dosage forms.
Product-format and application expansion is also visible in co-processed and functionally differentiated mannitol excipients, which address formulation challenges such as compressibility and stability in sensitive actives, probiotics, and pediatric dosing formats. Roquette has been publishing and promoting PEARLITOL-branded mannitol solutions in 2026 for higher API loading, pediatric mini-tablets, and co-processed mannitol-starch stability use cases, reflecting a shift toward application support alongside brand-led differentiation. In parallel, the ongoing EFSA sweeteners workstream and the US labeling threshold for laxative-effect warnings keep formulation discipline central for food brands, sustaining demand for technical services that help customers optimize inclusion levels, labeling, and sensory outcomes within regional rules.
Recent Industry Developments in Mannitol Market
- June 2026: Roquette launched the NEOSORB AG agriscience range, described as a plant-based multifunctional polyol containing 10% mannitol, extending mannitol-linked offerings beyond traditional food and pharma uses. The product broadens Roquette's addressable applications for polyols and strengthens its positioning in adjacent end markets where formulation performance and sustainability messaging are both purchasing criteria.
- May 2026: Riddhi Siddhi Gluco Biols Ltd. completed the acquisition of Cargill India's corn wet milling facility in Davangere, Karnataka. The transaction reshapes regional starch and sweetener infrastructure, with implications for feedstock integration and potential availability dynamics for polyol value chains that depend on carbohydrate processing assets.
- September 2024: Tonix Pharmaceuticals continued exploration of mannitol as an excipient in its formulation programs, underscoring ongoing application of mannitol in specialized oral delivery platforms. This activity points to continued demand for well characterized excipient grades to support complex dosage forms and regulatory-ready development pipelines.


Mannitol Market Report Scope and Research Methodology
Market Definition and Coverage
This market covers the revenue generated from mannitol sold as a specialty polyol used as an excipient and sweetening or functional ingredient across end-use industries, tracked across major producing and consuming regions with consistent USD reporting.
Scope exclusions: We exclude downstream finished products where mannitol is only an ingredient, along with internal transfer pricing inside integrated groups when it is not reflected as an external sale.
Segments Covered in This Report
- By Form
- Granules
- Powder
- By Application
- Food and Beverage
- Pharmaceuticals
- Industrial
- Others
- By Geography
- North America
- United States
- Canada
- Mexico
- Rest of North America
- Europe
- Germany
- United Kingdom
- Italy
- France
- Spain
- Netherlands
- Rest of Europe
- Asia-Pacific
- China
- India
- Japan
- Australia
- Indonesia
- Rest of Asia-Pacific
- South America
- Brazil
- Argentina
- Rest of South America
- Middle East and Africa
- South Africa
- Saudi Arabia
- United Arab Emirates
- Rest of Middle East and Africa
- North America
Data Sources, Market Sizing, and Validation
Desk Research
Desk work starts by building a clean fact base around mannitol demand pools and supply availability, since public data is often scattered across food, pharma, and industrial statistics. We lean on sources such as the US FDA (inactive ingredient and excipient references), the European Medicines Agency, the US International Trade Commission trade data, UN Comtrade, and peer reviewed papers that discuss polyols and excipient use in formulations.
After that, we cross-check the story using company annual reports, investor presentations, product specification sheets, and reputable press coverage on capacity additions and qualification trends. Where helpful, a paid subscription for company financials and intelligence and a shipment-level import and export database are used to validate who is shipping, in what direction, and whether volumes line up with the modeled demand. The sources named above are illustrative, and many other public and paid references were also used for data collection, validation, and clarification.
Primary Interviews and Surveys
Primary inputs come from interviews and structured surveys with manufacturers, distributors, formulators, and procurement teams that buy polyols or excipients, which is where we confirm real-world pricing behavior and substitution patterns. For a global market like mannitol, we cover APAC, EMEA, and the Americas so regional differences in pharma qualification, food labeling, and industrial uptake can be reflected, and then assumptions are adjusted where repeated feedback shows a consistent gap.
Distribution of primary research fieldwork respondents
| Company type | Respondent position | Region |
|---|---|---|
| Top tier: 28% | CXOs: 20% | APAC: 47% |
| Mid tier: 52% | Functional/Unit leaders: 36% | EMEA: 32% |
| Smaller Players: 20% | Managers: 44% | Americas: 21% |
Market-Sizing & Forecasting
Sizing is built using a top-down approach where production and trade signals are used to reconstruct regional apparent consumption, which is then aligned to end-use pull from pharmaceuticals, food and beverage, and industrial uses. To keep the numbers realistic, we corroborate totals with selective bottom-up approximations such as sampled supplier revenue disclosure where available, channel checks on typical distributor markups, and an ASP x volume sense-check for the main forms.
A few practical inputs that shape the model include the split between powder and granules, the share of demand tied to excipient use versus food applications, export intensity by region, typical price bands by grade and pack size, and the pace at which pharma qualifications expand for oral solid doses and other formulations. When direct volume visibility is weak in a country, we bridge the gap using nearby trade flows and end-use proxies, and then we pressure-test those bridges during calls.
Forecasts are generated using scenario analysis supported by short-run time series smoothing on key drivers, so the outlook reflects what respondents expect for capacity utilization, regulation driven reformulation, and pharmaceutical pipeline related excipient demand. The final series is kept in USD with consistent currency timing to avoid mixing different exchange-rate snapshots across years.
Data Validation & Update Cycle
Validation is done through triangulation across the model, trade and production signals, and what we hear from suppliers and buyers, followed by variance checks at the regional and application level. When a region shows an unusual jump, we re-check unit assumptions, price moves, and the implied per-capita or per-output consumption to confirm it still makes sense.
Before sign-off, the workbook is reviewed in steps by another analyst so formulas, conversions, and year links are checked, and then a final pass is done to confirm the narrative matches the numbers. Reports are refreshed annually, and interim updates are triggered when material events occur, such as major capacity changes, regulation shifts, or sharp feedstock and energy cost moves.
Mordor Intelligence's Mannitol Market Size Versus Other Published Estimates
Published market sizes for mannitol can vary even when the end topic looks the same, since firms may pick different base years, end-use boundaries, and price-setting logic. Differences also come from how each study treats form and grade splits, and how often the model is revisited when trade flows and capacity utilization move.
The key gap drivers usually show up in what is counted as the sellable market and how prices are averaged through the year, especially when pharmaceutical grade pricing is mixed with food and industrial grades. Some estimates also lean more on long-horizon assumptions without a clear check against import and export movement, which can widen the spread when regional balances are changing.
Benchmark comparison
| Source | Market Size | Gaps in Research Methodology |
|---|---|---|
| Mordor Intelligence | USD 474.11 M (2025) | |
| Global Consultancy A | USD 451.10 M (2024) | Uses a 2024 base and appears to blend application splits without clearly separating grade-driven ASP differences, which can pull the headline down when pharma-grade carries a premium. |
| Industry Research Group B | USD 448.00 M (2024) | Leans on a 2024 base year and a longer forecast window, and the public summary shows broader form definitions, which can shift totals depending on whether crystal versus granulated product is treated as a distinct revenue pool. |
The table shows a small spread that is mostly explained by the base-year choice and how product forms and grade-linked pricing are handled, and in Mordor Intelligence's model the 2025 value is built by aligning regional apparent consumption to form shares and then applying grade-relevant ASP ranges validated through interviews. With clear inclusion rules and repeatable checks against trade signals, the end result stays easy to trace and update when new capacity, qualification, or pricing changes occur.


Key Questions Answered in the Report
What is the current size of the mannitol market?
The mannitol market size stands at USD 498.2 million in 2026 and is projected to hit USD 638.03 million by 2031 at a 5.08% CAGR.
Which sector is the fastest-growing application area for mannitol?
Pharmaceuticals grow at 6.41% CAGR through 2031 due to increased use of mannitol as a multifunctional excipient in complex drug formulations.
Why is Asia-Pacific important for future mannitol market growth?
Asia-Pacific records the quickest 6.05% CAGR as India and China expand excipient manufacturing under supportive policies and rising domestic demand.
What limits the use of mannitol in food and beverage products?
Physiological tolerance and regulatory intake limits require label warnings about potential laxative effects, capping inclusion rates in certain foods.
Page last updated on:


 Your data is secure and never sold or shared.


