Market Overview
| Study Period | 2018 - 2031 |
|---|---|
| Forecast Data Period | 2026 - 2031 |
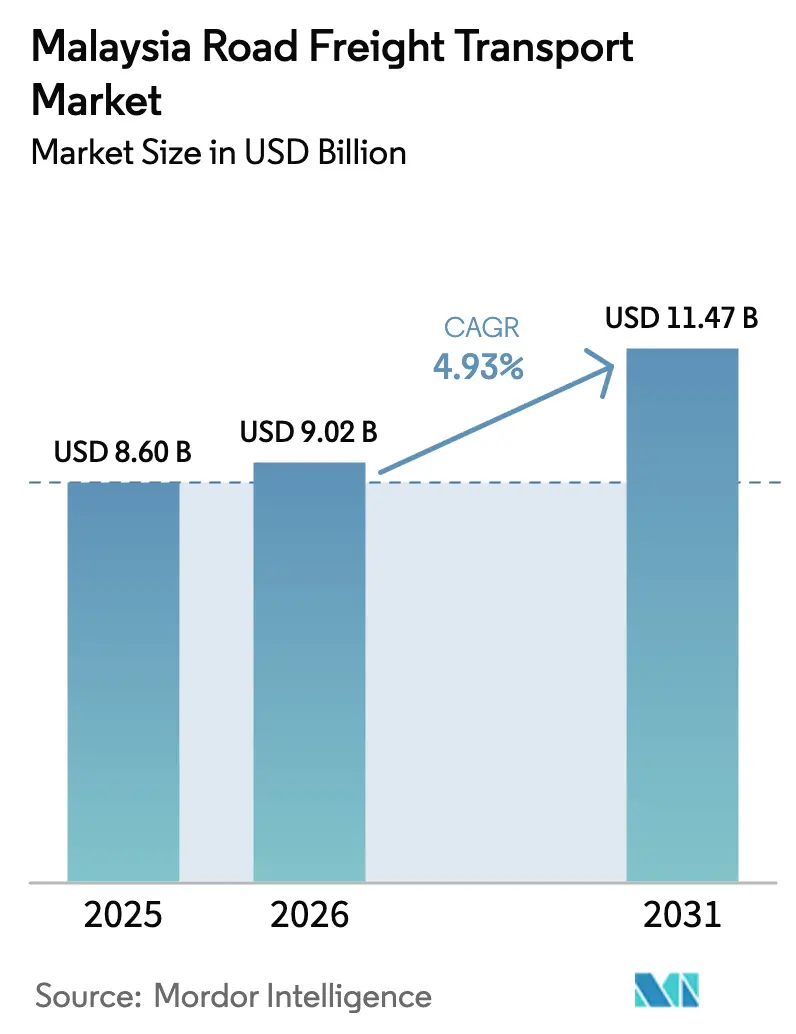
| Base Year Market Size (2025) | USD 8.60 Billion |
| Market Size (2026) | USD 9.02 Billion |
| Market Size (2031) | USD 11.47 Billion |
| Growth Rate (2026 - 2031) | 4.93% CAGR |
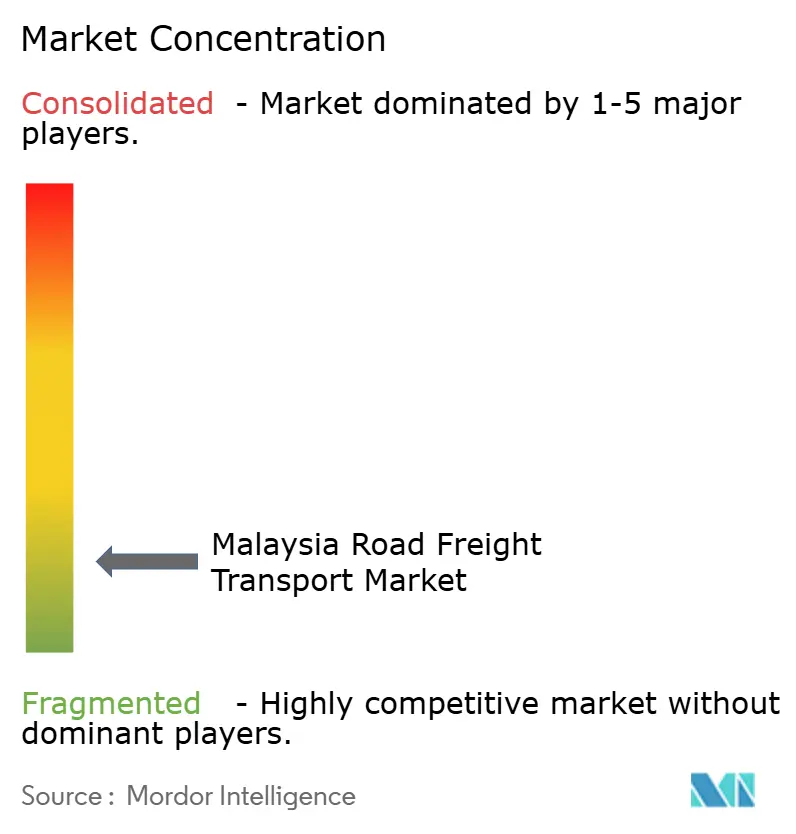
| Market Concentration | Low |
Major Players *Disclaimer: Major Players sorted in no particular order Image © Mordor Intelligence. Reuse requires attribution under CC BY 4.0. | |
Malaysia Road Freight Transport Market Analysis by Mordor Intelligence
The Malaysia road freight transport market size is expected to grow from USD 8.60 billion in 2025 to USD 9.02 billion in 2026 and is forecast to reach USD 11.47 billion by 2031 at 4.93% CAGR over 2026-2031. This firm growth outlook reflects the sector’s ability to serve Malaysia’s diversified manufacturing base, rising e-commerce volumes, and improving cross-border connectivity. Road carriers benefit from the 10.7% year-over-year expansion of the transportation and storage sector in Q4 2024 and from a 5.1% GDP increase that is sustaining consumer spending and construction activity. Operators are also capitalizing on the doubling of Port Klang’s container capacity, which lifts inland drayage requirements, and on government incentives that accelerate Euro-4M and electric-vehicle fleet renewal. At the same time, digital freight-matching platforms are cutting empty-running distances and improving small fleet utilization, while a strengthening Malaysia-Singapore trade corridor shortens border dwell times by up to 40%.
Key Report Takeaways
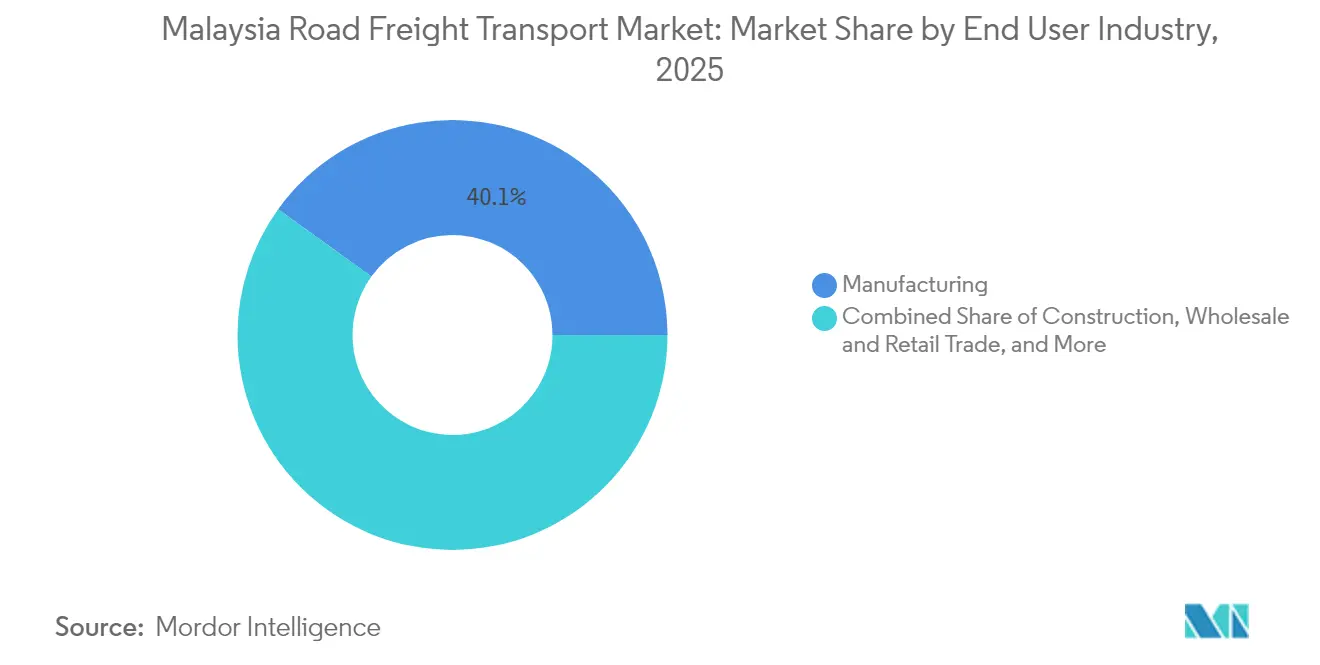
- By end user industry, manufacturing controlled 40.05% of the Malaysia road freight transport market share in 2025, whereas wholesale and retail trade is on track for the fastest 5.62% CAGR between 2026-2031.
- By destination, domestic flows secured 63.20% of the Malaysia road freight transport market size in 2025, while international traffic is registering a higher 5.70% CAGR between 2026-2031.
- By truckload specification, full-truck-load captured 78.60% of 2025 revenue, yet the less than-truck-load segment is advancing at a 5.48% CAGR between 2026-2031, on the back of parcelized e-commerce demand.
- By containerization, non-containerized freight accounted for 87.90% of the Malaysia road freight transport market size in 2025, with containerized traffic expanding at a 5.02% CAGR between 2026-2031, alongside Port Klang upgrades.
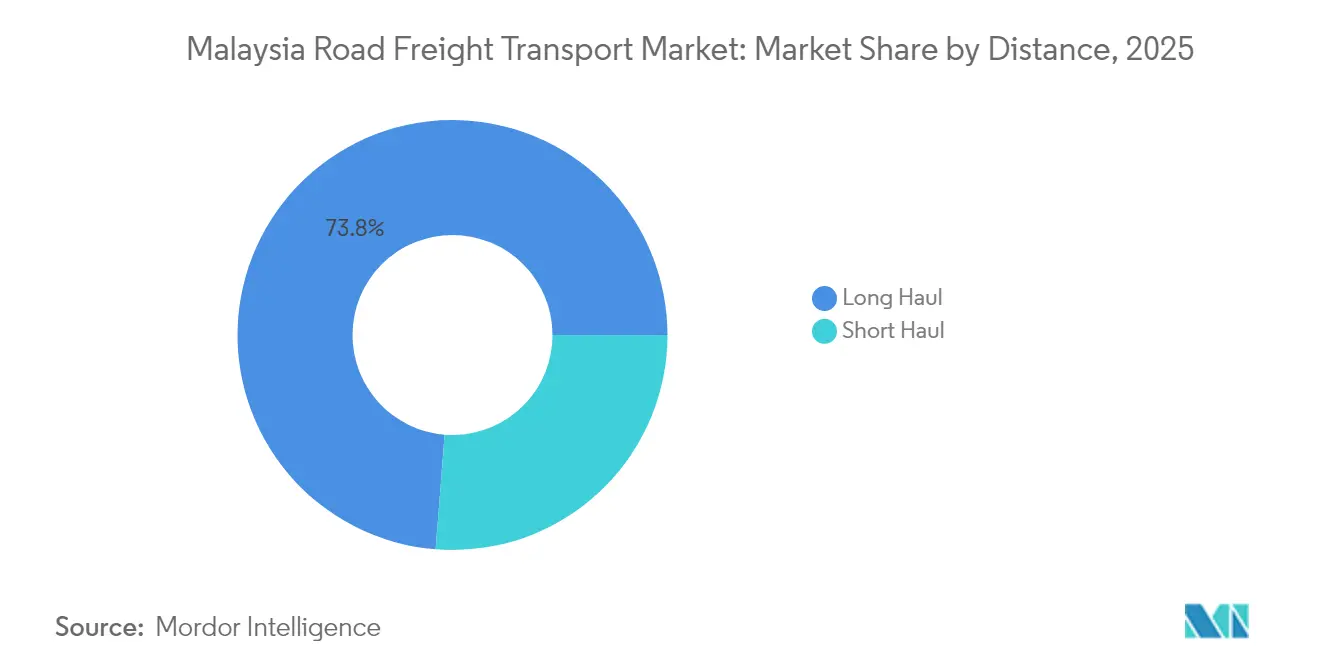
- By distance, long-haul moves made up 73.75% of 2025 revenue and are forecast to grow at 5.14% CAGR between 2026-2031, supported by north–south industrial corridors and improving multimodal links.
- By goods configuration, solid goods dominated with 63.10% share in 2025; fluid goods will post the quicker 5.15% CAGR between 2026-2031 as palm-oil and petrochemical traffic accelerates.
- By temperature control, non-temperature cargo remained at 94.00% of the 2025 value, but temperature-controlled freight is projected to climb at a 5.37% CAGR between 2026-2031, thanks to pharmaceutical and food-grade cold-chain investments.
Note: Market size and forecast figures in this report are generated using Mordor Intelligence’s proprietary estimation framework, updated with the latest available data and insights as of 2026.
Malaysia Road Freight Transport Market Trends and Insights
Drivers Impact Analysis*
| Driver | (~) % Impact on CAGR Forecast | Geographic Relevance | Impact Timeline |
|---|---|---|---|
| E-commerce fulfilment surge beyond Tier-1 cities | +1.2% | Nationwide; earliest in Selangor, Johor, Penang | Medium term (2-4 years) |
| Malaysia-Singapore land trade corridor modernization | +0.8% | Johor–Singapore axis | Short term (≤ 2 years) |
| Government incentives for Euro-4M/EV truck adoption | +0.6% | Urban centres nationwide | Medium term (2-4 years) |
| ASEAN road-rail multimodal integration projects | +0.7% | Northern and southern cross-border corridors | Long term (≥ 4 years) |
| Digital freight-matching platforms scaling | +0.5% | Major cities and secondary hubs | Short term (≤ 2 years) |
| Palm-oil downstream relocation boosting bulk trucking | +0.4% | Johor petrochemical clusters | Medium term (2-4 years) |
| Source: Mordor Intelligence | |||


E-commerce Fulfilment Surge Beyond Tier-1 Cities
Online sellers are pushing fulfilment activities into secondary towns such as Ipoh, Melaka, and Kuantan, generating granular last-mile volumes that were previously uneconomical to serve. UPS and Ninja Van’s 5,500-location pick-up network now blankets 90% of populated areas, lifting shipment density on spoke routes that feed regional mini-hubs[1]24/7 Staff, “UPS Expands Service in Malaysia with Ninja Van Partnership,” SupplyChain247, supplychain247.com. More than 40% of new Southeast Asian e-commerce spending already originates outside capital regions, obliging carriers to redesign networks around multi-node consolidation rather than a single Klang Valley hub. Digital start-ups like Diolko have begun bundling LRT access with bike-courier fleets to penetrate dense residential corridors efficiently. As route planning engines ingest that neighborhood-level demand data, asset utilization for small-box trucks rises and supports profitably priced less-than-truck-load runs. Over the medium term, the Malaysia road freight transport market will see higher shipment frequency, smaller average consignment weights, and steadier weekday demand profiles that ease fleet scheduling.
Malaysia-Singapore Land Trade Corridor Modernization
The Johor–Singapore Special Economic Zone’s single transshipment permit, implemented in January 2025, removed duplicate customs filings and cut cross-border clearance times by roughly two hours per trip. Coupled with the Rapid Transit System Link opening in 2027 and the uCustoms green-channel target of 80%, the corridor now delivers near-factory-gate transit for high-value electronics and automotive shipments[2]Royal Malaysian Customs Department, “Introduction,” uCustoms, customs.gov.my. Industrial estates in Johor and western Singapore, therefore, plan capacity additions that may lift bilateral truck moves by a compounded 6-7% annually. For carriers, quicker turns translate into one extra round-trip a day on the Johor Bahru–Tuas stretch, boosting daily revenue without expanding fleet size. The change also underpins the Malaysia road freight transport market’s move toward guaranteed-slot, time-definite services that can command premium rates from just-in-time manufacturers.
Government Incentives for Euro-4M/EV Truck Adoption
Logistics fleets now purchase diesel at a subsidized MYR 2.15 (USD 0.47) per liter and, at the same time, qualify for import duty rebates on battery-electric light and medium trucks until December 2025[3]Asian Development Bank, “ASEAN and Global Value Chains: Locking in Resilience and Sustainability,” adb.org . With Euro-5 limits entering force in September 2025 and several Klang Valley municipalities banning pre-Euro-4M trucks during peak hours, operators have strong cost and compliance reasons to refresh assets. New Euro-4M prime movers obtain up to 15% fuel-economy gains, while early movers into battery EV vans save an estimated MYR 12,000 (USD 2,610) in annual operating expense per vehicle under current tariff-free electricity rates. These economics nudge fleets toward larger, younger, and cleaner rolling stock that can execute digitally scheduled routes with higher reliability, gradually raising the Malaysia road freight transport market’s service standard.
ASEAN Road-Rail Multimodal Integration Projects
The ASEAN Customs Transit System pilot is now live on the North–South corridor, allowing a single electronic guarantee and through-movement paperwork for Malaysia-Singapore-Thailand truck journeys[4]Digitalize Trade, “The ASEAN Customs Transit System (ACTS),” digitalizetrade.org . Complementary capacity is also coming via the approved KL–Bangkok rail freight service slated for late 2025, which will shuttle containers on the 1,500 km trunk while road hauliers manage drayage at both ends. That division of labor reduces total logistics cost for shippers by 12–18% on qualifying lanes and widens the competitive radius of Malaysian carriers into Indochina markets. Over the long term, integrated road–rail nodes in Padang Besar and Gemas will support 24-hour transloading operations, further embedding trucks as the critical first-mile and last-mile link within a multimodal ecosystem that enlarges the Malaysia road freight transport market’s reachable customer base.
Restraints Impact Analysis*
| Restraint | (~) % Impact on CAGR Forecast | Geographic Relevance | Impact Timeline |
|---|---|---|---|
| Driver shortage and aging workforce | –0.8% | Nationwide; sharpest in Klang Valley | Short term (≤ 2 years) |
| High toll-road dependence inflating operating costs | –0.6% | Peninsular expressways | Medium term (2-4 years) |
| Imminent carbon pricing on diesel fleets | –0.4% | Urban centers | Medium term (2-4 years) |
| Chronic chassis imbalance at Port Klang | –0.3% | Port Klang hinterland | Short term (≤ 2 years) |
| Source: Mordor Intelligence | |||
Driver Shortage and Aging Workforce
A 20–30% shortfall in licensed heavy-goods vehicle drivers is constraining peak-season capacity, with the average driver now above 45 years old. Younger workers gravitate to technology or gig-delivery jobs, pushing haulage firms to raise starting wages by as much as 25% just to fill seats. Although the 2025 phased minimum-wage hike to MYR 1,700 (USD 370) somewhat narrows the earnings gap with rival sectors, it also nudges fleets to explore routing algorithms that reduce man-hours per ton-kilometer. The talent squeeze is severest on long-haul routes that require overnight stays and lengthy border waits; consequently, back-office attempts at double-deck loading and tighter scheduling to maximize each driver’s productive hours are gaining urgency throughout the Malaysia road freight transport market.
High Toll-Road Dependence Inflating Operating Costs
Peninsular Malaysia’s premium tolled highways deliver world-class average speeds yet absorb 8–12% of a line-haul truck’s total direct cost. On the north–south backbone from Bukit Kayu Hitam to Johor, few economically viable untolled alternatives exist, meaning carriers cannot bypass fee hikes when concessionaires adjust tariffs every three years. For freight firms operating on razor-thin margins, these structural charges reduce room to discount during slow quarters and increase modal competition from coastal feeder barges or future East Coast Rail Link container trains. The toll burden, therefore, acts as a latent cap on yield expansion in the Malaysia road freight transport market, especially for small fleets unable to negotiate contracted toll-card rebates.
*Our forecasts treat driver/restraint impacts as directional, not additive. The impact forecasts reflect baseline growth, mix effects, and variable interactions.
Segment Analysis
By End User Industry : Manufacturing Dominance Amid Retail Upswing
Manufacturing generated 40.05% of 2025 revenue and remains the anchor of the Malaysia road freight transport market. Electronics assembly, printed-circuit board test, and automotive component clusters create dense, short-cycle pallet flows between plants, contract manufacturers, and export forwarders. Semiconductor fabs in Penang and Kulim alone generate multi-shift outbound truckloads of sensitive machinery components that require anti-vibration handling. The wholesale and retail trade segment, however, is accelerating at a 5.62% CAGR (2026-2031) as omni-channel retailers decentralize inventory into mid-mile facilities that slash delivery windows to secondary cities. Rising grocery e-commerce penetration brings regular, mixed-temperature truck runs into peri-urban neighborhoods previously served by informal vans, bolstering less-than-truck-load volumes in the Malaysia road freight transport market.
Manufacturers are also reshoring intermediate processing for lithium-ion batteries and precision plastics, boosting the Malaysia road freight transport market size for plant-to-plant shuttles. Bottling and packaging lines, for instance, contract dedicated shuttle trucks to carry PET preforms, cardboard flats, and empty glass containers on strict just-in-sequence schedules. By contrast, oil and gas output faces a moderated road-freight outlook as upstream investment shifts toward energy-transition projects; nonetheless, RAPID’s petrochemical spin-offs guarantee steady feedstock tanker volumes. Construction’s 14.6% freight uplift in H1 2024 required large tipper-truck fleets to supply ballast, precast concrete, and tunnel segments to East Coast Rail Link sites, illustrating how megaproject phases can spike truck demand within the Malaysia road freight transport market.


By Destination : Domestic Core With Expanding Cross-Border Lanes
Domestic consignments held 63.20% of the 2025 value, buttressed by a linear peninsular layout that channels raw materials from northern industrial states to Klang Valley consolidation hubs before final distribution southward. Dense toll-road networks enable overnight Klang Valley–Penang and Klang Valley–Johor loops that maximize driver hours within legal limits. The international lane is growing faster at a 5.70% CAGR between 2026-2031 and is propelled by the ASEAN Customs Transit System, which slashes paperwork and guarantees in-transit insurance coverage on Singapore and Thailand lanes. As a result, the Malaysia road freight transport market size for cross-border loads is expected to post a mid-single-digit CAGR.
Domestic gains also stem from e-grocery expansion into rural Negeri Sembilan and Pahang, spurring regular chilled-truck dispatches that raise fleet utilization on lanes that historically returned empty. International trailers, on the other hand, enjoy improved reliability thanks to the Johor Border Hub’s appointment-based clearance system, which sliced average queue times from four hours to two. Yet northbound cargoes still grapple with axle-load enforcement anomalies at Bukit Kayu Hitam, occasionally triggering costly load-splitting. Throughout both flows, digital freight marketplaces now auction spot loads in real-time, letting small carriers earmark return hauls and sharpen pricing across the Malaysia road freight transport market.
By Truckload Specification : FTL Scale, LTL Momentum
Full-truck-load (FTL) retained 78.60% of 2025 turnover, reflecting consistent bulk movements in palm oil, pressed-steel, and containerized electronics that fill a 40-foot trailer easily. Multistop routing remains rare because legacy ERP systems in manufacturing zones dispatch time-critical pick-ups on dedicated rigs. Nevertheless, less-than-truck-load (LTL) volumes are rising at a predicted 5.48% CAGR between 2026-2031 as parcelization explodes. New cross-dock terminals outside Shah Alam now consolidate 800 to 1,000 e-commerce parcels into each 5-ton truck run, shrinking cost per package to levels near conventional courier rates and deepening LTL’s foothold in the Malaysia road freight transport market.
FTL still benefits from palm-oil tankers and steel rebar flatbeds that prefer straight-through moves to avoid load contamination and theft risk. LTL’s advance is most visible in temperature-controlled mini-reefers servicing pharmaceutical wholesalers that demand twice-daily restocking of regional depots. As dynamic routing engines mature, a carrier can splice two or three shipper consignments into one truck orbit without breaching customer delivery windows, shaving deadhead kilometers nearly in half. This dual-track evolution leaves the Malaysia road freight transport market well positioned to serve both high-volume industrial shippers and fragmented retail networks.
By Containerization : Bulk Prevalence With Box-Based Growth
Non-containerized cargo governed 87.90% of 2025 revenue because Malaysia’s export staples—palm oil, LNG modular skids, and refined petroleum—load more efficiently in tankers, hoppers, or specialized flatbeds. Yet containerized freight is accelerating by 5.02% CAGR between 2026-2031, thanks largely to Port Klang’s expansion to 27 million TEUs and favorable ocean rates on intra-Asia trades. The Malaysia road freight transport market size for drayage now hinges on chassis availability, integrated gate scheduling, and real-time berth visibility to guard against costly truck queuing.
Bulk hauliers are unlikely to containerize crude palm oil exports in the near term, as ISO tanks still beat 20-foot boxes on unit cost. However, electronics importers that once break-bulked pallets at port warehouses now dispatch sealed high-cube containers direct to inland distribution centers equipped with dock-levelers, slashing double-handling and shrinkage. Inland container depots in Perak and Melaka plan 2026 capacity expansions that could shift 250,000 TEUs per year off congested port yards and onto road links, crossing a structural threshold where container share grows steadily inside the Malaysia road freight transport market.
By Distance : Long-Haul Leadership Supported by Infrastructure
Long-haul assignments comprised 73.75% of the 2025 value, supported by efficient toll road alignments that let rigs average 80 km/h from Bukit Kayu Hitam to Johor Bahru. A 5.14% CAGR between 2026-2031 appears secure given manufacturing nodes continue to cluster more than 250 km apart. The East Coast Rail Link offers complementary rather than substitutional capacity; freight forwarders still depend on trucks for first-mile factory pick-ups and last-mile site deliveries on the East Coast. Short-haul activity—comprising urban shuttles around Klang Valley—expands rapidly, yet cannot erode long-haul’s share because population centers and industrial estates remain spatially dispersed in Malaysia's road freight transport market corridors.
Infrastructure upgrades like the West Coast Expressway opening to Lumut in late 2025 advance both safety and turnaround times, enabling operators to squeeze in an extra daily trip on Klang–Teluk Intan loops. Long-haul profitability, however, stays sensitive to toll-rate escalations and driver-rest compliance, pushing fleets to invest in telematics that optimize rest-stop timing and lane speeds. Such data-driven dispatch will further solidify the Malaysia road freight transport market’s long-haul efficiency advantage over alternative modes for unitized freight below 600 km.
By Goods Configuration : Solid Goods Core, Fluid Upshift
Solid goods kept a 63.10% share in 2025, propelled by palletized electronics boxes, auto components strapped on returnable racks, and consumer-staple cartons destined for convenience-store chains. As semiconductors shift to finer wafer nodes, shipment weight per cubic meter declines, letting transporters maximize volumetric load factor, a scenario that pads margins across the Malaysia road freight transport market. Fluid goods, meanwhile, are headed for a 5.15% CAGR (2026-2031) as downstream palm-oil processors and petrochemical complexes ramp up high-acid oil and oleochemical flows needing insulated tankers with heated coils.
Solid-goods growth is also fueled by rising domestic appliance assembly that uses just-in-sequence inbound shipping, requiring multiple daily flatbed drops of sub-assemblies to maintain takt time. For fluid goods, PETRONAS RAPID projections show an incremental 1.2 million tons of liquid chemicals per year moving by road, generating thousands of extra ISO-tank trips. Specialty fleets holding ADR certifications gain pricing power, reinforcing a bifurcated Malaysia road freight transport market wherein general cargo truckers and chemical tanker operators follow distinct rate cycles.
By Temperature Control : Ambient Bulk, Cold-Chain Breakout
Non-temperature-controlled cargo still generates 94.00% of 2025 revenue across the Malaysia road freight transport market, given that electronics, auto parts, and building materials require no chilling. Temperature-controlled cargo, however, will expand by a 5.37% CAGR between 2026-2031 as Malaysia’s pharmaceutical import volumes climb and frozen-seafood re-exports develop niche scale. DHL’s new 38,000 ft² pharma storage depot at KLIA spotlights this trend, offering dual 2–8°C and 15–25°C zones that feed countrywide truck deliveries.
Temperature-controlled trailers post higher revenue per kilometer yet demand rigorous asset-maintenance and data-logging to meet GDP requirements. Tasco Bhd’s 200-unit reefer fleet already reports 85–90% utilization and same-day backhaul alignment, proving cold-chain density is achievable. Rural vaccination campaigns further push refrigerated vans into previously untouched districts, widening cold-chain geography inside the Malaysia road freight transport market. The service premium offsets higher capital outlay while enabling providers to diversify revenue streams beyond volatile general cargo.
Geography Analysis
Malaysia’s peninsular spine, anchored by the North–South Expressway, supports continuous 24-hour freight loops that feed high-tech plants in Penang, central distribution hubs near Shah Alam, and export-oriented factories in Johor. Intra-peninsular lanes yield reliable two-day truck cycles, making domestic moves the Malaysia road freight transport market’s bedrock at 63.20% share. Toll-road connectivity minimizes mechanical wear and allows 40-ton rigs to run fuel-efficient cruise speeds, although escalating tariffs keep margin pressure high. Additionally, e-commerce demand outside Klang Valley is raising stop density in Negeri Sembilan and Pahang, permitting shorter delivery windows and predictable backhauls, which in turn boost ambient and chilled LTL movements.
International volumes, 36.80% of 2025 revenue, are growing faster as customs modernization shrinks border friction on the Johor–Singapore and Bukit Kayu Hitam–Thailand corridors. The single-permit regime in the Malaysia-Singapore Special Economic Zone clips average round-trip dwell by up to four hours, enabling one extra daily southbound swing for fleet operators. Simultaneously, ACTS electronic guarantees now cover through-transit into Laos and Vietnam, letting Malaysian trucks access emerging Indochina manufacturing clusters without repetitive paperwork. Although chassis shortages at Port Klang continue to cause sporadic delays, forthcoming inland depots in Perak and Negeri Sembilan should redistribute box flows and decongest terminal gates, indirectly benefiting the Malaysia road freight transport market’s international segment.
Infrastructure spending widens geographic opportunity. The 665 km East Coast Rail Link, once live, will insert rail hubs at Kuantan and Kota Bharu that require feeder-truck support, pushing road operators to establish east-coast staging yards. Over the long term, cross-border rail-truck services on the KL–Bangkok corridor will provide hybrid solutions where road handles first-mile and last-mile tasks, thereby enlarging service offerings for trucking firms seeking to expand out of saturated domestic lanes. Coupled with Indonesia’s interest in direct Ro-Ro ferry connections to Malacca, these multimodal and maritime linkages ensure the Malaysia road freight transport market remains integral to wider ASEAN supply-chain flows.
Competitive Landscape
The Malaysia road freight transport market remains fragmented. Scale advantages accrue to firms able to field compliant Euro-4M fleets, integrate telematics, and cross-sell multimodal services. Global majors are deepening Malaysian exposure as consolidation accelerates. DSV completed its EUR 14.3 billion (USD 15.8 billion) acquisition of DB Schenker in April 2025, inheriting the latter’s established Malaysian fleet and customer base. At the same time, niche specialists such as Tasco Bhd exploit tight cold-chain capacity to secure premium pharmaceutical accounts, leveraging GDP-certified depots and 200 reefer rigs operating at high utilization.
Digital challengers gain traction by aggregating small-fleet capacity and selling reliability through technology. Platforms like TheLorry and Deliveree command network densities of more than 15,000 active trucks, matching loads in under 10 minutes on average and pruning deadhead miles for owner-operators who lack direct shipper contracts. Yet platform fragmentation creates data silos, so incumbents with proprietary systems sometimes resist open integrations to preserve stickiness.
Going forward, Euro-5 compliance costs and pending carbon levies may trigger a shake-out that favors well-capitalized carriers able to finance younger, greener fleets, gradually raising the Malaysia road freight transport market’s concentration and service quality.
Malaysia Road Freight Transport Industry Leaders
Tiong Nam Logistics Holdings Bhd
Swift Haulage Berhad
CJ Logistics
DHL Supply Chain Malaysia
Pos Logistics Bhd
- *Disclaimer: Major Players sorted in no particular order

Recent Industry Developments
- September 2025: Pos Malaysia added 136 electric vans to its fleet, taking nationwide EV assets to more than 1,250 e-bikes and 400 e-vans, underscoring its ESG agenda.
- April 2025: DSV A/S finalized its EUR 14.3 billion (USD 15.8 billion) acquisition of DB Schenker, creating a 160,000-employee powerhouse with expanded Malaysian presence.
- October 2024: DHL inaugurated its USD 69 million Kuala Lumpur Gateway at KLIA, expanding peak parcel handling capacity nearly four-fold to 10,000 shipments per hour.
- March 2024: Kuehne + Nagel agreed to buy City Zone Express, bringing a 260-truck fleet and 80,000 sqm of warehousing into its Southeast Asian network.


Malaysia Road Freight Transport Market Report Scope
Agriculture, Fishing, and Forestry, Construction, Manufacturing, Oil and Gas, Mining and Quarrying, Wholesale and Retail Trade, Others are covered as segments by End User Industry. Domestic, International are covered as segments by Destination. Full-Truck-Load (FTL), Less than-Truck-Load (LTL) are covered as segments by Truckload Specification. Containerized, Non-Containerized are covered as segments by Containerization. Long Haul, Short Haul are covered as segments by Distance. Fluid Goods, Solid Goods are covered as segments by Goods Configuration. Non-Temperature Controlled, Temperature Controlled are covered as segments by Temperature Control.End User Industry
| Agriculture, Fishing, and Forestry |
| Construction |
| Manufacturing |
| Oil and Gas, Mining and Quarrying |
| Wholesale and Retail Trade |
| Others |
Destination
| Domestic |
| International |
Truckload Specification
| Full-Truck-Load (FTL) |
| Less than-Truck-Load (LTL) |
Containerization
| Containerized |
| Non-Containerized |
Distance
| Long Haul |
| Short Haul |
Goods Configuration
| Fluid Goods |
| Solid Goods |
Temperature Control
| Non-Temperature Controlled |
| Temperature Controlled |
| End User Industry | Agriculture, Fishing, and Forestry |
| Construction | |
| Manufacturing | |
| Oil and Gas, Mining and Quarrying | |
| Wholesale and Retail Trade | |
| Others | |
| Destination | Domestic |
| International | |
| Truckload Specification | Full-Truck-Load (FTL) |
| Less than-Truck-Load (LTL) | |
| Containerization | Containerized |
| Non-Containerized | |
| Distance | Long Haul |
| Short Haul | |
| Goods Configuration | Fluid Goods |
| Solid Goods | |
| Temperature Control | Non-Temperature Controlled |
| Temperature Controlled |


Market Definition
- Agriculture, Fishing, and Forestry (AFF) - This end user industry segment captures the external (outsourced) logistics expenditure incurred by the AFF industry players on road freight transport service. The end user players considered are the establishments primarily engaged in growing crops, raising animals, harvesting timber, harvesting fish & other animals from their natural habitats and providing related support activities. Herein, across the value chain, Logistics Service Providers (LSPs) play a crucial role in acquisition, storage, handling, transportation, and distribution activities for the optimal & continuous flow of inputs (seeds, pesticides, fertilizers, equipment, and water) from manufacturers or suppliers to the producers and smooth flow of output (produce, agro-goods) to distributors/ consumers. This includes both termperature controlled and non-temperature controlled logistics, as and when required according to the shelf life of goods being transported or stored.
- Construction - This end user industry segment captures the external (outsourced) logistics expenditure incurred by the construction industry players, on road freight transport service. The end user players considered are the establishments primarily engaged in constructing, repairing and renovating residential & commercial buildings, infrastructure, engineering works, subdividing and developing land. Logistics Service Providers (LSPs) play a crucial role in increasing profitability of construction projects by maintaing the inventory of raw materials & equipment, time-critical supplies and by providing other value added services for effective project management.
- Containerized Road Freight Transport - The segment captures the external (outsourced) logistics expenditure incurred by the road freight transport service end users on Full-Truck-Load (FTL) services. FTL road freight transport is characterized as a full single load not combined with other shipments. It comprises of shipments (i) devoted to the goods of a single shipper (ii) taken directly from a point of origin to one or more destination points (iii) comprising of bulk mail truck transportation (iv) comprising of both Container (Full Container Load, FCL)/Non-Container trucking services (v)comprsing of goods requiring temperature controlled or non-temperature controlled transportation services (vi) comprising of bulk liquid tankering (vii) invoving trucking of waste (viii) hazardous material trucking. Related value added services (VAS) of sorting, consolidation, deconslidation are included in the other services segment of freight and logistics market.
- Export Trends and Import Trends - Overall logistics performance of an economy is positively and significantly (statistically) correlated to its trade performance (exports and imports). Hence, in this industry trend, total value of trade, major commodities/ commodity groups and the major trade partners, for the studied geography (country or region as per the scope of report) have been analysed alongside the impact of major trade/logistics infrastructure investments & regulatory environment.
- Fluid Goods - The segment captures the external (outsourced) logistics expenditure incurred by the road freight transport service end users for the transport of bulk liquids, that are often used in extraction, manufacturing, food processing, agriculture industries among others. It includes transportation of liquids like (i) Chemicals/ hazardous goods (for instance acids) (ii) Water (potable as well as waste) (iii) Oil and gas (upstream as well as downstream like gasoline, fuel, crude oil, or propane), (iv) Food grade bulk liquids (like milk, or juice), (v) Rubber, (vi) Agrichemical products, among others. These goods are generally transported through tanker trucking.
- Fuel Price - Fuel price spikes can cause delays and diruption for logistics service providers (LSPs), while drops in the same can result in higher short-term profitability and increased market rivalry to offer consumers with the best deals. Hence, the fuel price variations have been studied over the review period and presented along with the causes as well as market impacts.
- Full-Truck-Load (FTL) Road Freight Transport - The segment captures the external (outsourced) logistics expenditure incurred by the road freight transport service end users on Full-Truck-Load (FTL) services. FTL road freight transport is characterized as a full single load not combined with other shipments. It comprises of shipments (i) devoted to the goods of a single shipper (ii) taken directly from a point of origin to one or more destination points (iii) comprising of bulk mail truck transportation (iv) comprising of both Container (Full Container Load, FCL)/Non-Container trucking services (v)comprsing of goods requiring temperature controlled or non-temperature controlled transportation services (vi) comprising of bulk liquid tankering (vii) invoving trucking of waste (viii) hazardous material trucking. Related value added services (VAS) of sorting, consolidation, deconslidation are included in the other services segment of freight and logistics market.
- GDP Distribution by Economic Activity - Nominal Gross Domestic Product and distribution of the same, across major economic sectors in the geography studied (country or region as per scope of the report) have been studied and presented in this industry trend. As GDP is positively related to the profitability and growth of logistics industry, this data has been used in adjunction to the input-output tables/ supply-use tables for analyzing the potential major contributing sectors towards the logistics demand.
- GDP Growth by Economic Activity - Growth of Nominal Gross Domestic Product across major economic sectors, for the geography studied (country or region as per scope of the report) have been presented in this industry trend. This data has been utilized for assessing the growth of logistics demand from all the market end users (economic sectors considered here).
- Inflation - Variations in both Wholesale Price Inflation (YoY change in producer price index) and Consumer Price Inflation have been presented in this industry trend. This data has been used to assess the inflationary environment as it plays a vital role in smooth functioning of the supply chain, directly impacting the logistics operational cost components e.g., pricing of tyres, driver wages & benefits, energy/fuel prices, maintenace costs, toll charges, warehousing rents, custom brokerage, forwarding rates, courier rates etc. hence impacting the overall freight and logistics market.
- Key Industry Trends - The report section named "Key Industry Trends" include all the key variables/parameters studied to better analyze the market size estimates and forecasts. All the trends have been presented in the form of data points (time series or latest available data points) along with analysis of the paramter in the form of concise market relevant commentary, for the geography studied (country or region as per the scope of report).
- Key Strategic Moves - The action taken by a company to differentiate from its competitor or used as a general strategy is referred to as a key strategic move (KSM). This includes (1) Agreements (2) Expansions (3) Financial Restructuring (4) Mergers and Acquisitions (5) Partnerships, and (6) Product Innovations. Key players (Logistics Service Providers, LSPs) in the market have been shortlisted, their KSM have been studied and presented in this section.
- Less than-Truck-Load (LTL) Road Freight Transport - The segment captures the external (outsourced) logistics expenditure incurred by the road freight transport service end users on Less than-Truck-Load (LTL) services. LTL road freight transport is characterized as multiple shipments combined onto a single truck for multiple deliveries within a network. It comprises of establishments (i) primarily engaged in general and specialized freight trucking of less than complete truck-loads, (ii) characterized by the use of terminals to consolidate shipments, generally from several shippers, into a single truck for haulage between a load assembly terminal and a disassembly terminal, where the load is sorted and shipments are re-routed for delivery (iv) Less than-Container-Load (LCL) shipping/ Groupage Shipping in case of trucking services. The activities in scope include (i) local pick-up, (ii) line-haul, and (iii) local delivery. Related value added services (VAS) of sorting, consolidation, deconslidation are included in the other services segment of freight and logistics market.
- Logistics Performance - Logistics Performance and Logistics Costs are the backbone of trade, and influences trade costs, making countries compete globally. Logistics performance is influenced by market wide adopted supply chain management strategies, government services, investments & policies, fuel/ energy costs, inflationary environment etc. Hence, in this industry trend, the logistics performance of the geography studied (country/ region as per the scope of report) has been analysed and presented over the review period.
- Major Truck Suppliers - Market share of truck brands is influenced by factors like geographical preferences, portfolio of truck types, truck prices, local production, truck repair & maintenance service peneteration, customer support, technological innovations (like electric vehicles, digitalization, autonomous trucks), fuel efficiency, financing options, annual maintenance costs, availability of substitutes, marketing startegies etc. Hence, the distribution (share % for base year of the study) of truck sales volume for leading truck brands and commentary on current market scenario & market anticipation over the forecast period have been presented in this industry trend.
- Manufacturing - This end user industry segment captures the external (outsourced) logistics expenditure incurred by the Manufacturing industry players, on road freight transport service. The end user players considered are the establishments primarily engaged in the chemical, mechanical or physical transformation of materials or substances into new products. Logistics Service Providers (LSPs) play a crucial role in maintaining a smooth flow of raw materials across the supply chain, enabling timely delivery of finished goods to distributors or end customers and storing & supplying the raw materials to clients for just-in-time manufacturing.
- Modal Share - Freight Modal Share is influenced by factors like modal productivity, government regulations, containerization, distance of shipment, temperature control requirements, type of goods, international trade, terrain, speed of delivery, shipment weight, bulk shipments, etc. Also, modal share by tonnage (tons) and modal share by freight turnover (ton-km) differ as per average distance of shipments, weight of major commodity groups transported in the economy and number of trips. This industry trend represents the distribution of freight transported by mode of transport (tons as well as ton-km), for the study base year.
- Oil and Gas, Mining and Quarrying - This end user industry segment captures the external (outsourced) logistics expenditure incurred by the extraction industry players, on road freight transport service. The end user players considered are the establishments that extract naturally occurring mineral solids, such as coal and ores; liquid minerals, such as crude petroleum; and gases, such as natural gas. Logistics Service Providers (LSPs) covers entire phases from upstream to downstream and plays a crucial role in the transportation of machinery, drilling equipments, extracted minerals, crude oil & natural gas and refined/ processed products from one place to another.
- Other End Users - Other end user segment captures the external (outsourced) logistics expenditure incurred by the financial services (BFSI), real estate, educational services, healthcare, and professional services (administrative, waste management, legal, architectural, engineering, design, consulting, scientific R&D), on road freight transport service. Logistics Service Providers (LSPs) plays a crucial role in the reliable movement of supplies and documents to/from these industries such as transporting any equipment or resources required, shipping confidential documents and files, movement of medical goods & supplies (surgical supplies and instruments, including gloves, masks, syringes, equipment) to name a few.
- Producer Price Inflation - It indicates inflation from viewpoint of the producers viz. the average selling price received for their output over a period of time. Annual change (YoY) of producer price index is reported as wholesale price inflation in the "Inflation" industry trend. As WPI captures dynamic price movements in most comprehensive way, it is widely used by governments, banks, industry, business circles and is deemed important in formulation of trade, fiscal and other economic policies. The data has been used in adjunction to consumer price inflation for better understanding the inflationary environment.
- Road Freight Pricing Trends - Freight pricing by mode of transport (USD/tonkm), over the review period, has been presented in this industry trend. The data has been used in assessing the inflationary environment, impact on trade, freight turnover (tonkm), road freight transport market demand and hence the road freight transport market size.
- Road Freight Tonnage Trends - Freight tonnage (weight of goods in tons) handled by mode of transport, over the review period, has been presented in this industry trend. The data has been used as one of the parameters apart from average distance per shipment (km), freight volume (tonkm), and freight pricing (USD/tonkm) to assess the freight transport market size.
- Road Freight Transport - Hiring a road freight transport logistics service provider (LSP) or haulier (outsourced logistics), for the transport of commodities constitutes road freight transport market. The scope of study includes (i) road transport of goods reported by hauliers registered in the reporting countries (ii) transport of raw materials or manufactured goods (solids as well as fluids) (iii) transport using commerical motor vehicles (rigid trucks or tractor-trailers, (iv) Full-Truck-Load (FTL) or Less than-Truck-Load (LTL) transport (v) containerized or non-containerized transport (vi) temperature controlled or non-temperature controlled trasnport, (vii) short haul or long haul (Over-the-road, OTR) transport, (viii) used office or household goods transport (movers and packers), (ix) other specialized cargo transport (dangerous goods, oversized cargo) and (x) outsourced first mile/ middle mile/last mile delivery shipments undertaken by road freight transport players. The scope does not include (i) transport undertaken by hauliers registered in other countries (ii) last mile meal delivery market (iii) grocery delivery market (iv) transportation via road network undertaken/ reported by Courier, Express, and Parcel (CEP) players.
- Road Length - As infrastructure plays a vital role in an economy's logistics performance, variables like length of roads, distribution of road length by surface category (paved v/s unpaved), distribution of road length by road classification (expressways v/s highways v/s other roads), have been analysed and presented in this industry trend.
- Segmental Revenue - Segmental Revenue has been triangulated or computed and presented for all the major players in the market. It refers to the road freight transport market specific revenue earned by the company, over the base year of study, in the geography studied (country or region as per the scope of report). It is computed through the study and analysis of major parameters like financials, service portfolio, employee strength, fleet size, investments, number of countries present in, major economies of concern, etc. that have been reported by the company in its annual reports, webpage. For companies having scarce financial disclosures, paid databases like D&B Hoovers, Dow Jones Factiva have been resorted to and verified through industry/expert interactions.
- Short Haul Road Freight Transport - The segment captures the external (outsourced) logistics expenditure incurred by the road freight transport service end users on local trucking (less than 100 miles). It includes the road transport of goods (i) within a single administrative area and its hinterland, (ii) by smaller trucks and pickup trucks (iii) via containerized as well as dry bulk services (iv) intermodal from ports, container terminals or airports, and (v) outsourced first mile/ last mile delivery shipments undertaken by road freight transport players.
- Transport and Storage Sector GDP - Value and growth of Transport and Storage Sector GDP has a direct relation to the freight and logistics market size, and hence road freight transport market size. Therefore, this variable has been studied and presented over the review period, in value terms (USD) and as share % of total GDP, in this industry trend. The data has been supported by concise and relevant commentary around the investments, developments, and current market scenario.
- Trends in E-Commerce Industry - Enhanced internet connectivity and boom in smartphone penetration, coupled with increasing disposable incomes, has led to a phenomenal growth in the e-commerce market globally. Online shoppers require fast and efficient delivery of their orders leading to an increase in the demand for logistics services especially e-commerce fulfilment services. Hence, the Gross Merchandise Value (GMV), historial and projected growth, breakup of major commodity groups in e-commerce industry for the studied geography (country or region as per scope of the report) have been analysed and presented in this industry trend.
- Trends in Manufacturing Industry - Manufacturing industry involves the transformation of raw materials into finished products, while logistics industry ensures the efficient flow of raw materials to the factory, and the transport of manufactured products to the distributors & consumers. Demand-Supply of both industries are highly cross-linked and critical for a seamless supply chain. Hence, the Gross Value Added (GVA), breakup of GVA into major manufacturing sectors, and growth of manufacturing industry over the review period have been analysed and presented, in this industry trend.
- Trucking Fleet Size By Type - Market share of truck types is influenced by factors like geographical preferences, major end user industries, truck prices, local production, truck repair & maintenance service peneteration, customer support, technological disruptions (like electric vehicles, digitalization, autonomous trucks) etc. Hence, the distribution (share % for base year of study) of truck parc volume by type of truck, market disruptors, truck manufacturing investments, truck specifications, truck use & import regulations, and market anticipation over the forecast period have been presented in this industry trend.
- Trucking Operational Costs - The prime reasons for measuring/ benchmarking logistics performance of any trucking company are to reduce operational costs and increase profitability. On the other hand, measuring operational costs helps to identify whether and where to make operational changes to control expenses and identify areas for improved performance. Hence, in this industry trend, trucking operational costs and the variables involved viz. driver wages & benefits, fuel prices, repairs & maintenance costs, tyre costs etc. have been studied over the base year of study, and presented for the geography studied (country or region as per the scope of report).
- Wholesale and Retail Trade - This end user industry segment captures the external (outsourced) logistics expenditure incurred by the wholesalers and retailers, on road freight transport service. The end user players considered are the establishments primarily engaged in wholesaling or retailing merchandise, generally without transformation, and rendering services incidental to the sale of merchandise. Logistics Service Providers (LSPs) plays a crucial role in the reliable movement of supplies to and finished products from production houses to the distributors and finally to the end customer covering activites like material sourcing, transportation, order fulfillment, warehousing & storage, demand forecasting, inventory management etc.
| Keyword | Definition |
|---|---|
| Cabotage | Road transport by a motor vehicle registered in a country performed on the national territory of another country. |
| Cross Docking | Cross docking is a logistics procedure where products from a supplier or manufacturing plant are distributed directly to a customer or retail chain with marginal to no handling or storage time. Cross docking takes place in a distribution docking terminal; usually consisting of trucks and dock doors on two (inbound and outbound) sides with minimal storage space. The name ‘cross docking’ explains the process of receiving products through an inbound dock and then transferring them across the dock to the outbound transportation dock. |
| Cross Trade | International road transport between two different countries performed by a road motor vehicle registered in a third country. A third country is a country other than the country of loading/embarkation and than the country of unloading/disembarkation. |
| Dangerous Goods | The classes of dangerous goods carried by Road are those defined by the fifteenth revised edition of the UN Recommendations on the Transport of Dangerous Goods, United Nations, Geneva 2007. They include Class 1: Explosives; Class 2: Gases; Class 3: Flammable Liquids; Class 4: Flammable solids- substances liable to spontaneous combustion; substances which, on contact with water, emit flammable gases; Class 5: Oxidizing substances and organic peroxides; Class 6: Toxic and infectious substances; Class 7: Radioactive material and Class 8: Corrosive substances, Class 9: Miscellaneous dangerous substances and articles. |
| Direct Shipment | Direct shipment is a method of delivering goods from the supplier or the product owner to the customer directly. In most cases, the customer orders the goods from the product owner. This delivery scheme reduces transportation and storage costs, but requires additional planning and administration. |
| Drayage | A drayage is a form of trucking service that connects the different modes of shipping (intermodal), such as ocean freight or air freight. It’s a short-haul trip that transports goods from one place to another, usually before or after its long-haul shipping process. Drayage trucks move cargo to and from various destinations, such as container ships, storage lots, order fulfillment warehouses, and rail yards. Typically, drayage only transports goods in short distances and operates only in one metropolitan area. It also requires only one trucker in a single shift. But despite this, but it plays an important role in long-haul shipping because it gets the goods to the cargo and vice versa. It makes intermodal transport much more efficient and enables the seamless transfer of goods to the end customer. |
| Dry van | A dry van is a type of semi-trailer that's fully enclosed to protect shipments from outside elements. Designed to carry palletized, boxed or loose freight, dry vans aren't temperature-controlled (unlike refrigerated “reefer” units) and can't carry oversized shipments (unlike flatbed trailers). |
| Final Demand | Final demand includes all types of commodities (goods as well as services) consumed as final use and might include personal consumption, or consumption by government, by businesses as capital investment, and as exports. includes all types of commodities (goods as well as services) consumed as final use and might include personal consumption, or consumption by government, by businesses as capital investment, and as exports. |
| Flatbed Truck | A flatbed truck is a type of truck with rigid design. It has a back body that is flatly shaped for easy loading and unloading of goods. The flatbed truck is mostly used to transport heavy, oversized, wide and indelicate goods such as machinery, building supplies or equipment. Due to the truck open body, the goods transported with it must not be vulnerable to rain. By functionality, the flatbed truck is comparable to a flatbed trailer. |
| Inbound Logistics | Inbound logistics is the way materials and other goods are brought into a company. This process includes the steps to order, receive, store, transport and manage incoming supplies. Inbound logistics focuses on the supply part of the supply-demand equation. |
| Intermediate Demand | Intermediate demand includes goods, services, and maintenance and repair construction sold to businesses, excluding capital investment. |
| International Loaded | Place of loading of goods in reporting country (i.e., country in which the vehicle performing the transport is registered) and place of unloading in a different country. |
| International Unloaded | Place of unloading of goods in reporting country (i.e., country in which the vehicle performing the transport is registered) and place of loading in a different country. |
| OOG cargo | Out of Gauge (OOG) cargo is any cargo that can not be loaded into six-sided shipping containers simply because it is too large. The term is a very loose classification of all cargo with dimensions beyond the maximum 40HC container dimensions. That is a length beyond 12.05 meters – a width beyond 2.33 meters – or a height beyond 2.59 meters. |
| Pallets | Raised platform, intended to facilitate the lifting and stacking of goods. |
| Part load | A part load describes goods which only fills a truck partially. In essence, the quantity of the shipment is bigger than the Less Than Truckload (LTL) shipment. Also, the shipment cannot fully occupy a truck i.e. its capacity is much lower than a Full Truckload (FTL) shipment. |
| Paved Road | Road surfaced with crushed stone (macadam) with hydrocarbon binder or bituminized agents, with concrete or with cobblestone. |
| Reverse Logistics | Reverse logistics comprises of the sector of supply chains that process anything returning inwards through the supply chain or traveling ‘backward’ through the supply chain. |
| Road Freight Transport Service | Hiring a trucking agency for transport of commodities (raw materials or manufactured goods including both solids and liquids) form the origin to a destination within the country (domestic) or cross-border (international) constitutes road freight transport market. The service might be Full-Truck-Load or Less than-Truck-Load, containerized or non-containerized, temperature controlled or non temperature controlled, short haul or long haul. |
| Tautliner vehicle | Tautliner and curtainsider are used as generic names for curtain sided trucks/trailers. The curtains are permanently fixed to a runner at the top and detachable rails/poles at front and rear, allowing the curtains to be drawn open and forklifts used all along the sides for easy and efficient loading and unloading. When closed for travel, vertical load restraint straps are attached to a rope rail beneath the truck bed, connecting the truck bed and curtain along both sides. Winches at either end of the curtain tension it, hence the 'Tautliner' name. This stops the curtain from flapping or drumming in the wind and can also help retain light loads from slipping sideways. |
| Transport for hire or reward | The carriage for remuneration of goods. |
| Unpaved Road | Road with a stabilized base not surfaced with crushed stone, hydrocarbon binder or bituminized agents, concrete or cobblestone. |


Research Methodology
Mordor Intelligence follows a four-step methodology in all our reports.
- Step-1: Identify Key Variables: In order to build a robust forecasting methodology, the variables and factors identified in Step-1 are tested against available historical market numbers. Through an iterative process, the variables required for market forecast are set and the model is built on the basis of these variables.
- Step-2: Build a Market Model: Market-size estimations for the forecast years are in nominal terms. Inflation is considered to be a part of the pricing, and the average selling price (ASP) is varying throughout the forecast period for each country
- Step-3: Validate and Finalize: In this important step, all market numbers, variables and analyst calls are validated through an extensive network of primary research experts from the market studied. The respondents are selected across levels and functions to generate a holistic picture of the market studied.
- Step-4: Research Outputs: Syndicated Reports, Custom Consulting Assignments, Databases & Subscription Platforms


