Malaysia Data Center Power Market Size and Share
Market Overview
| Study Period | 2020 - 2031 |
|---|---|
| Forecast Data Period | 2026 - 2031 |
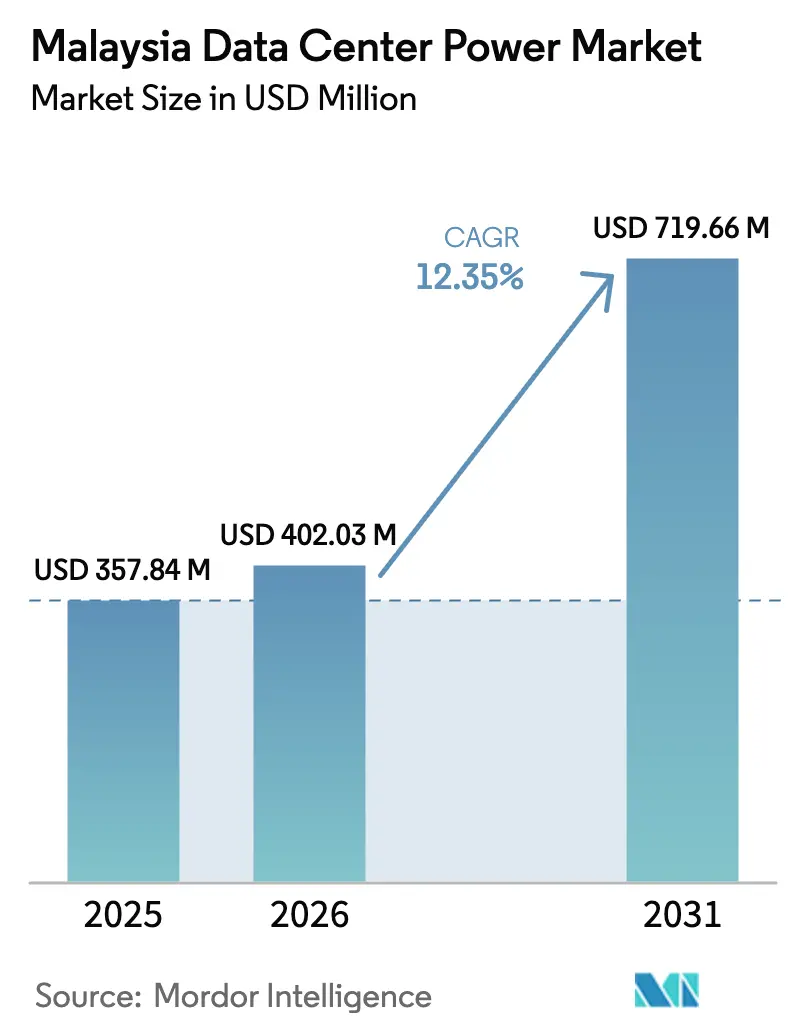
| Base Year Market Size (2025) | USD 357.84 Million |
| Market Size (2026) | USD 402.03 Million |
| Market Size (2031) | USD 719.66 Million |
| Growth Rate (2026 - 2031) | 12.35% CAGR |
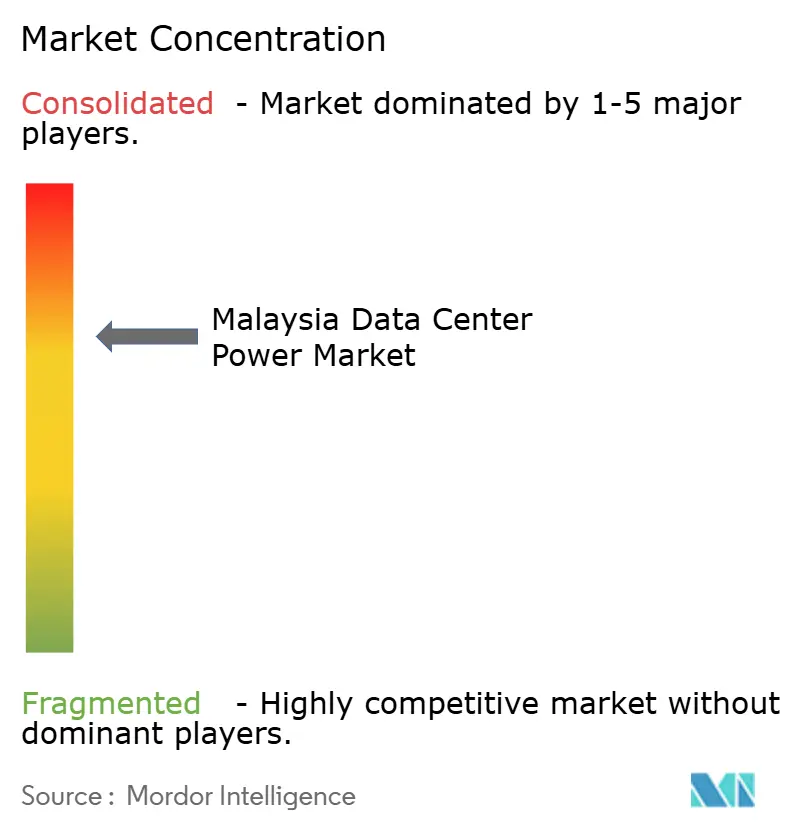
| Market Concentration | Medium |
Major Players *Disclaimer: Major Players sorted in no particular order Image © Mordor Intelligence. Reuse requires attribution under CC BY 4.0. | |
Malaysia Data Center Power Market Analysis by Mordor Intelligence
Malaysia data center power market size in 2026 is estimated at USD 402.03 million, growing from 2025 value of USD 357.84 million with 2031 projections showing USD 719.66 million, growing at 12.35% CAGR over 2026-2031. This rapid scale-up is anchored in Malaysia’s emergence as the region’s preferred alternative to land-constrained Singapore, a shift underscored by more than 11 GW of pending electricity applications lodged with Tenaga Nasional Berhad (TNB). Government fast-track approvals, proactive grid investments, and a healthy national reserve margin are aligning with multi-billion-dollar commitments from Microsoft, Google, and Amazon to create a virtuous cycle of demand and infrastructure build-out. The Malaysia data center power market is also benefiting from policy levers such as the MyDIGITAL blueprint and the Corporate Green Power Programme, which collectively shorten project timetables and lower renewable-energy procurement risks. Taken together, these drivers underpin a sustained wave of large, hyperscale deployments that will keep power-related capital expenditure elevated through 2030.
Key Report Takeaways
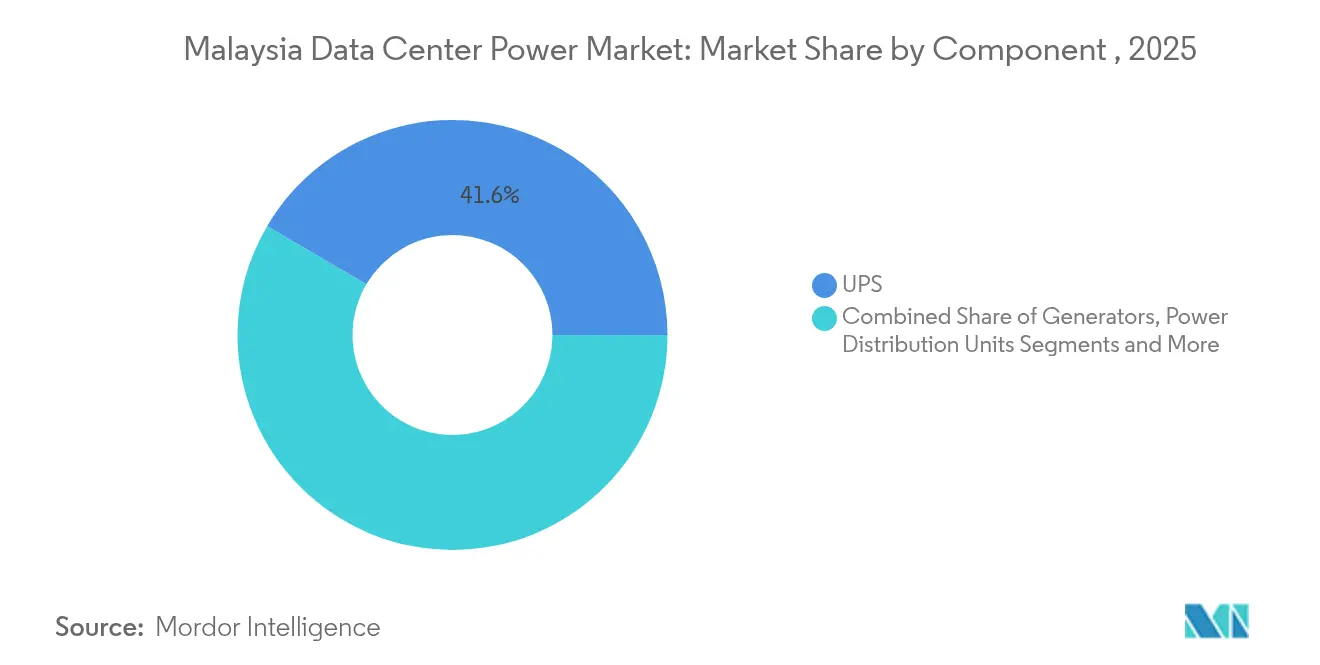
- By component, UPS systems led with 41.55% of Malaysia's data center power market share in 2025, while PDUs posted the fastest 12.74% CAGR to 2031.
- By data-center type, colocation providers held 35.21% Malaysia data center power market share in 2025; hyperscale/cloud facilities register the highest 13.18% CAGR through 2031.
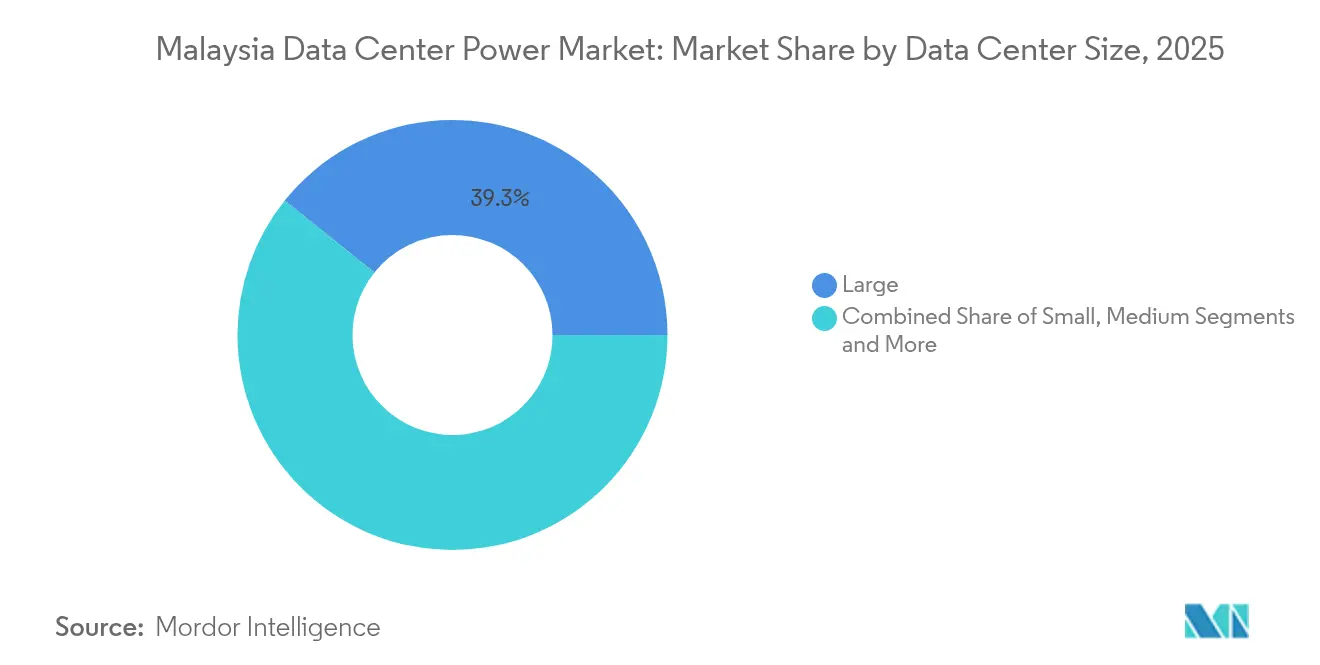
- By size, large facilities accounted for 39.25% of the Malaysia data center power market size in 2025; mega facilities climbed at a 14.95% CAGR between 2026 and 2031.
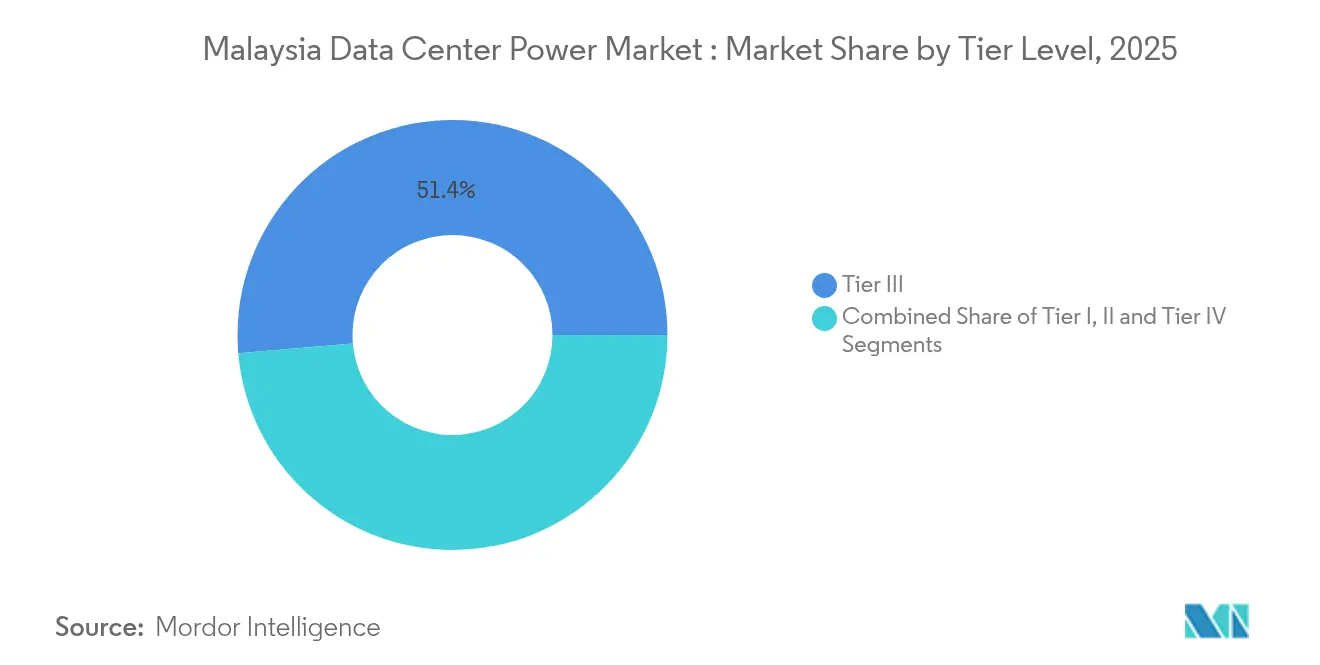
- By tier level, Tier III sites captured 51.35% Malaysia data center power market share in 2025, whereas Tier IV sites expanded at a 13.33% CAGR over the forecast period
Note: Market size and forecast figures in this report are generated using Mordor Intelligence’s proprietary estimation framework, updated with the latest available data and insights as of 2026.
Malaysia Data Center Power Market Trends and Insights
Drivers Impact Analysis*
| Driver / Restraint (as applicable) | (~) % Impact on CAGR Forecast | Geographic Relevance | Impact Timeline |
|---|---|---|---|
| Rising adoption of hyperscale and cloud data centres | +3.2% | Johor, Cyberjaya | Medium term (2-4 years) |
| Spill-over demand from Singapore moratorium | +2.8% | Johor, Kuala Lumpur | Short term (≤ 2 years) |
| Government MyDIGITAL incentives and GPP guidelines | +1.9% | National | Medium term (2-4 years) |
| TNB Green-Lane fast-track grid connections | +1.7% | Johor, Selangor, Kuala Lumpur | Short term (≤ 2 years) |
| Corporate Green Power Programme (CGPP) boosting on-site RE | +1.5% | National | Medium term (2-4 years) |
| High national reserve margin enabling >2 GW new DC load | +1.2% | Johor, Selangor | Medium term (2-4 years) |
| Source: Mordor Intelligence | |||
Rising adoption of hyperscale and cloud data centres
Power densities above 60 kW per rack are becoming the norm, compelling upgrades in switchgear, UPS, and liquid-cooling infrastructure. Microsoft’s USD 2 billion Johor campus illustrates the strategic cost advantage Malaysia offers vis-à-vis Singapore. TNB has earmarked grid enhancements capable of delivering 2 GW for just ten hyperscale projects, showing the systemic scale of this demand. The Malaysia data center power market is therefore shifting toward modular, high-capacity electrical backbones that can flex with rising rack power-draw requirements. The hyperscale segment's growth is reshaping power infrastructure requirements, with TNB enhancing its grid capabilities to accommodate the projected 2,000MW demand from just ten data center projects.
Spill-over demand from Singapore moratorium
Singapore’s cap on new facilities has redirected capital to proximate Johor, where build-ready sites, lower tariffs, and the Johor-Singapore Special Economic Zone create a seamless extension of the island state’s digital ecosystem. Princeton Digital Group and other investors have leveraged this cross-border proximity, driving land prices in Johor technology parks sharply higher. Local construction firms face order backlogs, amplifying indirect economic benefits. The Malaysia data center power market is thus seeing accelerated contracting for transformers, switchgear, and underground cabling dedicated to Johor projects set to go live within 24 months.[1]Tenaga Nasional Berhad, “Integrated Annual Report 2024,” tnb.com.my
Government MyDIGITAL incentives and GPP guidelines
The Malaysia Digital Economy Blueprint (MyDIGITAL) has emerged as a pivotal framework for attracting data center investments, with a target to increase the digital economy's contribution to GDP from 23% in 2022 to over 25% by 2025. [2]Digital Investment Office, “DIO Playbook,” mydigitalinvestment.gov.myThe MyDIGITAL framework couples a 100% tax holiday with standardized planning rules for projects above 1 MW. By minimizing procedural ambiguity, it reduces developer risk premiums and expedites financing approvals. The Data Center Planning Guidelines (GPP) additionally embed sustainability metrics that have become critical for international cloud firms under Scope 3 mandates. Collectively, these policies shave months off approval timetables and keep the Malaysia data center power market on a predictable expansion path.
Corporate Green Power Programme (CGPP) boosting on-site RE
Malaysia’s CGPP allows data-center operators to sign virtual power-purchase agreements with renewable developers, improving visibility on long-term energy costs. September 2024’s CRESS scheme builds on this by permitting direct renewable procurement, catalyzing solar-plus-battery installations on brownfield campuses. As companies raise renewable-energy thresholds to 100%, on-site generation and bundled renewable energy certificates are becoming core to datacenter vendor selection.[3]Ministry of Economy Malaysia, “Corporate Green Power Programme Guidelines,” economy.gov.my The Malaysia data center power market is consequently witnessing a jump in co-located PV arrays sized between 20 MW and 50 MW.
Restraint Impact Analysis*
| Driver / Restraint (as applicable) | (~) % Impact on CAGR Forecast | Geographic Relevance | Impact Timeline |
|---|---|---|---|
| High capex and opex for high-density power systems | -1.8% | National | Medium term (2-4 years) |
| Grid bottlenecks in Johor and potential tariff hikes | -1.5% | Johor | Medium term (2-4 years) |
| Scarcity of HV/MV electrical engineers | -0.9% | Johor, Cyberjaya | Short term (≤ 2 years) |
| Water-use and emissions limits may delay approvals | -0.7% | Johor, emerging regions | Medium term (2-4 years) |
| Source: Mordor Intelligence | |||
Grid bottlenecks in Johor and potential tariff hikes
The unprecedented clustering of facilities in Johor is absorbing substation headroom faster than upgrades can be completed. Connection queues have lengthened, and the upcoming Regulated Period 4 tariff revision could push electricity charges higher, impacting colocation operators on slim margins. Should tariffs rise sharply, some developers may pivot to Klang Valley or Sarawak where spare grid capacity and renewable resources are more plentiful. This risk tempers the otherwise bullish Johor investment narrative within the Malaysia data center power market.
Scarcity of HV/MV electrical engineers
The surge in data-center builds has outstripped the available pool of engineers certified to design and commission 33 kV and 132 kV systems. Competition for this talent from utilities, petrochemical plants, and Singaporean projects is driving wage inflation that feeds directly into project budgets. Delayed handover of electrical rooms due to staffing gaps jeopardizes go-live dates, making workforce planning a critical path item in every Malaysia data center power market construction schedule.
*Our forecasts treat driver/restraint impacts as directional, not additive. The impact forecasts reflect baseline growth, mix effects, and variable interactions.
Segment Analysis
By Component: UPS Systems lead critical power infrastructure
UPS platforms held a 41.55% Malaysia data center power market share in 2025, underlining their importance in mitigating grid instability. New projects increasingly specify modular lithium-ion architectures that can be expanded in 500 kW blocks, aligning capex with staged tenant ramp-ups. Event logs from major campuses show battery health analytics reducing unplanned outages by 30%, a metric gaining board-level attention among cloud operators. Meanwhile, PDUs are forecast to rise 12.74% annually as intelligent metering and outlet-level switching become standard for high-density racks. The Malaysia data center power market size for PDUs is projected to touch USD 124.01 million by 2031, driven by hyperscale procurement frameworks that demand detailed energy-usage telematics.


By Data Center Type: Colocation providers capitalize on strategic advantages
Colocation operators captured 35.21% Malaysia data center power market share in 2025 due to competitive tariff levels of 33.7 sen per kWh and mature carrier ecosystems. Their agile procurement timelines attract mid-sized cloud, fintech, and content platforms seeking rapid regional entry. The Malaysia data center power market size for colocation is expected to grow, buoyed by rising rack-power commitments from AI start-ups. Hyperscale players, though smaller in 2025, are scaling fastest at 13.18% CAGR as Microsoft, Google, and Amazon lock in multi-phase Johor campus builds exceeding 100 MW each.
By Data Center Size: Large facilities dominate while Mega centers surge
Large data centers held a 39.25% share in 2025 on the strength of balanced capex profiles and existing fiber access in Cyberjaya and Klang Valley. These facilities often convert legacy office parks, leveraging sunk land costs and municipal permits. The Malaysia data center power market size for mega sites will grow modestly at 14.95% CAGR, reflecting a pivot by developers toward even bigger campuses. As rack densities climb, massive campuses are trialing 33 kV distribution to the row level to minimize transformer losses. Some are also reserving ducts for future direct-liquid-cooling loops, anticipating GPUs that may breach 1 kW per chip.
By Tier Level: Tier III standardization meets Tier IV innovation
Tier III facilities commanded 51.35% share in 2025, offering 99.982% uptime and the lowest cost per protected kilowatt among mainstream options. They remain the default choice for banking, government, and SaaS tenants that balance resilience with fiscal prudence. Nevertheless, Tier IV capacity is growing 13.33% annually as fintech, healthcare, and mission-critical AI inference require fault-tolerant configurations with 2N redundancy. Tier IV newcomers are adopting medium-voltage UPS topologies that reduce copper use by 20% and simplify maintenance.
Geography Analysis
Johor growth engine of the Malaysia data center power market, expected to attract huge investments by end-2025. Grid-side upgrades such as the 275 kV Senai substation extension are timed to meet fresh hyperscale energization windows, cementing Johor’s position as Southeast Asia’s fastest-growing hub. Yet, environmental permitting has tightened, with nearly 30% of applications halted to safeguard water resources, signaling that power availability alone will not guarantee project approval. Klang Valley, covering Kuala Lumpur and Cyberjaya, remains Malaysia’s most mature corridor, thanks to dense carrier hotels and business-district adjacency. Cyberjaya’s installed capacity is on pace for 141.7 MW by 2025, while Vantage’s 256 MW KUL2 campus will re-affirm the region’s relevance for hybrid cloud deployments that need low-latency connectivity to financial exchanges and national ministries. These developments sustain healthy demand for secondary power feeders and diverse fiber routes in Selangor, anchoring a steady pipeline of medium-scale colocation builds
Competitive Landscape
The Malaysia data center power market hosts a mix of global electrical majors and focused specialists. Schneider Electric, ABB, and Vertiv dominate switchgear, UPS, and monitoring platforms through entrenched distributor networks and aggressive local-service commitments. Vertiv’s custom PDU line is popular among hyperscale builders who require outlet-level telemetry for AI nodes. Eaton’s Brightlayer suite integrates power-chain data with IT asset management, a capability increasingly valued for ESG reporting.
Tenaga Nasional Berhad, while not a vendor, has become a pivotal ecosystem player by offering the Green-Lane Pathway and direct engagement forums that align grid upgrades with campus roadmaps. Such utility-operator collaboration shortens commissioning horizons and lowers project risk premiums. Local engineering houses, meanwhile, are forming joint ventures with international equipment makers to satisfy localisation rules and capture after-sales revenue.
Malaysia Data Center Power Industry Leaders
ABB Ltd
Schneider Electric SE
Vertiv Group Corp.
Eaton Corporation
Caterpillar Inc.
- *Disclaimer: Major Players sorted in no particular order

Recent Industry Developments
- May 2025: Malaysia Digital Economy Corporation reported 54 operational data centers and 24 underway, with projects worth RM 9.9 billion approved between January and mid-April 2025.
- May 2025: Microsoft launched its first Malaysian data-center region, expanding local AI and cloud availability.
- March 2025: Treasure Global Inc. unveiled plans for AI cloud infrastructure in Malaysia, reinforcing demand for high-density power
- February 2025: The federal government issued Data Center Planning Guidelines governing projects above 1 MW, standardizing zoning and sustainability criteria.


Research Methodology Framework and Report Scope
Market Definitions and Key Coverage
Our study defines the Malaysia data center power market as the annual revenue earned inside Malaysia from electrical infrastructure that supplies, distributes, backs up, or monitors power within purpose-built data centers. This includes UPS systems, diesel, gas, H2 generators, PDUs, switchgear, transfer switches, remote power panels, flywheel or lithium-ion storage, and associated installation and maintenance services.
Scope exclusion: temporary rental power sets and small on-premise server rooms are not counted.
Segmentation Overview
- By Component
- Electrical Solutions
- UPS Systems
- Generators
- Diesel Generators
- Gas Generators
- Hydrogen Fuel-cell Generators
- Power Distribution Units
- Switchgear
- Transfer Switches
- Remote Power Panels
- Energy-storage Systems
- Service
- Installation and Commissioning
- Maintenance and Support
- Training and Consulting
- Electrical Solutions
- By Data Center Type
- Hyperscaler/Cloud Service Providers
- Colocation Providers
- Enterprise and Edge Data Center
- By Data Center Size
- Small Size Data Centers
- Medium Size Data Centers
- Large Size Data Centers
- Massive Size Data Centers
- Mega Size Data Centers
- By Tier Level
- Tier I and II
- Tier III
- Tier IV
Detailed Research Methodology and Data Validation
Primary Research
Mordor analysts next interview power equipment vendors, colocation operators in Johor and Cyberjaya, facility engineers, and grid planners across Southeast Asia. The conversations validate utilization rates, average selling prices, rack power density trends, and the speed at which hyperscale capacity enters service.
Desk Research
We start by pulling hard numbers from trusted open sources such as the Department of Statistics Malaysia, Energy Commission tariff tables, Tenaga Nasional Berhad ESA disclosures, and investment approvals published by MIDA. Company filings retrieved through D&B Hoovers and news archives on Dow Jones Factiva add spending and pipeline clues, while import records from Volza and patent counts in Questel help size equipment inflows and innovation momentum. These inputs give our analysts a grounded picture of shipments, installed base, and price shifts. The sources cited here are illustrative only; many additional documents were reviewed to cross-check and refine figures.
Market-Sizing & Forecasting
A top-down read of data center MW demand (derived from live plus pipeline capacity and typical load factors) is balanced once with supplier roll-ups of UPS and generator shipments to fine-tune totals. Key variables like rack density progression, electricity tariff indexation, renewable share in power mix, hyperscale capacity pipeline, and average UPS cost per kVA feed a multivariate regression model that projects revenue through 2030. Where bottom-up inputs are patchy, we interpolate using regional benchmarks before reconciling both views.
Data Validation & Update Cycle
Outputs run through variance checks against government load data and import trends, followed by a senior review round. Reports refresh every twelve months, and an interim pass is triggered when material events such as tariff hikes or greater than 200 MW campus announcements occur, so clients always receive the latest view.
Why Mordor's Malaysia Data Center Power Baseline Stands Out
Published estimates often diverge because firms pick different component baskets, currency bases, and refresh cadences.
Key gap drivers include whether services revenue is counted, if ASP inflation is linked to volatile diesel prices, the way grid upgrades are factored, and how quickly pipeline projects are assumed to ramp. Mordor Intelligence captures full service revenue, applies quarterly FX updates, and aligns project energization dates with actual TNB ESA milestones, producing a balanced, verifiable baseline.
Benchmark comparison
| Market Size | Anonymized source | Primary gap driver |
|---|---|---|
| USD 357.84 M (2025) | Mordor Intelligence | - |
| USD 317.80 M (2024) | Regional Consultancy A | Excludes after-sales services and leaves currency fixed at 2022 average |
| USD 317.80 M (2025) | Industry Association B | Assumes linear ramp of all announced capacity, no tariff escalation factor |
In short, by tying revenue to real energization dates and verified price curves, Mordor Intelligence delivers a dependable baseline that decision-makers can trace back to transparent variables and repeatable steps.


Key Questions Answered in the Report
What is the current value of the Malaysia data center power market?
The Malaysia data center power market size is USD 402.03 million in 2026 and is on track to hit USD 719.66 million by 2031.
Which component segment leads the market?
UPS systems lead with 41.55% Malaysia data center power market share in 2025 due to heightened reliability needs.
Why is Johor attracting so many data centers?
Johor benefits from spill-over demand caused by Singapore’s capacity cap, lower tariffs, and streamlined permitting within the Johor-Singapore Special Economic Zone.
How fast are hyperscale facilities growing in Malaysia?
Hyperscale and cloud sites are forecast to grow at an 13.18% CAGR between 2026 and 2031, driven by AI workloads and multi-billion investments from global tech firms.
Are grid constraints a major risk?
Yes, localized transmission bottlenecks in Johor and potential tariff revisions under RP4 could slow energization schedules, though national reserve margins remain high.
Page last updated on:


