Singapore Data Center Power Market Size and Share
Market Overview
| Study Period | 2020 - 2031 |
|---|---|
| Forecast Data Period | 2026 - 2031 |
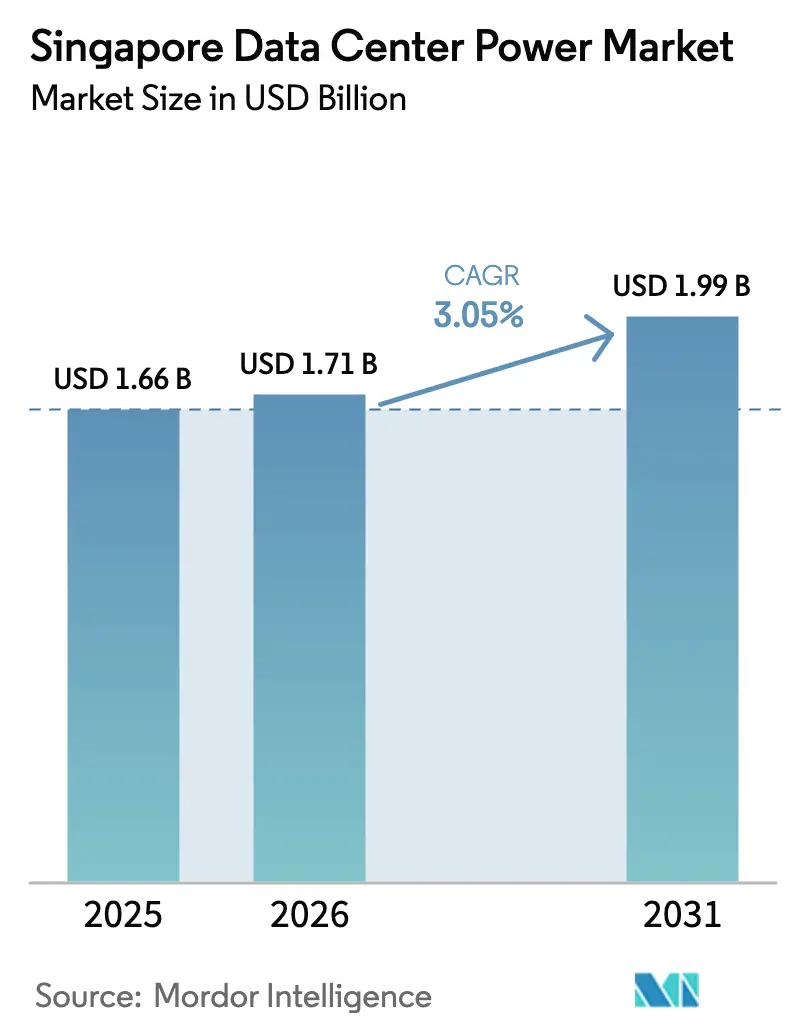
| Base Year Market Size (2025) | USD 1.66 Billion |
| Market Size (2026) | USD 1.71 Billion |
| Market Size (2031) | USD 1.99 Billion |
| Growth Rate (2026 - 2031) | 3.05% CAGR |
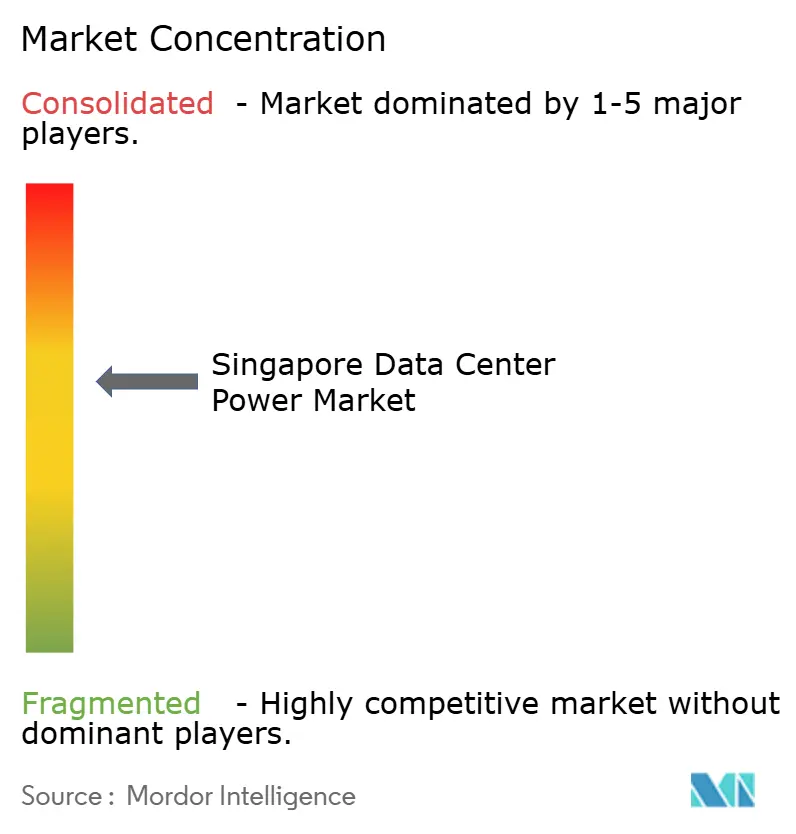
| Market Concentration | Medium |
Major Players *Disclaimer: Major Players sorted in no particular order Image © Mordor Intelligence. Reuse requires attribution under CC BY 4.0. | |
Singapore Data Center Power Market Analysis by Mordor Intelligence
The Singapore data center power market size is expected to grow from USD 1.66 billion in 2025 to USD 1.71 billion in 2026 and is forecast to reach USD 1.99 billion by 2031 at 3.05% CAGR over 2026-2031. Growth remains steady rather than rapid because strict land-use rules and a capped national power envelope limit outright capacity additions. Operators, therefore, focus on squeezing higher efficiency out of every installed megawatt, driving rapid uptake of lithium-ion UPS systems, intelligent PDUs, and renewable micro-grids. The government’s May 2024 Green Data Centre Roadmap, which released 300 MW of extra capacity tied to stringent efficiency metrics, has revived investment appetite. At the same time, AI workloads are pushing rack densities from 8.5 kW toward 12 kW, compelling facilities to upgrade medium-voltage distribution, liquid cooling, and on-site generation. Collaboration among equipment vendors, energy firms, and data-center operators has intensified around hydrogen fuel cells, a technology well suited to Singapore’s emissions limits and space constraints.
Key Report Takeaways
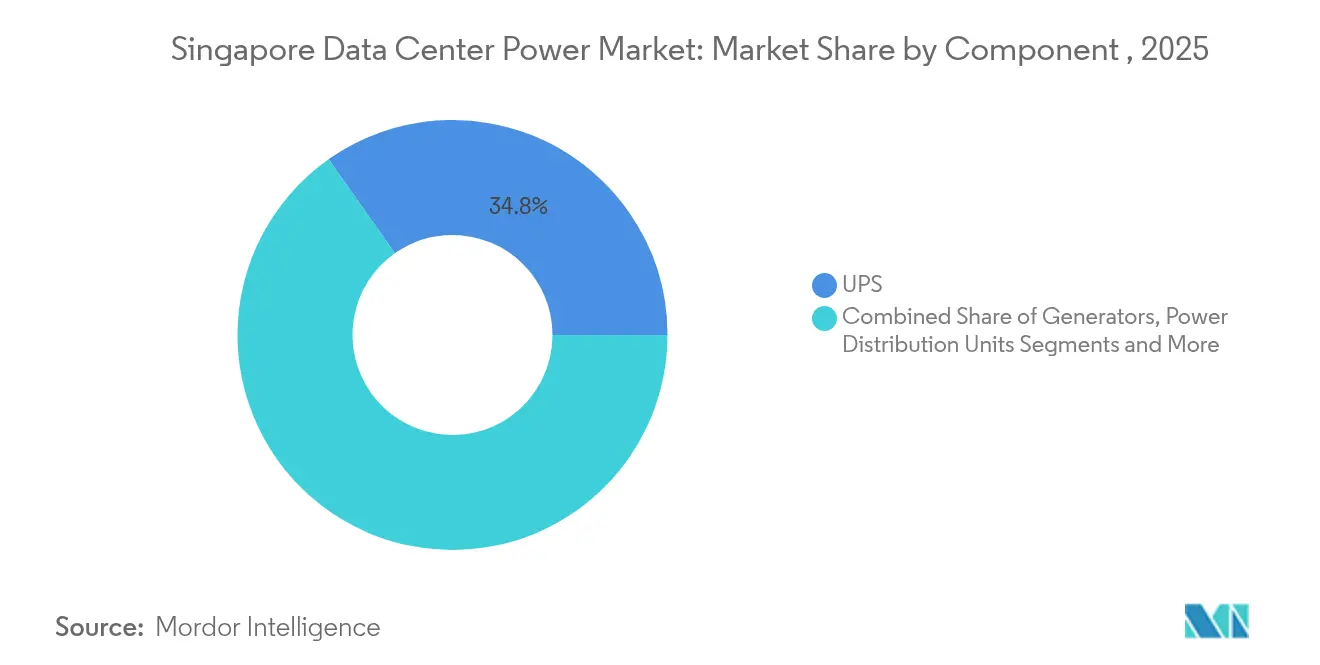
- By component, UPS systems led with 34.78% of the Singapore data center power market share in 2025, while power distribution units are set to expand at a 4.65% CAGR through 2031.
- By data-center type, colocation providers held 31.62% revenue share in 2025; hyperscale/cloud service providers record the fastest projected CAGR at 5.28% for 2026-2031.
- By data-center size, large data centers commanded 33.68% of the Singapore data center power market size in 2025; mega centers are projected to advance at a 4.95% CAGR to 2031.
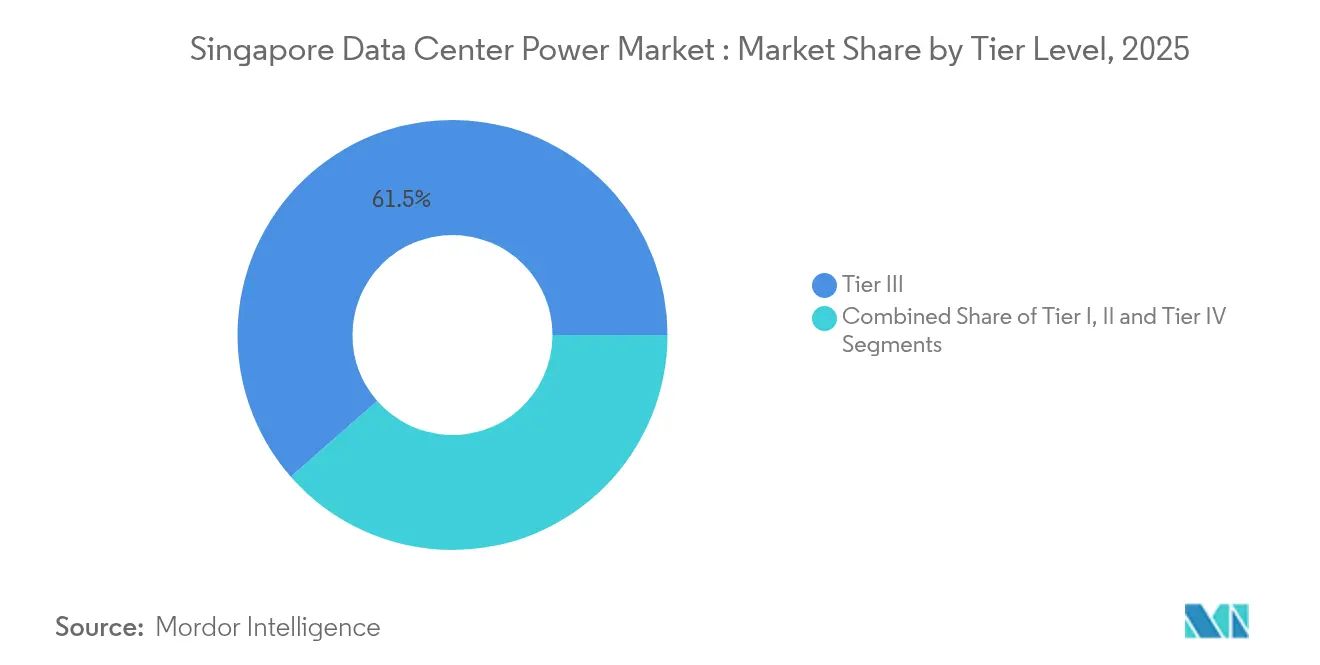
- By tier level, Tier 3 facilities dominated with a 61.45% share in 2025, while Tier 4 facilities show the highest growth trajectory at a 4.48% CAGR through 2031.
Note: Market size and forecast figures in this report are generated using Mordor Intelligence’s proprietary estimation framework, updated with the latest available data and insights as of 2026.
Singapore Data Center Power Market Trends and Insights
Drivers Impact Analysis*
| Driver | (~)% Impact on CAGR Forecast | Geographic Relevance | Impact Timeline |
|---|---|---|---|
| Surge in hyperscale and cloud deployments | +1.1% | Singapore, with spillover to Malaysia and Indonesia | Medium term (2-4 years) |
| Demand for energy-efficient UPS and generators | +0.8% | Singapore | Short term (≤ 2 years) |
| Government green-DC incentives post-moratorium | +0.7% | Singapore | Medium term (2-4 years) |
| On-site hydrogen / renewable micro-grids | +0.6% | Singapore | Long term (≥ 4 years) |
| AI edge workloads >30 kW per rack | +0.5% | Singapore, with spillover to regional markets | Medium term (2-4 years) |
| ASEAN cross-border clean-power imports | +0.3% | Singapore, Malaysia, Indonesia | Long term (≥ 4 years) |
| Source: Mordor Intelligence | |||
Surge in hyperscale and cloud deployments
Pent-up demand released after the moratorium has boosted build plans by operators that can prove exceptional efficiency. Equinix committed USD 260 million to its SG6 site, adding 20 MW by 2027.[1]Equinix Inc., “Equinix to Help Accelerate AI Innovation in Singapore with USD 260 Million Data Center Expansion,” equinix.comMedium-voltage switchgear and modular power rooms allow incremental scaling that fits Singapore’s restricted grid quotas. The hyperscale wave also drives regional spillover, particularly to Johor, where land and power are more plentiful yet still close to Singapore’s network interconnects. Providers are prioritizing adaptive architectures that can integrate renewable supplies and support liquid-cooled racks to stay within the roadmap’s PUE cap of 1.3.
Demand for energy-efficient UPS and generators
Electricity accounts for up to 45% of a facility’s operating cost in Singapore, so efficiency gains translate directly into competitiveness. Next-generation UPS units now reach 97% in double-conversion mode and exploit lithium-ion batteries that trim floor space by 40% and extend service life beyond eight years.[2]Salicru, “Implementation of a UPS in a Datacenter,” salicru.com Intelligent firmware switches equipment into economy mode whenever loads permit, saving 2-3% of site power. Generators are evolving just as quickly; emissions-capped diesel sets are giving way to hybrid flywheel-battery systems and pilot hydrogen fuel cells that promise zero local pollutants and lower acoustic footprints.
Government green-DC incentives post-moratorium
The Green Data Centre Roadmap links new capacity allocations to strict energy and water efficiency benchmarks. Operators achieving a PUE ≤ 1.3 and WUE ≤ 2.0 m³/MWh qualify for enhanced tax allowances and accelerated permitting.[3]Infocomm Media Development Authority,“ Green Data Centre (DC) Roadmap,”imda.gov.sg The Energy Efficiency Grant, introduced in October 2024, offsets up to 30% of the cost for high-efficiency IT upgrades, rewarding both facility owners and tenants. These measures have turned compliance costs into competitive differentiators, prompting a race to deploy advanced UPS topologies, variable-speed chillers, and grid-interactive power modules.
On-site hydrogen / renewable micro-grids
Singapore’s urban density limits bulk fuel storage, making clean, compact alternatives attractive. Equinix and the National University of Singapore are testing proton-exchange-membrane fuel cells configured for data-center backup duty. Bloom Energy solid-oxide platforms, deployed with SK ecoplant, supply baseload power to a 10-MW hall, cutting annual CO₂ by 20,000 tons. Integrating fuel cells with rooftop solar and battery storage forms resilient micro-grids capable of islanded operation during grid events, a feature valued by financial-services tenants.
Restraints Impact Analysis*
| Restraint | (~)% Impact on CAGR Forecast | Geographic Relevance | Impact Timeline |
|---|---|---|---|
| High CAPEX of power infrastructure | -0.8% | Singapore | Medium term (2-4 years) |
| Limited land and grid capacity | -0.6% | Singapore | Long term (≥ 4 years) |
| Emission caps on diesel gensets | -0.4% | Singapore | Short term (≤ 2 years) |
| MV-switchgear copper shortages | -0.2% | Global, with heightened impact in Singapore | Short term (≤ 2 years) |
| Source: Mordor Intelligence | |||
High CAPEX of power infrastructure
Next-generation systems carry price premiums, with lithium-ion UPS modules costing 15–20% more than lead-acid and direct-liquid-cooling loops priced up to 20 times above standard air units. Hydrogen fuel-cell stacks remain several hundred dollars per kilowatt higher than diesel sets, although falling electrolyzer costs are narrowing the gap. Smaller operators struggle to absorb these outlays, prompting consolidation or joint-venture builds
Emission caps on diesel gensets
Tightening particulate and NOx limits shorten the permitting horizon for traditional diesel backups. Operators must retrofit selective catalytic reduction or shift to cleaner fuels, incurring unexpected costs and scheduling complexity. The rule accelerates the pivot to battery–fuel-cell hybrids but creates friction during the transition.
*Our forecasts treat driver/restraint impacts as directional, not additive. The impact forecasts reflect baseline growth, mix effects, and variable interactions.
Segment Analysis
By Component: UPS Systems Sustain Leadership While PDUs Accelerate
UPS systems account for 34.78% of the Singapore data center power market, underlining their role in maintaining near-zero downtime amid a dense urban grid susceptible to quality fluctuations. Widespread migration to lithium-ion chemistries has freed about 20,000 square feet across operating sites, enabling more racks within an unchanged footprint. Hot-swappable power modules allow maintenance without load transfer, a feature valued by banking tenants. Vendors now bundle digital-twin software that models runtime against weather, grid status, and compute load, trimming over-provisioning by 5%.
Power distribution units are projected to rise at a 4.65% CAGR, the fastest of any component, driven by IP-addressable designs that monitor voltage, current, and temperature at the outlet level. Universal-input PDUs from Legrand accept 16 A to 63 A feeds, easing procurement across mixed hall voltages. Generators hold steady volumes but are rapidly shifting toward dual-fuel natural-gas blends or pure hydrogen, aligning with emissions curbs. Transfer switches adopt static solid-state designs for sub-4-millisecond transfers, eliminating the brief outage tolerated by spinning ATS units.


By Data Center Type: Colocation Dominates While Hyperscale Growth Quickens
Colocation providers secured 31.62% revenue share in 2025 as multinational enterprises selected Singapore for regional presence without incurring greenfield costs. Operators such as Iron Mountain run on 100% renewable electricity, appealing to corporate sustainability reporting needs. Facilities typically scale between 5 MW and 20 MW, balancing density with the ability to source power allocations from the national grid. Service portfolios have widened to include managed liquid cooling loops and AI-ready containment zones, capturing higher-margin workloads.
Hyperscale/cloud service providers are on track for a 5.28% CAGR, propelled by surging demand for GPU compute across fintech, gaming and language-model training. Cloud tenants often underwrite renewable PPAs, de-risking grid volatility for all campus occupants. New sites reserve roof and façade space for 3 MWp of solar, meeting Green Mark Platinum certification thresholds.
By Data Center Size: Large Facilities Rule While Massive Sites Scale Up
Large data centers, defined as 5–15 MW power envelopes, hold 33.68% share and form the backbone on which Singapore’s network-dense ecosystem rests. They occupy mature industrial zones where dual 66 kV feeders already exist, avoiding lengthy substation upgrades. Many such sites retrofit high-temperature chilled-water loops, elevating supply temperatures from 7 °C to 15 °C and saving up to 8% of facility energy.
Mega Data Centers are set for a 4.95% CAGR as AI and content delivery require single-campus latency and bandwidth. Operators employ heat-reuse schemes, piping 40 °C coolant to industrial neighbors or district cooling grids. They also tap barge-mounted LNG generators during commissioning phases, easing the draw on the utility network.

By Tier Level: Tier 3 Underpins Reliability While Tier 4 Advances
Tier 3 configurations dominate at 61.45% because they deliver 99.982% availability with N+1 redundancy, enough for most enterprise SLAs. Modular power rooms shorten maintenance windows, while redundant utility paths meet SS 507 disaster-recovery guidelines. Recertification cycles align with tenancy renewals, cementing the preference for Tier 3.
Tier 4 facilities, growing at 4.48% CAGR, meet the zero-downtime expectations of financial trading, payment gateways, and critical health-data platforms. A 2N topology doubles capex but gains upside through premium lease rates. Telin Singapore demonstrates a multi-tier campus where Tier 4 blocks serve high-availability racks and Tier 2 suites host test environments. The arrangement optimizes capital deployment while matching diverse risk appetites.
Geography Analysis
Grid authorities allocate capacity only to proposals that demonstrate at least 20% energy savings over the baseline. Regional dynamics increasingly shape strategy. Limited land pushes overflow demand north to Johor’s Sedenak Tech Park, where grid tariffs and rents are lower, yet subsea cables offer sub-2 millisecond round-trip latency. Some operators adopt an active-passive model, positioning primary workloads in Singapore and disaster-recovery copies across the strait, balancing risk and cost.
Cross-border clean-power imports add a second geographic dimension. Early pilot trades import 100 MW of hydro power from Malaysia; larger 1 GW solar-plus-storage projects in Riau Islands are on the drawing board. Data-center owners negotiate PPA clauses that match contract tenure with equipment life, creating predictable carbon-free electricity streams that satisfy Scope 2 reporting.
Competitive Landscape
Competition is moderate, with roughly a dozen global equipment majors and a cadre of regional specialists addressing different layers of the value chain. Vendors now compete less on raw kilowatt capacity and more on efficiency, sustainability credentials, and deployment speed. Eaton and Siemens Energy’s 2025 partnership bundles a 500 MW modular plant with Eaton switchgear, trimming build schedules by up to two years.
Hydrogen fuel-cell providers such as Bloom Energy move early to secure pilot deployments, aiming to lock in future fleet orders as regulation tightens on diesel. UPS manufacturers differentiate through patent-backed digital-twin analytics, predictive cell balancing, and high-temperature operating ranges. Schneider Electric and Vertiv showcase containerized micro-grids that combine battery storage, fuel cells, and MV switchboards in a single ISO frame, simplifying site logistics.
Software overlays emerge as a decisive factor. DCIM platforms integrating AI-driven cooling and power optimization reduce energy by 3–5%, translating into direct margin gains. Vendors able to link equipment telemetry with power-purchase data appeal to operators chasing both efficiency and renewable compliance. This service-centric shift opens opportunity for smaller technology houses to partner with incumbents.
Singapore Data Center Power Industry Leaders
ABB Ltd
Caterpillar Inc.
Cummins Inc.
Eaton Corporation plc
Legrand SA
- *Disclaimer: Major Players sorted in no particular order

Recent Industry Developments
- June 2025: Eaton and Siemens Energy formed a partnership to deliver integrated, grid-independent power blocks that shorten construction time for new facilities by up to two years.
- March 2025: ABB bought a minority stake in DG Matrix, deepening its commitment to power solutions tailored to high-density AI halls.
- February 2025: Equinix and the National University of Singapore opened a USD 4 million co-innovation facility to trial sustainable power and cooling technologies.
- November 2024: Equinix announced USD 260 million for its SG6 data center, adding 20 MW tailored for AI racks.


Research Methodology Framework and Report Scope
Market Definitions and Key Coverage
The study defines Singapore's data center power market as all revenues generated inside the country from the sale, installation, and lifecycle support of electrical infrastructure, including uninterruptible power supplies, generators running on diesel, gas or hydrogen, power distribution units, switchgear, transfer switches, remote power panels, and on-site energy storage systems that feed IT racks in colocation, hyperscale, enterprise, and edge facilities. According to Mordor Intelligence, services linked to these assets, such as commissioning, maintenance, and training, are included because they shape total cost of ownership for local operators.
Scope exclusion: cooling equipment, IT hardware, and real estate investments fall outside this definition.
Segmentation Overview
- By Component
- Electrical Solutions
- UPS Systems
- Generators
- Diesel Generators
- Gas Generators
- Hydrogen Fuel-cell Generators
- Power Distribution Units
- Switchgear
- Transfer Switches
- Remote Power Panels
- Energy-storage Systems
- Service
- Installation and Commissioning
- Maintenance and Support
- Training and Consulting
- Electrical Solutions
- By Data Center Type
- Hyperscaler/Cloud Service Providers
- Colocation Providers
- Enterprise and Edge Data Center
- By Data Center Size
- Small Size Data Centers
- Medium Size Data Centers
- Large Size Data Centers
- Massive Size Data Centers
- Mega Size Data Centers
- By Tier Level
- Tier I and II
- Tier III
- Tier IV
Detailed Research Methodology and Data Validation
Primary Research
We interviewed facility engineers, procurement heads at colo providers, generator distributors, and independent power consultants across Southeast Asia. These conversations validated component life cycles, negotiated ASP ranges, and upcoming capacity releases, letting us refine assumptions derived from desk material.
Desk Research
Our analysts started with statistics from agencies such as Singapore's Energy Market Authority, the Infocomm Media Development Authority, and the Department of Statistics, then layered trade flow data from Volza and patent insight from Questel to spot technology shifts. Company 10-Ks, grid upgrade tenders, and news archived in Dow Jones Factiva provided run rate pricing and deployment timing. White papers by the Singapore Data Center Association and peer-reviewed energy efficiency journals helped benchmark power usage effectiveness trends. This list is illustrative; many more sources guided data capture, cross-checks, and clarification.
Market-Sizing & Forecasting
The model begins with a top-down reconstruction of the national installed IT load, using capacity allocations, average rack densities, and published utilization rates. Revenues emerge after applying current component penetration and price ladders, which are then sampled bottom up through supplier roll-ups for alignment. Key variables include permitted new build megawatts, median UPS replacement cycles, generator fuel switch trends, service attach rates, and the mandated PUE cap of 1.3. A multivariate regression, supplemented by scenario analysis for future DC CFA awards, produces the 2025-2030 outlook. Gaps in bottom up inputs, especially on private deals, are bridged with regional analogs and primary source ranges before final calibration.
Data Validation & Update Cycle
Outputs pass variance checks against grid demand, import statistics, and known project pipelines. Senior reviewers sign off only after anomalies are resolved. Reports refresh each year, with mid-cycle updates whenever policy changes or large hyperscale announcements shift the baseline.
Why Our Singapore Data Center Power Baseline Commands Reliability
Published values differ because firms choose contrasting scopes, pricing stacks, and refresh cadences.
Mordor's disciplined inclusion of services, latest post-moratorium capacity, and dynamic ASP tracking gives decision makers a grounded benchmark.
Benchmark comparison
| Market Size | Anonymized source | Primary gap driver |
|---|---|---|
| USD 1.66 B (2025) | Mordor Intelligence | - |
| USD 0.58 B (2024) | Global Consultancy A | Hardware only; excludes service revenues and retrofit spend |
| USD 0.44 B (2024) | Industry Publisher B | Uses 2019 capacity freeze scenario and flat ASP assumptions |
The comparison shows how narrower scopes and static assumptions compress external estimates. By tracing every figure to transparent variables and revisiting them yearly, we deliver a dependable, decision ready baseline.


Key Questions Answered in the Report
What is the current value of the Singapore data center power market?
The market is valued at USD 1.71 billion in 2026 and is projected to grow to USD 1.99 billion by 2031.
Which component segment holds the largest share?
UPS systems lead with 34.78% of market share, reflecting their critical role in ensuring uninterrupted operations.
How fast is the hyperscale data-center segment expanding?
Hyperscale and cloud facilities are forecast to grow at a 5.28% CAGR between 2026 and 2031, the fastest among data-center types.
What technologies are replacing diesel generators in Singapore?
Hydrogen fuel cells and hybrid battery systems are emerging as cleaner, more space-efficient alternatives to diesel gensets.
Why are intelligent PDUs gaining traction?
Intelligent PDUs provide outlet-level monitoring and remote control, enabling operators to cut ghost loads and optimize energy use, which is vital in Singapore’s high-cost electricity environment.
Page last updated on:


