Malaysia Data Center Market Size and Share
Market Overview
| Study Period | 2020 - 2031 |
|---|---|
| Forecast Data Period | 2026 - 2031 |
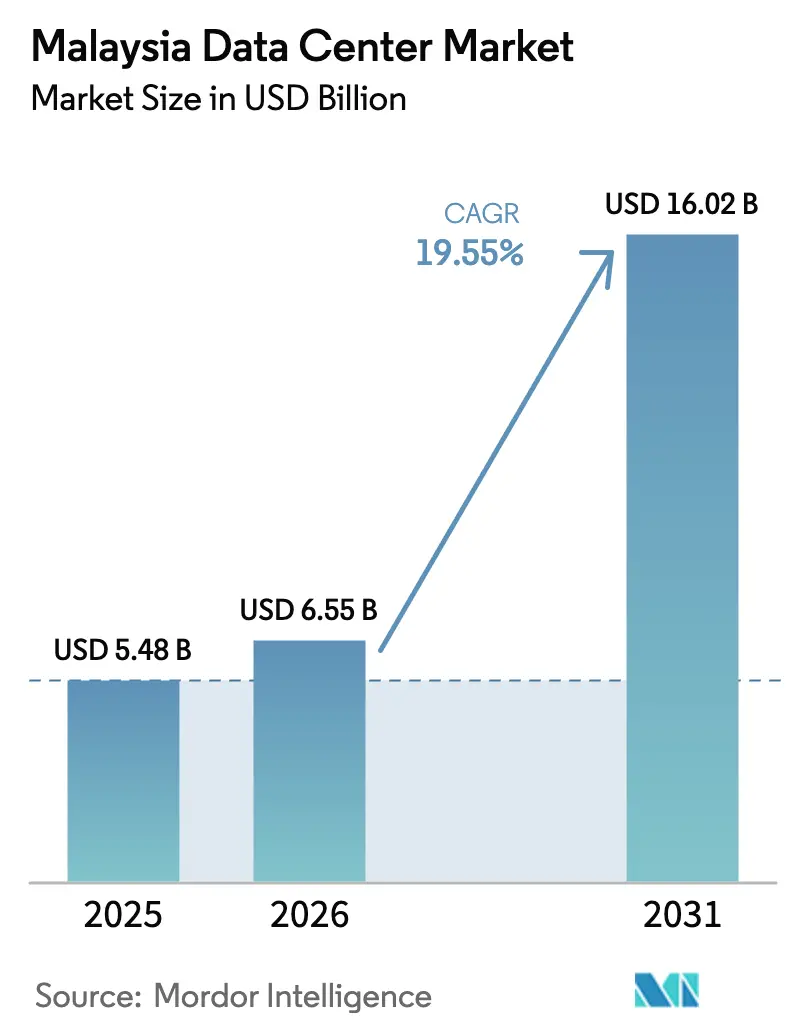
| Base Year Market Size (2025) | USD 5.48 Billion |
| Market Size (2026) | USD 6.55 Billion |
| Market Size (2031) | USD 16.02 Billion |
| Growth Rate (2026 - 2031) | 19.55% CAGR |
| Market Concentration | Medium |
Major Players *Disclaimer: Major Players sorted in no particular order Image © Mordor Intelligence. Reuse requires attribution under CC BY 4.0. | |
Malaysia Data Center Market Analysis by Mordor Intelligence
The Malaysia data center market size was valued at USD 5.48 billion in 2025 and estimated to grow from USD 6.55 billion in 2026 to reach USD 16.02 billion by 2031, at a CAGR of 19.55% during the forecast period (2026-2031). Power demand rises even faster, with IT load capacity projected to jump from 1.53 GW to 6.43 GW, a 33.24% CAGR, as artificial-intelligence workloads drive higher rack densities. The market segment shares and estimates are calculated and reported in terms of MW. Government incentives, hyperscaler commitments of MYR 90.2 billion (USD 20.3 billion), and submarine-cable additions reinforce Malaysia’s status as Southeast Asia’s new digital hub. Johor Bahru captures Singapore overflow demand while Cyberjaya benefits from the Multimedia Super Corridor infrastructure. Operators confront rising electricity tariffs and water supply constraints, prompting the need for renewable energy procurement strategies.[1]Reuters, “Equinix Malaysia Unit Eyes Alternative Energy Options amid Expected Electricity Tariff Hike,” reuters.com
Key Report Takeaways
- By data center type, colocation services led with a 95.42% market share of Malaysia's data center market in 2025; hyperscale/self-built facilities are projected to grow at a 30.40% CAGR through 2031.
- By hotspot, Johor Bahru accounted for 53.20% of the Malaysia data center market size in 2025, while Cyberjaya records the highest forecast CAGR at 29.60% through 2031.
- By tier type, Tier 3 facilities captured a 75.88% market share of the Malaysia data center market in 2025 and are projected to advance at a 34.10% CAGR through 2031.
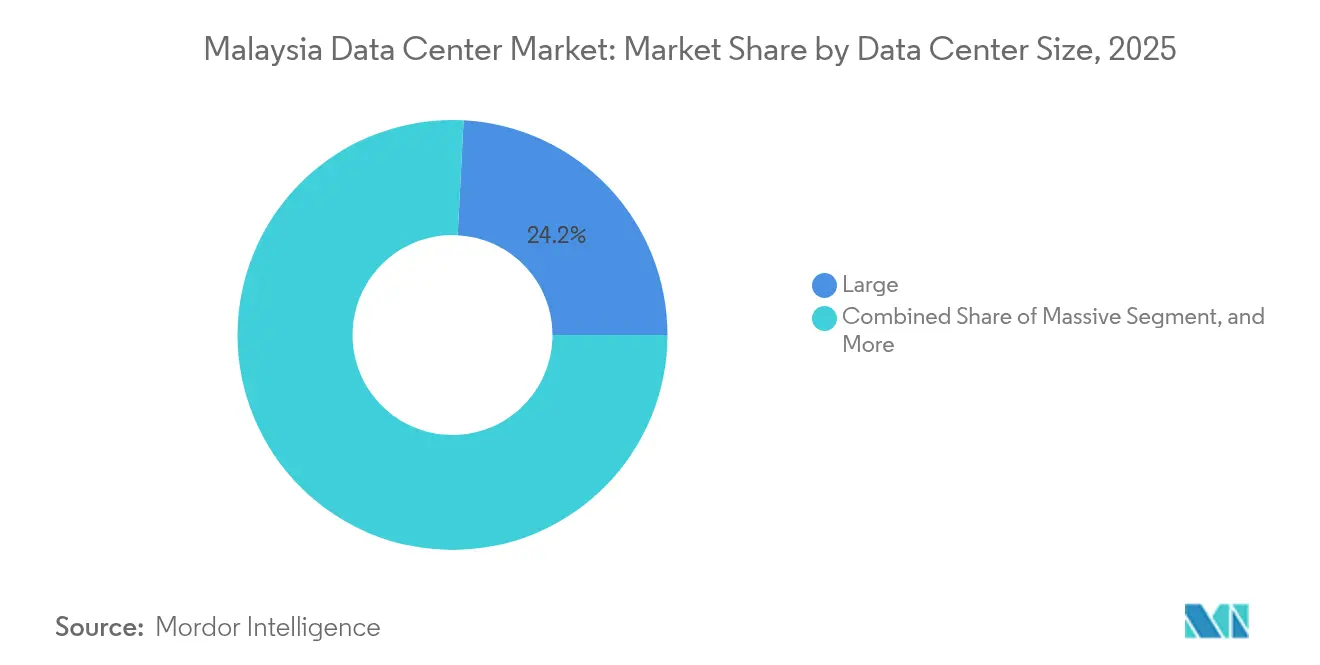
- By data center size, large sites held a 24.18% share of the Malaysian data center market in 2025; medium sites showed the fastest expansion at a 30.20% CAGR between 2026 and 2031.
- By end user, IT and telecommunications accounted for 51.12% of the 2025 revenue of the Malaysia data center market, whereas BFSI grew the fastest at a 29.40% CAGR through 2031.
Note: Market size and forecast figures in this report are generated using Mordor Intelligence’s proprietary estimation framework, updated with the latest available data and insights as of 2026.
Malaysia Data Center Market Trends and Insights
Drivers Impact Analysis*
| Driver | (~) % Impact on CAGR Forecast | Geographic Relevance | Impact Timeline |
|---|---|---|---|
| Rising hyperscale cloud deployments | +6.2% | Johor Bahru, Cyberjaya | Medium term (2-4 years) |
| Surge in FinTech and e-commerce digitalization | +4.8% | Kuala Lumpur, Penang | Short term (≤ 2 years) |
| Rapid submarine-cable landings boosting connectivity | +3.5% | Johor, Penang | Long term (≥ 4 years) |
| Government tax incentives for green ICT investments | +2.9% | Iskandar Malaysia, Cyberjaya | Medium term (2-4 years) |
| Penang-Johor industrial-corridor edge demand | +2.1% | Penang, Johor | Medium term (2-4 years) |
| AI training clusters driving 100-200 MW campuses | +4.7% | Johor Bahru, Cyberjaya | Long term (≥ 4 years) |
| Source: Mordor Intelligence | |||


Rising hyperscale cloud deployments
Google’s USD 2 billion region, Oracle’s USD 6.5 billion plan, and Microsoft’s USD 2.2 billion expansion redefine capacity needs by pushing rack power densities beyond 15 kW.[2]Bloomberg, “Google Unit Awards Data Center Contract to Malaysia’s Gamuda,” bloomberg.com These mega-projects require specialized cooling, redundant substations, and high-speed interconnection, which traditional colocation facilities seldom offer. YTL’s MYR 10 billion (USD 2.25 billion) NVIDIA alliance signals a shift among domestic players toward AI-ready campuses. Land and power procurement cycles are tightening as operators compete for sites in Johor and Negeri Sembilan with direct submarine cable access. The construction supply chain scales up to meet hyperscaler design standards, opening opportunities for local engineering, procurement, and construction firms. Long-term contracts also lock in renewable energy demand, which accelerates the national solar build-out.
Surge in FinTech and e-commerce digitalization
Touch ‘n Go eWallet, DuitNow, and regional cross-border payment schemes require sub-millisecond processing that legacy bank data centers cannot sustain.[3]Deloitte, “Beyond Payments: Digitalisation Trends in the Cross-Border Checkout Revolution,” deloitte.com Digital wallets captured 39% of online-transaction volume in 2023, amplifying demand for scalable compute and real-time fraud analytics nodes. Open-banking APIs further intensify traffic spikes as third-party fintech applications proliferate. Edge facilities in Kuala Lumpur and Penang shorten latency for densely populated urban centers, while disaster-recovery nodes in Johor ensure compliance with Bank Negara Malaysia’s resilience guidelines. The expanding e-commerce base is pushing merchants toward cloud-native architectures, reinforcing the upward trend in the Malaysian data center market.
Rapid submarine-cable landings boosting connectivity
Malaysia’s coastline welcomes new trans-Pacific and intra-ASEAN systems that cut latency to the U.S. West Coast to under 150 ms. Cable-landing stations in Johor and Penang drive campus-style data centers within a 3-km radius to minimize backhaul costs. Content providers cache video, gaming, and social-media workloads closer to end users, reducing Singapore's dependency. Enterprise multicloud strategies benefit from diverse north-south and east-west routes, improving redundancy for mission-critical SaaS applications. Cable consortia also negotiate renewable energy supply as part of their environmental, social, and governance (ESG) mandates, dovetailing with national decarbonization goals.
The Green Investment Tax Allowance and Green Income Tax Exemption offset up to 70% of capital expenditure on efficiency measures such as liquid cooling and on-site photovoltaics. The CRESS framework, launched in 2024, enables data center operators to sign virtual power purchase agreements, ensuring tariff certainty in the face of fossil fuel subsidy rollbacks. Low-interest green technology loans worth MYR 2 billion further reduce the weighted average cost of capital for sustainability retrofits. These incentives attract foreign direct investment while encouraging operators to move toward a 70% renewable grid target by 2050. Collectively, tax breaks and financing tools accelerate the adoption of battery-energy storage and high-efficiency chillers, thereby trimming operating costs over the facility's lifecycle.
Restraints Impact Analysis*
| Restraint | (~) % Impact on CAGR Forecast | Geographic Relevance | Impact Timeline |
|---|---|---|---|
| High electricity tariff volatility | -3.8% | National | Short term (≤ 2 years) |
| Lengthy Tier 3/Tier 4 approval cycles | -2.1% | Johor, Selangor | Medium term (2-4 years) |
| Scarcity of low-carbon power PPAs | -1.9% | East Malaysia focus | Long term (≥ 4 years) |
| Shortage of accredited Uptime-qualified engineers | -2.4% | National | Medium term (2-4 years) |
| Source: Mordor Intelligence | |||
High electricity tariff volatility
Tariff restructuring increased industrial rates by 14.2% in 2024, with ultra-high-voltage users, such as data centers, being hit hardest. Subsidy removal ties prices to natural-gas benchmarks, exposing operators to fluctuations in the commodity market. Renewable supply lags demand, keeping spot prices elevated. Operators hedge through on-site solar and battery-storage projects, but capital expenditure rises and project timelines lengthen. Contract ambiguity around future tariff escalations complicates hyperscaler total-cost-of-ownership models.
Shortage of accredited Uptime-qualified engineers
Malaysia needs thousands of technicians, yet local training pipelines remain thin. Johor’s rapid development intensifies competition for engineers, pushing salaries to MYR 3,500-4,000 per month. Operators import expatriates or outsource to facility management firms, thereby inflating operating expenses. Uptime Institute’s partnership with Custommedia Academy in 2025 expands certification programs; however, graduates typically require years of field experience. Staffing gaps threaten service-level-agreement compliance, delaying new-build commissioning.
*Our forecasts treat driver/restraint impacts as directional, not additive. The impact forecasts reflect baseline growth, mix effects, and variable interactions.
Segment Analysis
By Data Center Size: Medium Facilities Drive Expansion
Medium facilities are expected to open in 2026 with a 30.20% CAGR forecast, outpacing other tiers as enterprises and content providers seek edge-appropriate footprints that support regional 5G rollouts. Large facilities account for 24.18% of Malaysia's data center market share, driven by hyperscaler pre-lease commitments that secure power blocks of 20-50 MW. Small sites specialize in disaster-recovery niches, while mega and massive campuses cater to AI training needs.
The Malaysian data center market favors modular builds that add capacity in 4-6 MW increments, allowing operators to manage capital deployment effectively. Medium halls integrate economizer cooling, cutting power usage effectiveness to 1.3 and meeting green tax incentive thresholds. Large-site dominance persists near submarine cable stations, where land parcels can accommodate 100 MW substations. Power-grid constraints cap mega-campus growth, but upcoming 132 kV upgrades may unlock future supply.


By Tier Type: Tier 3 Dominance Reflects Reliability Balance
Tier 3 captured 75.88% of the revenue in 2025 and maintains the top growth rate at a 34.10% CAGR, confirming enterprises’ preference for concurrent maintainability without Tier 4 premiums. Tier 1-2 footprints shrink as SMEs migrate to cloud and colocation platforms.
Operators retrofit Tier 2 sites to Tier 3 by adding redundant distribution paths and diesel-rotary UPS systems, unlocking higher rack rates. Financial and e-commerce workloads demand 99.982% availability, aligning with Tier 3 specifications. Regulatory guidance from the Malaysian Communications and Multimedia Commission reinforces this mid-tier standard for the localization of critical data. Tier 4 remains a niche for core banking and defense workloads, but new-build economics deter widespread adoption.
By Data Center Type: Hyperscale Disrupts Colocation Dominance
Colocation still generates 95.42% of 2025 revenue, while hyperscale/self-built footprints expand at a 30.40% CAGR as cloud giants localize their capacity. Retail colocation serves SMEs needing managed services, while wholesale deals host global network providers.
The Malaysian data center market size for hyperscale halls grows fastest near Johor’s Iskandar corridor, exporting capacity back to Singapore over dark fiber links. Colocation operators are pivoting to hybrid connectivity models, offering on-ramps to AWS, Azure, and Google Cloud. Edge and enterprise data centers fill latency-sensitive gaps in manufacturing parks and smart-city deployments. Competition intensifies on cross-connect pricing and sustainability credentials.

By End User: BFSI Drives Digital Transformation
IT and telecoms retained a 51.12% share in 2025 due to network backbone and content delivery needs. BFSI grows fastest at 29.40% CAGR on the back of open-banking, real-time payments, and RegTech analytics.
Digital banks under Bank Negara Malaysia’s framework demand low-latency zones, driving the expansion of the Malaysian data center market in Kuala Lumpur. Telecom operators deploy 5G core nodes inside facilities to cut backbone congestion. E-commerce platforms rely on data analytics clusters, driving the uptake of wholesale colocation. Government workloads shift from legacy on-premises systems to resilient Tier 3 sites as cybersecurity mandates become more stringent.
Geography Analysis
Johor Bahru controls 53.20% of Malaysia's data center market share, thanks to Singapore's overflow and the MYR 3.24 billion Rapid Transit System link, which enhances cross-border workforce mobility. Operating capacity stands at 401 MW, with a 1,046 MW pipeline; however, water-supply and grid limits necessitate stricter project vetting. Johor’s proximity to multiple cable landings maintains latency parity with Singapore, attracting hyperscalers seeking land at half the price of the city-state.
Cyberjaya posts the fastest 29.60% CAGR, leveraging Multimedia Super Corridor fiber and federal tech-hub status. Telekom Malaysia’s Klang Valley Data Centre upgrade and TM Global’s Iskandar Puteri expansion illustrate sustained telco investment. Renewable-energy pilots under the National Energy Transition Roadmap position Cyberjaya as a showcase for green data centers, yet power import caps challenge mega-site proposals.
Kuala Lumpur remains the administrative and financial node, hosting government clouds and banking core systems that require proximity to regulators. Land scarcity and premium rentals are shifting new builds to city fringes, such as Bukit Jalil. Penang’s semiconductor corridor and Batu Kawan Park stimulate edge-site demand; medium data halls align with factory digital twins and supply-chain analytics.
Competitive Landscape
Malaysia's data center market is home to global heavyweights such as AirTrunk, Bridge Data Centers, NTT, and local players YTL and Telekom Malaysia. High barriers to entry emerge with a USD 88 million average land acquisition outlay for greenfield builds. Blackstone’s AUD 24 billion buy-out of AirTrunk signals private-equity appetite for scale.[4]Financial Times, “Blackstone Buys AirTrunk in AUD 24 Billion Deal,” ft.com YTL’s NVIDIA pact advances AI-ready infrastructure, differentiating via liquid-cooling expertise.
Colocation incumbents pursue hybrid-cloud interconnect platforms; Bridge Data Centers links Johor campuses to Singapore via metro-fiber rings, winning latency-sensitive content-delivery contracts. Telekom Malaysia leverages its ownership of submarine cables to bundle connectivity with data hall space, enhancing stickiness among international carriers. Smaller firms are scouting secondary markets, such as East Malaysia, where resource extraction projects require edge computing.
Mergers and build-to-suit joint ventures loom as construction costs escalate and talent shortages persist. Certification arms race intensifies around Uptime Tier and ISO 27001 badges, influencing BFSI and government procurement criteria. Sustainability disclosure, including the renewable energy mix and water usage effectiveness, emerges as a competitive pivot under investor scrutiny.
Malaysia Data Center Industry Leaders
Bridge Data Centers (Chindata Group)
MN Holdings Bhd
DayOne (GDS Holdings Ltd.)
K2 Strategic (Kuok Group)
AirTrunk Operating Pty Ltd.
- *Disclaimer: Major Players sorted in no particular order


Recent Industry Developments
- September 2025: Malaysia approved 42 new data center projects in Johor during Q2 2025, with a total committed investment exceeding RM 15 billion (USD 3.37 billion), demonstrating an accelerated government approval process despite previous bottlenecks.
- August 2025: The Malaysian Investment Development Authority (MIDA) announced that RM 141.72 billion (USD 31.9 billion) in digital investments were approved in the first 10 months of 2024, representing a 3x growth compared to the full-year 2023 approvals of RM 46.2 billion (USD 10.4 billion). These investments are expected to create 41,078 jobs.
- July 2025: Prime Minister Anwar Ibrahim announced in the Budget 2025 speech that the government will restructure data center incentive packages to ensure broader economic benefits, with new incentive structures to be announced mid-2025 by the Treasury.
- June 2025: Tenaga Nasional Bhd reported signing 31 electricity supply agreements (ESAs) with data center operators for a total energy demand of 4,700 MW, representing a significant allocation of grid capacity for the sector.
- May 2025: Google unit awarded a major data center construction contract to Malaysia's Gamuda, following a USD 2 billion investment commitment, with construction expected to begin in Q4 2025.


Malaysia Data Center Market Report Scope
Cyberjaya-Kuala Lumpur, Johor Bahru are covered as segments by Hotspot. Large, Massive, Medium, Mega, Small are covered as segments by Data Center Size. Tier 1 and 2, Tier 3, Tier 4 are covered as segments by Tier Type. Non-Utilized, Utilized are covered as segments by Absorption.| Large |
| Massive |
| Medium |
| Mega |
| Small |
| Tier 1 and 2 |
| Tier 3 |
| Tier 4 |
| Hyperscale/Self-built | ||
| Enterprise/Edge | ||
| Colocation | Non-Utilized | |
| Utilized | Retail Colocation | |
| Wholesale Colocation | ||
| BFSI |
| IT and ITES |
| E-Commerce |
| Government |
| Manufacturing |
| Media and Entertainment |
| Telecom |
| Other End Users |
| Kuala Lumpur |
| Cyberjaya |
| Johor Bahru |
| Rest of Malaysia |
| By Data Center Size | Large | ||
| Massive | |||
| Medium | |||
| Mega | |||
| Small | |||
| By Tier Type | Tier 1 and 2 | ||
| Tier 3 | |||
| Tier 4 | |||
| By Data Center Type | Hyperscale/Self-built | ||
| Enterprise/Edge | |||
| Colocation | Non-Utilized | ||
| Utilized | Retail Colocation | ||
| Wholesale Colocation | |||
| By End User | BFSI | ||
| IT and ITES | |||
| E-Commerce | |||
| Government | |||
| Manufacturing | |||
| Media and Entertainment | |||
| Telecom | |||
| Other End Users | |||
| By Hotspot | Kuala Lumpur | ||
| Cyberjaya | |||
| Johor Bahru | |||
| Rest of Malaysia | |||


Market Definition
- IT LOAD CAPACITY - The IT load capacity or installed capacity, refers to the amount of energy consumed by servers and network equipments placed in a rack installed. It is measured in megawatt (MW).
- ABSORPTION RATE - It denotes the extend to which the data center capacity has been leased out. For instance, a 100 MW DC has leased out 75 MW, then absorption rate would be 75%. It is also referred as utilization rate and leased-out capacity.
- RAISED FLOOR SPACE - It is an elevated space build over the floor. This gap between the original floor and the elevated floor is used to accommodate wiring, cooling, and other data center equipment. This arrangement assist in having proper wiring and cooling infrastructure. It is measured in square feet (ft^2).
- DATA CENTER SIZE - Data Center Size is segmented based on the raised floor space allocated to the data center facilities. Mega DC - # of Racks must be more than 9000 or RFS (raised floor space) must be more than 225001 Sq. ft; Massive DC - # of Racks must be in between 9000 and 3001 or RFS must be in between 225000 Sq. ft and 75001 Sq. ft; Large DC - # of Racks must be in between 3000 and 801 or RFS must be in between 75000 Sq. ft and 20001 Sq. ft; Medium DC # of Racks must be in between 800 and 201 or RFS must be in between 20000 Sq. ft and 5001 Sq. ft; Small DC - # of Racks must be less than 200 or RFS must be less than 5000 Sq. ft.
- TIER TYPE - According to Uptime Institute the data centers are classified into four tiers based on the proficiencies of redundant equipment of the data center infrastructure. In this segment the data center are segmented as Tier 1,Tier 2, Tier 3 and Tier 4.
- COLOCATION TYPE - The segment is segregated into 3 categories namely Retail, Wholesale and Hyperscale Colocation service. The categorization is done based on the amount of IT load leased out to potential customers. Retail colocation service has leased capacity less than 250 kW; Wholesale colocation services has leased capacity between 251 kW and 4 MW and Hyperscale colocation services has leased capacity more than 4 MW.
- END CONSUMERS - The Data Center Market operates on a B2B basis. BFSI, Government, Cloud Operators, Media and Entertainment, E-Commerce, Telecom and Manufacturing are the major end-consumers in the market studied. The scope only includes colocation service operators catering to the increasing digitalization of the end-user industries.
| Keyword | Definition |
|---|---|
| Rack Unit | Generally referred as U or RU, it is the unit of measurement for the server unit housed in the racks in the data center. 1U is equal to 1.75 inches. |
| Rack Density | It defines the amount of power consumed by the equipment and server housed in a rack. It is measured in kilowatt (kW). This factor plays a critical role in data center design and, cooling and power planning. |
| IT Load Capacity | The IT load capacity or installed capacity, refers to the amount of energy consumed by servers and network equipment placed in a rack installed. It is measured in megawatt (MW). |
| Absorption Rate | It denotes how much of the data center capacity has been leased out. For instance, if a 100 MW DC has leased out 75 MW, then the absorption rate would be 75%. It is also referred to as utilization rate and leased-out capacity. |
| Raised Floor Space | It is an elevated space built over the floor. This gap between the original floor and the elevated floor is used to accommodate wiring, cooling, and other data center equipment. This arrangement assists in having proper wiring and cooling infrastructure. It is measured in square feet/meter. |
| Computer Room Air Conditioner (CRAC) | It is a device used to monitor and maintain the temperature, air circulation, and humidity inside the server room in the data center. |
| Aisle | It is the open space between the rows of racks. This open space is critical for maintaining the optimal temperature (20-25 °C) in the server room. There are primarily two aisles inside the server room, a hot aisle and a cold aisle. |
| Cold Aisle | It is the aisle wherein the front of the rack faces the aisle. Here, chilled air is directed into the aisle so that it can enter the front of the racks and maintain the temperature. |
| Hot Aisle | It is the aisle where the back of the racks faces the aisle. Here, the heat dissipated from the equipment’s in the rack is directed to the outlet vent of the CRAC. |
| Critical Load | It includes the servers and other computer equipment whose uptime is critical for data center operation. |
| Power Usage Effectiveness (PUE) | It is a metric which defines the efficiency of a data center. It is calculated by: (𝑇𝑜𝑡𝑎𝑙 𝐷𝑎𝑡𝑎 𝐶𝑒𝑛𝑡𝑒𝑟 𝐸𝑛𝑒𝑟𝑔𝑦 𝐶𝑜𝑛𝑠𝑢𝑚𝑝𝑡𝑖𝑜𝑛)/(𝑇𝑜𝑡𝑎𝑙 𝐼𝑇 𝐸𝑞𝑢𝑖𝑝𝑚𝑒𝑛𝑡 𝐸𝑛𝑒𝑟𝑔𝑦 𝐶𝑜𝑛𝑠𝑢𝑚𝑝𝑡𝑖𝑜𝑛). Further, a data center with a PUE of 1.2-1.5 is considered highly efficient, whereas, a data center with a PUE >2 is considered highly inefficient. |
| Redundancy | It is defined as a system design wherein additional component (UPS, generators, CRAC) is added so that in case of power outage, equipment failure, the IT equipment should not be affected. |
| Uninterruptible Power Supply (UPS) | It is a device that is connected in series with the utility power supply, storing energy in batteries such that the supply from UPS is continuous to IT equipment even during utility power is snapped. The UPS primarily supports the IT equipment only. |
| Generators | Just like UPS, generators are placed in the data center to ensure an uninterrupted power supply, avoiding downtime. Data center facilities have diesel generators and commonly, 48-hour diesel is stored in the facility to prevent disruption. |
| N | It denotes the tools and equipment required for a data center to function at full load. Only "N" indicates that there is no backup to the equipment in the event of any failure. |
| N+1 | Referred to as 'Need plus one', it denotes the additional equipment setup available to avoid downtime in case of failure. A data center is considered N+1 when there is one additional unit for every 4 components. For instance, if a data center has 4 UPS systems, then for to achieve N+1, an additional UPS system would be required. |
| 2N | It refers to fully redundant design wherein two independent power distribution system is deployed. Therefore, in the event of a complete failure of one distribution system, the other system will still supply power to the data center. |
| In-Row Cooling | It is the cooling design system installed between racks in a row where it draws warm air from the hot aisle and supplies cool air to the cold aisle, thereby maintaining the temperature. |
| Tier 1 | Tier classification determines the preparedness of a data center facility to sustain data center operation. A data center is classified as Tier 1 data center when it has a non-redundant (N) power component (UPS, generators), cooling components, and power distribution system (from utility power grids). The Tier 1 data center has an uptime of 99.67% and an annual downtime of <28.8 hours. |
| Tier 2 | A data center is classified as Tier 2 data center when it has a redundant power and cooling components (N+1) and a single non-redundant distribution system. Redundant components include extra generators, UPS, chillers, heat rejection equipment, and fuel tanks. The Tier 2 data center has an uptime of 99.74% and an annual downtime of <22 hours. |
| Tier 3 | A data center having redundant power and cooling components and multiple power distribution systems is referred to as a Tier 3 data center. The facility is resistant to planned (facility maintenance) and unplanned (power outage, cooling failure) disruption. The Tier 3 data center has an uptime of 99.98% and an annual downtime of <1.6 hours. |
| Tier 4 | It is the most tolerant type of data center. A Tier 4 data center has multiple, independent redundant power and cooling components and multiple power distribution paths. All IT equipment are dual powered, making them fault tolerant in case of any disruption, thereby ensuring interrupted operation. The Tier 4 data center has an uptime of 99.74% and an annual downtime of <26.3 minutes. |
| Small Data Center | Data center that has floor space area of ≤ 5,000 Sq. ft or the number of racks that can be installed is ≤ 200 is classified as a small data center. |
| Medium Data Center | Data center which has floor space area between 5,001-20,000 Sq. ft, or the number of racks that can be installed is between 201-800, is classified as a medium data center. |
| Large Data Center | Data center which has floor space area between 20,001-75,000 Sq. ft, or the number of racks that can be installed is between 801-3,000, is classified as a large data center. |
| Massive Data Center | Data center which has floor space area between 75,001-225,000 Sq. ft, or the number of racks that can be installed is between 3001-9,000, is classified as a massive data center. |
| Mega Data Center | Data center that has a floor space area of ≥ 225,001 Sq. ft or the number of racks that can be installed is ≥ 9001 is classified as a mega data center. |
| Retail Colocation | It refers to those customers who have a capacity requirement of 250 kW or less. These services are majorly opted by small and medium enterprises (SMEs). |
| Wholesale Colocation | It refers to those customers who have a capacity requirement between 250 kW to 4 MW. These services are majorly opted by medium to large enterprises. |
| Hyperscale Colocation | It refers to those customers who have a capacity requirement greater than 4 MW. The hyperscale demand primarily originates from large-scale cloud players, IT companies, BFSI, and OTT players (like Netflix, Hulu, and HBO+). |
| Mobile Data Speed | It is the mobile internet speed a user experiences via their smartphones. This speed is primarily dependent on the carrier technology being used in the smartphone. The carrier technologies available in the market are 2G, 3G, 4G, and 5G, where 2G provides the slowest speed while 5G is the fastest. |
| Fiber Connectivity Network | It is a network of optical fiber cables deployed across the country, connecting rural and urban regions with high-speed internet connection. It is measured in kilometer (km). |
| Data Traffic per Smartphone | It is a measure of average data consumption by a smartphone user in a month. It is measured in gigabyte (GB). |
| Broadband Data Speed | It is the internet speed that is supplied over the fixed cable connection. Commonly, copper cable and optic fiber cable are used in both residential and commercial use. Here, optic cable fiber provides faster internet speed than copper cable. |
| Submarine Cable | A submarine cable is a fiber optic cable laid down at two or more landing points. Through this cable, communication and internet connectivity between countries across the globe is established. These cables can transmit 100-200 terabits per second (Tbps) from one point to another. |
| Carbon Footprint | It is the measure of carbon dioxide generated during the regular operation of a data center. Since, coal, and oil & gas are the primary source of power generation, consumption of this power contributes to carbon emissions. Data center operators are incorporating renewable energy sources to curb the carbon footprint emerging in their facilities. |


Research Methodology
Mordor Intelligence follows a four-step methodology in all our reports.
- Step-1: Identify Key Variables: In order to build a robust forecasting methodology, the variables and factors identified in Step-1 are tested against available historical market numbers. Through an iterative process, the variables required for market forecast are set and the model is built on the basis of these variables.
- Step-2: Build a Market Model: Market-size estimations for the forecast years are in nominal terms. Inflation is not a part of the pricing, and the average selling price (ASP) is kept constant throughout the forecast period for each country.
- Step-3: Validate and Finalize: In this important step, all market numbers, variables and analyst calls are validated through an extensive network of primary research experts from the market studied. The respondents are selected across levels and functions to generate a holistic picture of the market studied.
- Step-4: Research Outputs: Syndicated Reports, Custom Consulting Assignments, Databases & Subscription Platforms


