
Malaysia Data Center Construction Market Size and Share
Market Overview
| Study Period | 2020 - 2031 |
|---|---|
| Forecast Data Period | 2026 - 2031 |
| Historical Data Period | 2020 - 2024 |
| Market Size (2026) | USD 3.71 Billion |
| Market Size (2031) | USD 7.74 Billion |
| Growth Rate (2026 - 2031) | 15.88 % |
| Market Concentration | Medium |
Major Players *Disclaimer: Major Players sorted in no particular order Image © Mordor Intelligence. Reuse requires attribution under CC BY 4.0. | |

Malaysia Data Center Construction Market Analysis by Mordor Intelligence
The Malaysia data center construction market size reached USD 3.71 billion in 2026 and is projected to reach USD 7.74 billion by 2031, reflecting a robust 15.88% CAGR across the forecast horizon. Growth is fueled by hyperscale spill-over from Singapore, a generous 10-year tax holiday for qualifying builds, and a multi-terabit boost in global connectivity from the 2024 MIST, Apricot, and Bifrost cable landings. Operators moving quickly to secure Johor and Cyberjaya parcels enjoy land costs up to 60% below Singapore, while new renewable-energy provisions under the Corporate Renewable Energy Supply Scheme compress operating costs and improve ESG credentials. Competitive intensity has risen as at least 12 global and regional providers announced greenfield or expansion projects worth more than USD 15 billion since 2024, positioning Malaysia to transition from a secondary to a primary cloud availability zone within Southeast Asia.
Key Report Takeaways
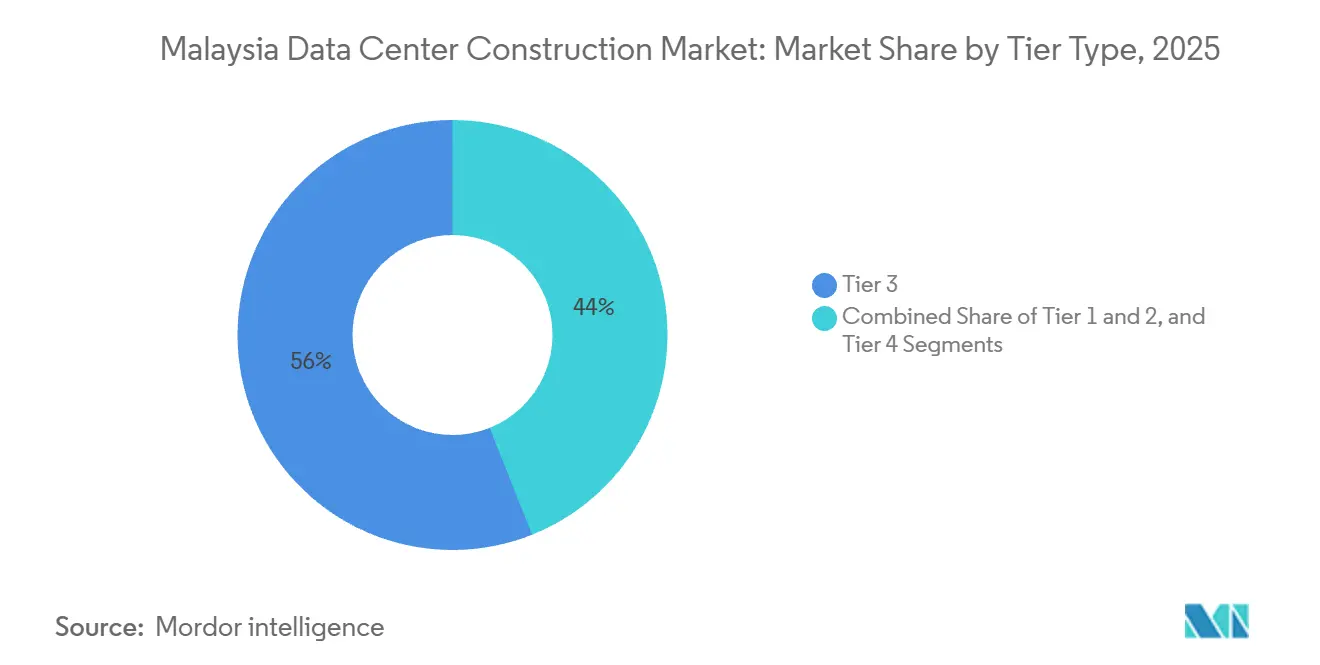
- By tier type, Tier 3 facilities commanded 56.04% of the Malaysia data center construction market share in 2025, whereas Tier 4 builds are forecast to advance at a 16.87% CAGR through 2031.
- By data center size, large facilities led with 55.46% of the Malaysia data center construction market share in 2025 and hyperscale campuses are set to expand at a 16.34% CAGR to 2031.
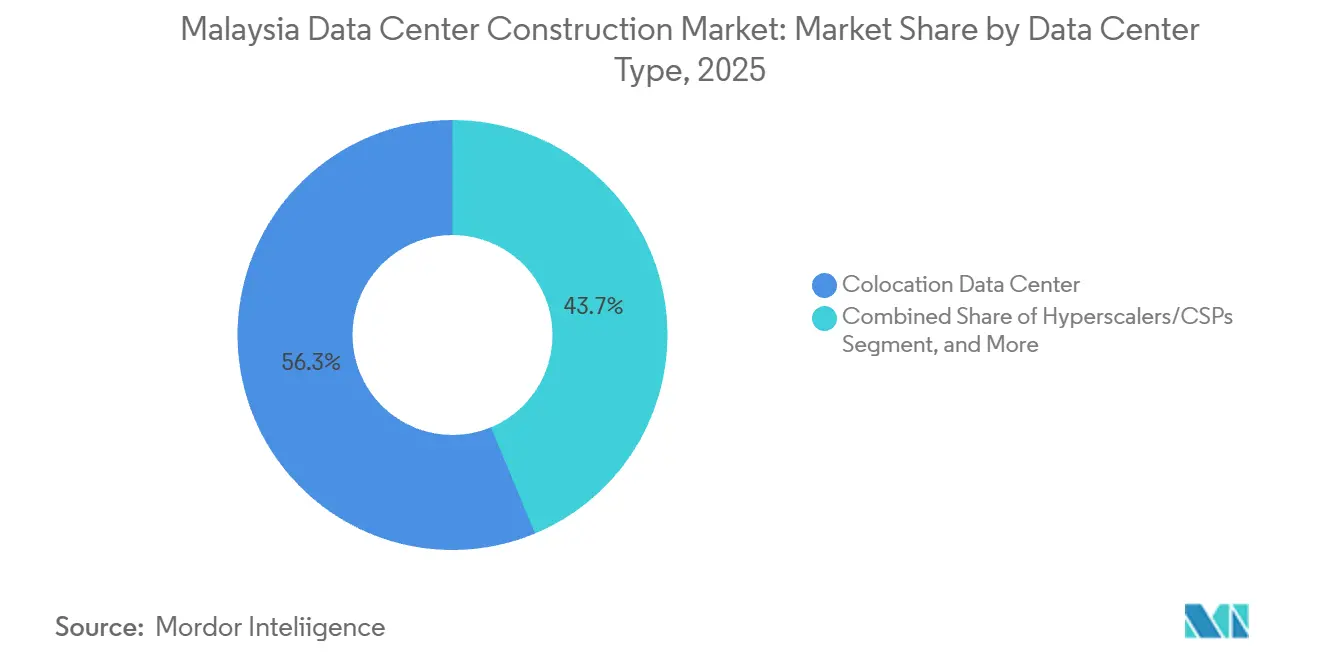
- By data center type, colocation captured 56.28% of the Malaysia data center construction market share in 2025, while hyperscalers and cloud service providers are projected to grow at a 16.58% CAGR over the same period.
- By infrastructure category, electrical systems held 40.22% of 2025 spend and mechanical systems are poised to post the fastest 16.79% CAGR through 2031.
Note: Market size and forecast figures in this report are generated using Mordor Intelligence’s proprietary estimation framework, updated with the latest available data and insights as of January 2026.
Malaysia Data Center Construction Market Trends and Insights
Drivers Impact Analysis*
| Driver | (~) % Impact on CAGR Forecast | Geographic Relevance | Impact Timeline |
|---|---|---|---|
| Spill-Over Demand From Singapore Moratorium | +3.2% | Johor, secondary gains in Cyberjaya and Penang | Medium term (2-4 years) |
| Hyperscale Cloud and AI Build-Outs | +4.1% | National, concentrated in Johor and Selangor | Long term (≥ 4 years) |
| Malaysia Digital Tax and Incentive Schemes | +2.8% | National, early uptake in Iskandar Malaysia | Short term (≤ 2 years) |
| Affordable Land and Power in Johor and Cyberjaya | +2.3% | Johor and Cyberjaya | Medium term (2-4 years) |
| Corporate Renewable Energy Supply Scheme | +1.6% | National, pilots in Johor and Selangor | Long term (≥ 4 years) |
| Sub-Sea Cable Landings Elevating Connectivity | +2.4% | Melaka, Kuantan, and Penang landing stations | Medium term (2-4 years) |
| Source: Mordor Intelligence | |||
Spill-Over Demand From Singapore Moratorium
Singapore’s 2019 freeze on new permits pushed 200–300 megawatts of unmet hyperscale demand across the causeway, enabling operators in Johor to deliver sub-2-millisecond latency to Singapore at land prices 40–60% lower than across the Strait. Vantage Data Centers’ USD 1.6 billion acquisition of a 300-megawatt campus in November 2025 and Bridge Data Centres’ 400-megawatt grid agreement the previous year illustrate pre-positioning for continued overflow.[1]Vantage Data Centers, “Vantage Data Centers Breaks Ground on KUL2 Campus in Cyberjaya,” vantage-dc.com Malaysia’s Investment Development Authority recorded RM 20 billion in data-center FDI during 2024, a five-fold jump from 2022, confirming the structural re-allocation of regional capacity.
Hyperscale Cloud and AI Build-Outs
Microsoft committed USD 2.2 billion in May 2024 for multi-site campuses and workforce programs, while Google earmarked USD 2 billion for its first Malaysian cloud region in the same month. ByteDance followed with a RM 10 billion (USD 2.1 billion) AI hub anchored by Bridge Data Centres’ MY06 site, signifying Malaysia’s elevation to a primary availability zone. YTL Power’s 500-megawatt Green DC Park integrates Nvidia GB200 NVL72 racks and on-site solar to achieve a 1.3 PUE, setting a regional benchmark for AI-optimized sustainability.
Malaysia Digital Tax and Incentive Schemes
The 2024 MD Tax Incentive grants a decade of income-tax exemption plus duty waivers on servers, cooling, and power gear for qualifying investments, cutting payback cycles by nearly two years. Operators meeting RM 100 million Tier 3 or RM 300 million Tier 4 thresholds also benefit from single-window approvals via the Digital Investment Office, which reduced average permitting from 14 to 8 months in designated digital zones.
Sub-Sea Cable Landings Elevating Connectivity
The 2024 activation of the MIST, Apricot, and Bifrost systems delivered 18-190 Tbps of new capacity and trimmed latency to Chennai, Tokyo, and Jakarta. NTT’s Johor campus will add a carrier-neutral landing station, cementing Malaysia’s role as a trans-regional exchange point.[2]NTT Global Data Centers, “NTT Acquires 68.5 Acres in Johor for 290 MW Data Center Campus,” global.ntt Lower latency broadens the addressable base for latency-sensitive fintech, gaming, and media workloads, further enlarging the Malaysia data center construction market.
Restraints Impact Analysis*
| Restraint | (~) % Impact on CAGR Forecast | Geographic Relevance | Impact Timeline |
|---|---|---|---|
| Grid Capacity and Peak Tariff Escalation | -2.9% | Johor industrial zones, Cyberjaya | Short term (≤ 2 years) |
| Shortage of Certified Data-Center Technicians | -1.8% | National, acute in Johor and Selangor | Medium term (2-4 years) |
| Fragmented Multi-Tier Land-Use Approvals | -1.2% | National, slower outside special economic zones | Short term (≤ 2 years) |
| Rising Water-Stress Risk in Johor Cooling Corridor | -0.9% | Johor, especially Iskandar Malaysia | Medium term (2-4 years) |
| Source: Mordor Intelligence | |||
Grid Capacity and Peak Tariff Escalation
Tenaga Nasional Berhad lifted commercial tariffs 14% in July 2025 to finance substation upgrades, raising a 10-megawatt facility’s annual electricity bill by roughly USD 200,000. Operators hedge exposure through 20-year solar PPAs under C-RESS; Vantage’s 30-megawatt virtual PPA with ib vogt exemplifies this shift.
Shortage of Certified Data-Center Technicians
Malaysia had fewer than 1,500 Tier 3 and Tier 4-certified technicians in 2024, even though announced capacity will need about 3,000 by 2027. The resulting scarcity lengthened commissioning cycles by 8-12 weeks and pushed contractor labor costs up 20-30% in Johor and Cyberjaya. AIMS Data Centre added 200 staff in 2025 and created an in-house Uptime-aligned certification program to bridge the skills gap. Meanwhile, MBOT and MDEC launched a national curriculum in 2024 aimed at graduating 1,000 data-center technicians annually starting in late 2026.[3]“MBOT and MDEC Launch National Curriculum to Train 1,000 Data-Center Technicians a Year,” Malaysia Digital Economy Corporation, mdec.my Providers now offer wage premiums approaching 40% over regional norms to secure qualified personnel, further eroding margins for smaller operators.
*Our forecasts treat driver/restraint impacts as directional, not additive. The impact forecasts reflect baseline growth, mix effects, and variable interactions.
Segment Analysis
By Tier Type: Tier 4 Builds Track AI Uptime Needs
Tier 3 installations controlled 56.04% of 2025 revenue, yet Tier 4 capacity is forecast to post a 16.87% CAGR, outpacing all other classes. The Malaysia data center construction market size for Tier 4 projects is therefore projected to rise sharply as hyperscalers deploy concurrent-maintainable power and cooling chains. Equinix will add 2,225 cabinets with 2N electrical feeds at its JH2 campus in 2027.
Tier 1 and Tier 2 sites remain relevant for edge and disaster-recovery workloads, but the share of AI training and inference rose from under 10% to nearly 25% of new bookings between 2023 and 2025. NTT’s Johor campus plans dual utility feeds and 72-hour fuel autonomy to meet business-continuity mandates. The pivot reflects end-user intolerance for even brief thermal or power excursions, pushing the Malaysia data center construction market toward higher-spec builds.



By Data Center Size: Hyperscale Campuses Dominate Pipeline
Large facilities held 55.46% share in 2025; nevertheless, hyperscale campuses, defined as single-site builds exceeding 100 megawatts, are poised to expand at a 16.34% CAGR. The Malaysia data center construction market share for hyperscale sites is thus set to grow as Vantage’s 256-megawatt KUL2 and Bridge Data Centres’ 400-megawatt electricity deal come online.
Campus models improve land acquisition, utility negotiation, and phased delivery. Vantage’s 300-megawatt JHB1 enables multi-year tenant ramp-ups, while Bridge’s MY07 reserves acreage for 200 additional megawatts. Medium and small facilities continue to support managed service providers and edge caching, but they capture a shrinking slice of the Malaysia data center construction market.
By Data Center Type: Hyperscalers Accelerate Dedicated Builds
Colocation accounted for 56.28% of 2025 revenue, serving enterprises needing carrier-neutral space. Still, hyperscaler and cloud provider builds are projected to grow at a 16.58% CAGR as Microsoft, Google, and ByteDance move from leasing to owning facilities. The Malaysia data center construction market size for hyperscaler campuses could surpass USD 4 billion by 2031, reflecting committed pipelines.
Microsoft’s multi-site design offers sub-5-millisecond latency to Kuala Lumpur, while Google’s Elmina campus integrates custom TPUs. Enterprise hybrid architectures persist, yet the center of gravity is shifting toward purpose-built hyperscale complexes optimized for dense AI workloads.
By Infrastructure Category: Liquid Cooling Drives Mechanical Spend
Electrical systems commanded 40.22% of 2025 construction outlays, but mechanical systems will register the fastest growth at a 16.79% CAGR as direct-to-chip cooling becomes widespread. The Malaysia data center construction market size for mechanical equipment is therefore expected to roughly double by 2031. YTL Power’s Green DC Park is 80% liquid-cooled, reducing cooling energy 40%.
HPE’s fanless liquid solution entered multiple Malaysian sites during 2024-2025. Electrical upgrades continue, with lithium-ion BESS replacing diesel backup and meeting corporate carbon targets. General construction and professional services round out spend, but neither matches the growth pace of next-generation cooling.
Geography Analysis
Johor captured close to 60% of announced capacity in 2024-2025, benefitting from proximity to Singapore, large industrial parcels, and a 2024 task force that cut approval times from 14 to 8 months. Selangor, anchored by Cyberjaya’s mature carrier-hotel ecosystem, drew about 30% of commitments as operators pursue customers in Kuala Lumpur’s financial and media hubs. The Malaysia data center construction market size in Johor is therefore forecast to remain dominant through 2031, but Selangor retains strategic importance for latency-sensitive enterprise workloads.
Cyberjaya’s dual fiber routes to Singapore and 25-year operating history make it the default choice for financial trading, real-time analytics, and interconnection. Equinix bought 10 acres for future expansion in July 2024, while Vantage broke ground on the 256-megawatt KUL2 campus the next month. AIMS added 12 megawatts via Block 3 in July 2025, pushing its township footprint past 100 megawatts.
Secondary hubs are emerging. Penang offers diverse cable landings and a 10-year property-tax holiday on builds exceeding RM 200 million, while Melaka hosts the MIST landing station. Neither state has yet attracted hyperscale projects, but both could capture workloads requiring geographic redundancy once Johor’s and Selangor’s grids near saturation. Overall, geography decisions in the Malaysia data center construction market balance latency, land cost, grid capacity, and permitting speed.
Regulatory Landscape
Malaysia has tightened oversight of new data center builds by linking approvals to resource availability and sustainability performance. In 2025, the government moved to establish a comprehensive data center framework to streamline policies under the Ministry of Investment, Trade and Industry (MITI), with the Malaysian Investment Development Authority (MIDA) involved in coordination and investment facilitation. MITI also issued Sustainable Data Centre Guidelines that require operators to disclose key efficiency metrics such as Power Usage Effectiveness (PUE) and Water Usage Effectiveness (WUE), which is pushing projects toward more transparent energy and water management.
Project clearances increasingly run through a centralized, resource-gated process. The Data Centre Task Force (DCTF) evaluates new applications based on confirmed energy and water supply availability, and approvals can be conditional when regulators prioritize residential and local industrial needs for power and water before allocating capacity to data centers. For incentives, the Digital Ecosystem Acceleration (DESAC) scheme provides tax support for qualifying projects that meet sustainability criteria, with availability referenced through December 31, 2027, which affects design choices around renewable procurement, cooling strategies, and efficiency reporting.
Competitive Landscape
The competitive field is moderately fragmented, with Equinix, Vantage Data Centers, NTT Global Data Centers, and others. Each leverages differentiated strategies. Equinix focuses on carrier-neutral interconnection, Vantage scales multi-hundred-megawatt campuses, and NTT integrates global network assets. Bridge’s land-banking in Johor and AIMS’s long-tenured enterprise base further shape the competitive landscape.
Sustainability has become table stakes. YTL Power’s 500-megawatt solar-integrated campus and Vantage’s virtual solar PPA demonstrate the premium placed on low-carbon power. Liquid cooling is the next battleground; AirTrunk’s JHB1 opened with 20 megawatts of direct-to-chip capacity, and AIMS offers optional liquid loops in Cyberjaya. These features attract AI customers that regularly exceed 50 kilowatts per rack.
Edge opportunities in secondary cities remain largely untapped. Telekom Malaysia and Exabytes run sub-5-megawatt installations in Penang, Ipoh, and Kuching, but no hyperscale player has committed outside Johor or Selangor. Market consolidation is likely as smaller firms struggle with the capital intensity of Tier 4 builds and rising wage costs. Providers that pre-lock power capacity and renewable PPAs under C-RESS are best positioned to capture the next wave of Malaysia data center construction market growth.
Malaysia Data Center Construction Industry Leaders
Gamuda Bhd
YTL Power International Bhd
Equinix Inc.
Vantage Data Centers LLC
Bridge Data Centres Malaysia Sdn Bhd
- *Disclaimer: Major Players sorted in no particular order


Market Opportunities and Future Outlook
A major near-term opportunity is aligning project design and construction packages with the government push toward higher-value digital infrastructure, including AI-oriented capacity. The pipeline is shifting toward larger, AI-ready builds with higher-spec requirements such as higher rack densities, liquid cooling, and more robust electrical redundancy. At the same time, projects are factoring in MITI sustainability reporting, including PUE and WUE.
Recent project announcements reinforce this direction. MRCB working with Perintis Akal on a 65 MW AI-ready facility in Bukit Jalil, Kuala Lumpur, and Equinix announcing a new purpose-built IBX facility in Kuala Lumpur are both tied to demand for Tier 3 and Tier 4 construction scope, commissioning services, and advanced mechanical systems. There is also whitespace in Malaysia-localized supply and delivery capability for data center components and lifecycle services as build-out extends beyond pure civil works. Programs such as DESAC and the national sustainability guidelines reward projects that can demonstrate efficient water and energy use, which increases the addressable demand for specialized contractors and suppliers across liquid cooling, high-efficiency power trains, monitoring and controls, and water management solutions. Johor and the Klang Valley continue to draw hyperscale and colocation activity, while the emphasis on verified power and water availability raises the value of early-stage work in utility coordination, energy contracting (including renewable arrangements), and site selection that reduces permitting and grid-connection risk.
Recent Industry Developments
- June 2026: Malaysian Resources Corp Bhd (MRCB) and Perintis Akal Sdn Bhd announced plans for an AI-ready data center development in Bukit Jalil, Kuala Lumpur, with a gross development cost of RM 2.1 billion and 65 MW IT load. The announcement points to deeper participation by domestic developers in large-scale digital infrastructure delivery and adds new construction demand in the Klang Valley beyond the established Cyberjaya cluster.
- May 2026: Equinix announced the development of a new purpose-built IBX data center in Kuala Lumpur (KL2), targeting delivery of more than 2,200 cabinets and backed by an investment of over USD 190 million. The project expands carrier-neutral capacity and raises the bar for specification and compliance, supporting more complex electrical and mechanical construction scopes geared to AI and cloud workloads.
- April 2026: AirTrunk announced an investment of MYR 12 billion (USD 3 billion) to develop two new hyperscale campuses, JHB3 and JHB4, in Johor Bahru, adding 280 MW of IT load. The decision reinforces Johor's role as the primary hyperscale construction corridor tied to Singapore connectivity and increases demand for large-campus civil works, power delivery infrastructure, and high-capacity cooling systems.


Research Methodology Framework and Report Scope
Market Definition and Coverage
For this study, the market covers the value of construction work delivered to build or expand data centers in Malaysia, including the main civil structure and the key mechanical, electrical, and plumbing systems required to make the site operational.
Scope exclusions: Pure IT hardware purchases, software, and ongoing colocation or cloud service revenues are excluded from this construction market.
Segmentation Overview
- By Tier Type
- Tier 1 and 2
- Tier 3
- Tier 4
- By Data Center Size
- Small
- Medium
- Large
- Hyperscale
- By Data Center Type
- Colocation Data Center
- Hyperscalers/Cloud Service Provider (CSPs)
- Enterprise and Edge Data Center
- By Infrastructure
- Electrical Infrastructure
- Power Distribution Solution
- Power Backup Solutions
- Mechanical Infrastructure
- Cooling Systems
- Racks and Cabinets
- Servers and Storage
- Other Mechanical Infrastructure
- General Construction
- Services - Design and Consulting, Integration, Support and Maintenance
- Electrical Infrastructure
Data Sources, Market Sizing, and Validation
Desk Research
We start with public references that help set the demand context and confirm what is being built, where it is being built, and what it should cost at a reasonable level. Common inputs include official investment and industrial announcements from agencies such as MIDA, power and grid updates from Tenaga Nasional Berhad disclosures, and planning signals from local authorities and state development bodies.
To shape assumptions on capacity and delivery pace, we also use non-paywalled infrastructure and connectivity signals such as public submarine cable landing updates, national digital policy releases, and open publications from standards bodies and engineering journals. On the pricing and activity side, we review company filings, investor presentations, press releases, and reputable business news, then support the dataset with paid subscriptions for company financials and intelligence, import and export shipment level checks for selected equipment, and patent databases where relevant. The sources listed here are illustrative, and other references were used to collect data, cross-check inconsistencies, and clarify assumptions.
Primary Interviews and Surveys
Our estimates were pressure-tested through interviews and structured surveys with contractors, engineering and commissioning specialists, developers, and procurement and facility leads who influence project schedules and bill-of-quantities behavior. Coverage focused on the main development corridors in Malaysia, and it was used to validate cost per MW ranges, typical fit-out intensity, and delay drivers that are not visible in public documents.
Distribution of primary research fieldwork respondents
| Company type | Respondent position |
|---|---|
| Top tier: 29% | CXOs: 15% |
| Mid tier: 53% | Functional/Unit leaders: 28% |
| Smaller Players: 18% | Managers: 57% |
Market-Sizing & Forecasting
Sizing is built using top-down and bottom-up logic in a practical way. First, a top-down build is reconstructed from the active and planned capacity pipeline in Malaysia, and it is then converted into yearly construction value using realistic cost per MW and typical project timing. Next, we apply selective bottom-up checks using sampled project announcements, contractor order book commentary, and approximate spend splits across civil works and MEP packages. Those checks are then used to adjust totals when the top-down picture looks too optimistic or too delayed.
Key inputs used in the model include announced and permitted capacity additions (MW), average construction cost per MW by facility type, the share of greenfield versus expansion projects, local labor and material cost movement, power availability and connection lead times, and reported construction durations for comparable builds. For forecasting, we run scenario analysis because project starts can shift with grid readiness, incentive clarity, and large tenant commitments. We then reconcile the scenarios to the most common view shared by industry respondents. Where data gaps exist on specific sites, we apply conservative timing lags and cost ranges, and then re-check the implied totals against what the contractor ecosystem can realistically deliver in a year.
Data Validation & Update Cycle
Model outputs are validated through several checks so unusual spikes or dips can be explained. We compare results against independent signals such as announced capacity pipelines, power connection progress, major tender activity, and observed changes in cost per MW, and then the variance is reviewed by a second analyst before sign-off.
If inconsistencies remain, respondents are re-contacted and assumptions are refined, especially around schedule slippage, scope creep in MEP, and imported equipment lead times. The report is refreshed annually, with interim updates when material events change the build pipeline, and a final pre-delivery review is completed so clients receive the most current view.
Mordor Intelligence's Malaysia Data Center Construction Market Estimate Compared With Other Published Estimates
Published market values for Malaysia data center construction do not always match because the underlying items being counted are not the same, and the time window for capturing project starts can also differ. Differences usually show up around what is treated as construction versus IT spend, how costs are converted across currencies, and how quickly project pipelines are refreshed.
IT racks and servers sit outside Mordor Intelligence's scope, which is a major reason our 2026 value does not track with sources that combine infrastructure build spend with broader data center equipment or operator capex totals.
Benchmark comparison
| Source | Market Size | Gaps in Research Methodology |
|---|---|---|
| Mordor Intelligence | USD 3.71 B (2026) | |
| Investment Bank Note A | USD 3.52 B (2026) | Often presented as near-term contract awards rather than full-year construction value, and it can miss multi-year phasing when large campuses are split into stages. |
| Real Estate Advisory B | USD 4.10 B (2026) | Commonly converts MW pipeline into value using a single cost per MW assumption and may pull forward projects that are still waiting on power connection timelines or final permitting. |
Overall, the spread is mostly explained by whether the estimate tracks booked construction work, pipeline-at-risk, or a full construction value view aligned to yearly execution. Our approach stays traceable to capacity additions, timing, and cost per MW inputs, which makes the total easier to reproduce and easier to update when project schedules change.


Key Questions Answered in the Report
How large is the Malaysia data center construction market in 2026 and what growth rate is expected?
It is valued at USD 3.71 billion in 2026 and is projected to grow at a 15.88% CAGR to USD 7.74 billion by 2031.
Why are hyperscalers investing directly instead of leasing space?
Dedicated campuses let hyperscalers optimize power density, cooling, and network architecture for AI workloads while locking renewable PPAs for sustainability targets.
Which Malaysian state attracts the most new data-center capacity?
Johor leads with roughly 60% of pipeline commitments thanks to land availability, proximity to Singapore, and streamlined approvals.
What makes Tier 4 facilities increasingly popular?
AI training and inference require concurrent-maintainable power and cooling, driving demand for Tier 4 redundancy and uptime guarantees above 99.995%.
How are operators mitigating rising electricity tariffs?
Most lock 20-year solar or wind PPAs under the Corporate Renewable Energy Supply Scheme to hedge tariff risk and meet ESG goals.
Where are the main bottlenecks in project execution?
Grid interconnection queues and a shortage of certified Tier 3/Tier 4 technicians are adding up to 12 weeks to commissioning timelines.
Page last updated on:
- Artificial Intelligence (AI) Data Center Market AI facilities across all regions, split by facility type, component and tier.
- Data Center Power Market Global power systems demand, split by component, tier and facility size.
- South Korea Data Center Power Market South Korea power systems, split by facility size and tier.
- Asia Pacific Hyperscale Data Center Market Asia-Pacific's hyperscale sites, split by data centre type, component and tier.
- Thailand Data Center Power Market Power systems demand across Thailand, covering component, facility type and facility size.
- Australia Data Center Power Market Australia's power systems, split by component, facility type and facility size.


 Your data is secure and never sold or shared.


