APAC Data Center Construction Market Size and Share
Market Overview
| Study Period | 2020 - 2031 |
|---|---|
| Forecast Data Period | 2026 - 2031 |
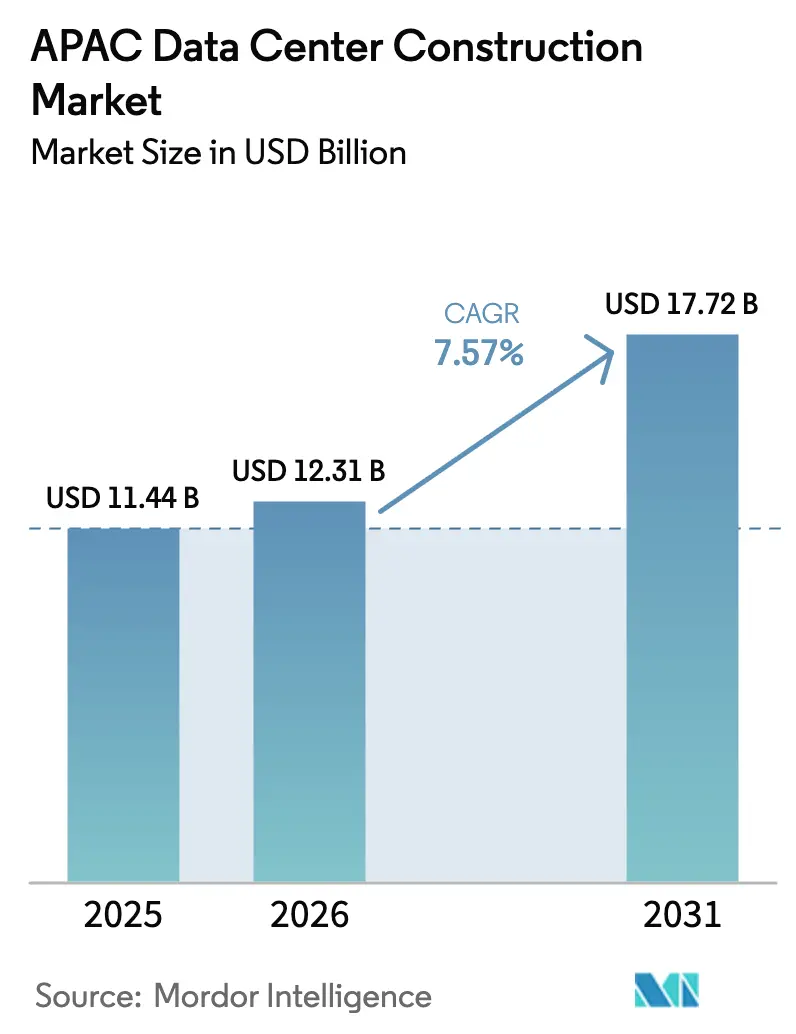
| Base Year Market Size (2025) | USD 11.44 Billion |
| Market Size (2026) | USD 12.31 Billion |
| Market Size (2031) | USD 17.72 Billion |
| Growth Rate (2026 - 2031) | 7.57% CAGR |
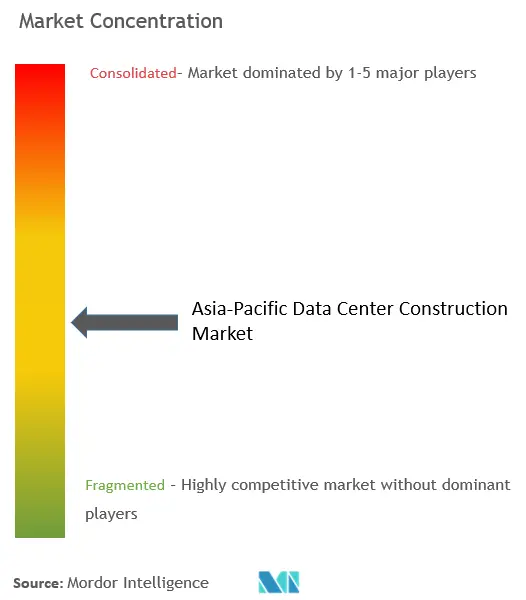
| Market Concentration | Medium |
Major Players *Disclaimer: Major Players sorted in no particular order Image © Mordor Intelligence. Reuse requires attribution under CC BY 4.0. | |
APAC Data Center Construction Market Analysis by Mordor Intelligence
The Asia Pacific data center construction market size in 2026 is estimated at USD 12.31 billion, growing from 2025 value of USD 11.44 billion with 2031 projections showing USD 17.72 billion, growing at 7.57% CAGR over 2026-2031. Growing investment in AI-ready hyperscale campuses, government-backed digital-economy programs, and green-financing instruments are driving sustained growth across every major economy in the region. Operators are re-designing facilities for 40-80 kW rack densities, accelerating demand for liquid-cooled electrical and mechanical systems. Secondary locations such as Johor Bahru and Batam are attracting record commitments as primary hubs face power and land constraints, while sovereign incentives in western China and provincial South Korea keep construction pipelines full. Competitive intensity is rising as cloud platforms shift from colocation leases to self-build projects that guarantee end-to-end control of AI workloads.
Key Report Takeaways
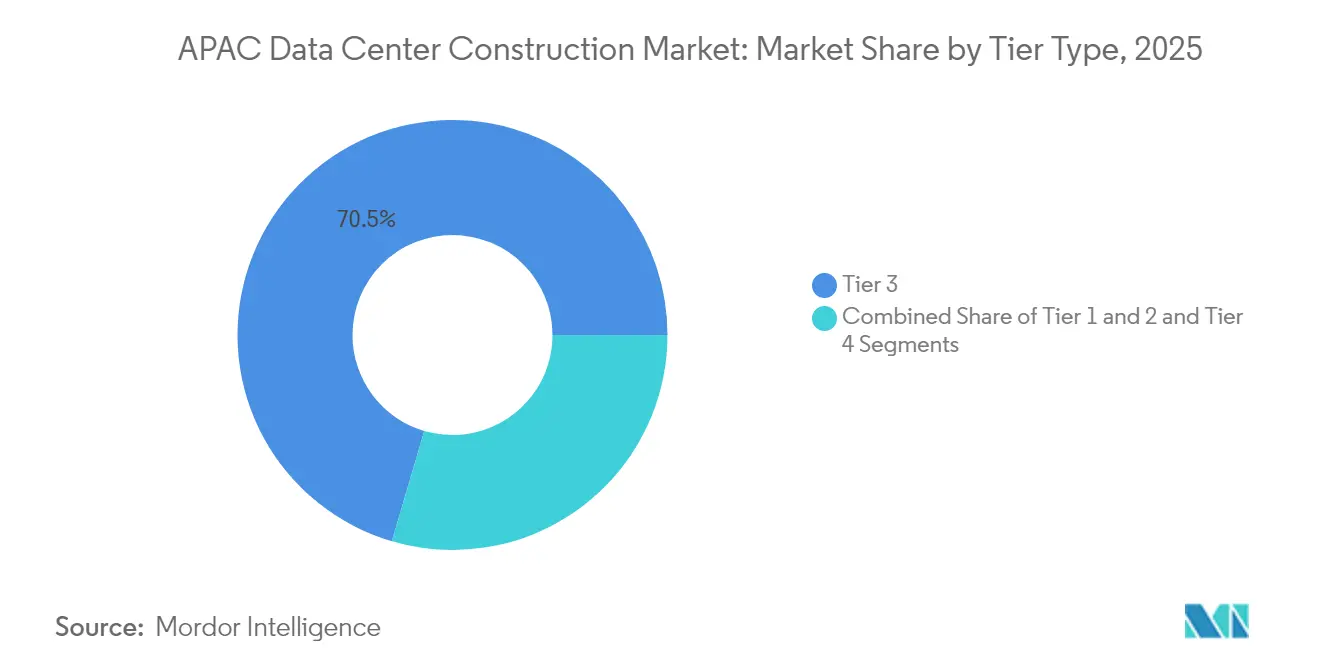
- By tier type, Tier 3 facilities held 70.45% revenue share of the Asia Pacific data center construction market in 2025, whereas Tier 4 builds are forecast to post the fastest 10.67% CAGR through 2031.
- By data center type, colocation retained 54.62% of the Asia Pacific data center construction market share in 2025, while self-build hyperscaler campuses are on track for a 12.05% CAGR to 2031.
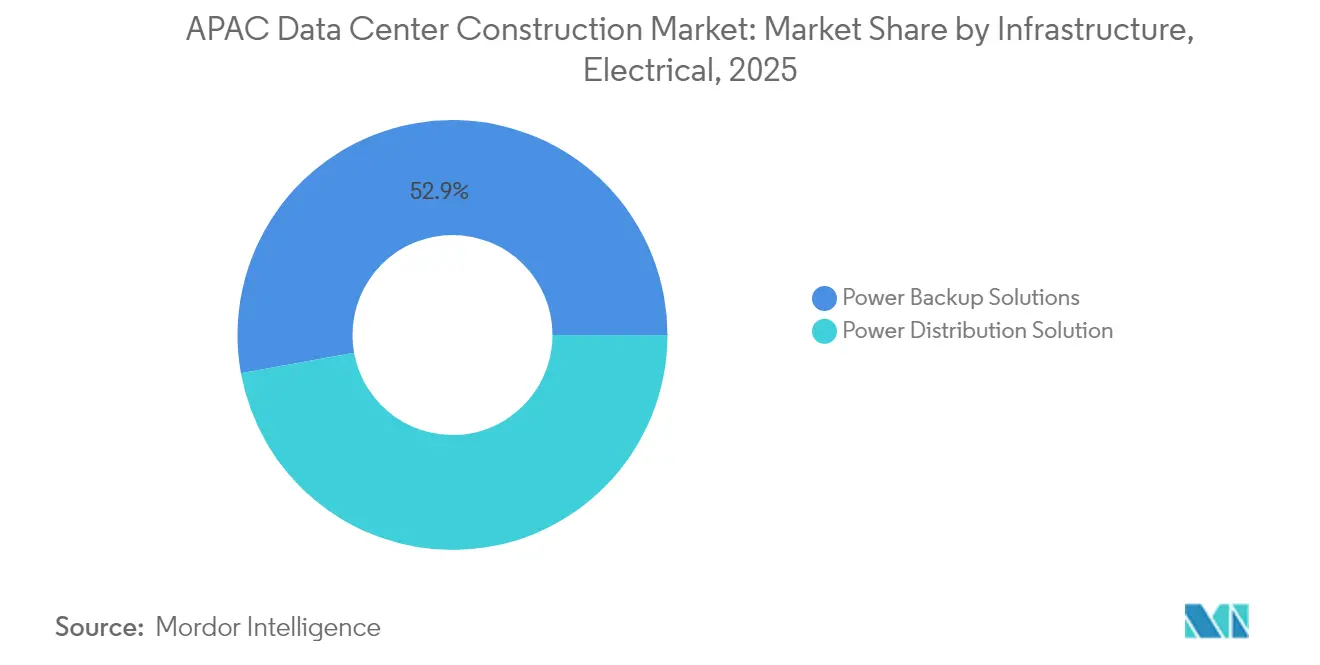
- By electrical infrastructure, power backup solutions commanded 52.85% of the Asia Pacific data center construction market size in 2025; power distribution solutions are projected to expand at 12.68% CAGR.
- By mechanical infrastructure, cooling systems accounted for 44.78% share of the Asia Pacific data center construction market size in 2025, with servers and storage advancing at 10.36% CAGR.
- Regionally, China led spending in 2024; Malaysia is the fastest-growing geography with Johor campuses expected to overtake Singapore capacity by 2028.
Note: Market size and forecast figures in this report are generated using Mordor Intelligence’s proprietary estimation framework, updated with the latest available data and insights as of 2026.
APAC Data Center Construction Market Trends and Insights
Drivers Impact Analysis*
| Driver | (~) % Impact on CAGR Forecast | Geographic Relevance | Impact Timeline |
|---|---|---|---|
| Hyperscale and AI demand for high-density campuses | +2.8% | Global, concentrated in China, Japan, South Korea | Medium term (2-4 years) |
| Government digital-economy and 5G push | +1.9% | APAC core, with spillover to Southeast Asia | Long term (≥ 4 years) |
| Sustainability-linked green financing | +1.2% | Global, early adoption in Singapore, Australia | Short term (≤ 2 years) |
| Spill-over migration from Singapore to Johor and Batam | +0.8% | Southeast Asia, focused on Malaysia and Indonesia | Medium term (2-4 years) |
| Edge DC builds at new submarine-cable landings | +0.6% | APAC coastal regions, submarine cable hubs | Long term (≥ 4 years) |
| Inland-China provincial land-power incentives | +0.5% | Western and Northern China provinces | Medium term (2-4 years) |
| Source: Mordor Intelligence | |||
Hyperscale and AI demand for high-density campuses
Asia Pacific operators are re-engineering layouts to host 40-80 kW racks, triple traditional thresholds, in order to run generative-AI model training at scale. South Korean and Japanese campus blueprints already stipulate multi-gigawatt utility feeds and direct-to-chip liquid cooling. Hyperscalers view control of power, network, and thermal environments as non-negotiable for latency and security, pushing design-build firms toward modular, prefabricated electrical rooms that slash deployment timelines. Capital flows mirror this shift; SK Telecom has earmarked KRW 3.4 trillion for AI infrastructure through 2028.[1]SK Telecom — “AWS and SKT to Build AI Data Center in Ulsan,” sktelecom.com Equipment vendors are responding with GPU-optimized switchgear and immersion-ready server chassis, tightening collaboration between silicon suppliers and construction contractors.
Government digital-economy and 5G push
Mandates such as China’s Eastern Data Western Compute program and Japan’s semiconductor and digital-industry roadmap are creating explicit build targets tied to sovereign compute capacity. Beijing’s initiative alone is mobilizing 400-500 billion RMB to deploy eight national hubs and ten regional clusters by 2030.[2]Ministry of Economy, Trade and Industry — “Strategy for Semiconductors and the Digital Industry,” meti.go.jp Similar laws in Vietnam require a National Data Centre with integrated risk-assessment functions beginning July 2025, immediately translating into tender activity. Parallel nationwide 5G rollouts elevate edge-node requirements, with telecom carriers leasing or co-developing micro-facilities alongside tower infrastructure to lower user-plane latency.
Sustainability-linked green financing
Loan structures indexed to power-usage effectiveness and renewable-energy coverage are lowering weighted average cost of capital for builders that surpass efficiency benchmarks. AirTrunk’s sustainability-linked facility sets annual targets on megawatt hours of renewable supply and data-center water usage.[3]AirTrunk — “AirTrunk Completes Sustainability-Linked Loan,” airtrunk.com AdaniConneX attracted USD 1.44 billion for ESG-compliant Indian campuses, while Princeton Digital Group closed Southeast Asia’s largest green loan at USD 280 million to fund a 150 MW Johor site. Access to cheaper funding is now a competitive advantage, especially in jurisdictions where utilities impose carbon-pricing mechanisms.
Edge DC builds at new submarine-cable landings
Every new cable landing station effectively seeds an edge-computing cluster because latency-sensitive services gravitate toward the first aggregation point of international traffic. Singapore’s Digital Connectivity Blueprint calls for doubling landing routes while situating “Green Data Hubs” within campus distances of shoreline tie-ins. Batam and Mactan have followed, expediting permits for data-center shells inside their cable-landing parks. Distributed micro-facilities reduce backhaul, improve user experience for streaming and gaming, and set up a logical migration path for autonomous-vehicle data offload.
Restraints Impact Analysis*
| Restraint | (~) % Impact on CAGR Forecast | Geographic Relevance | Impact Timeline |
|---|---|---|---|
| Data-sovereignty compliance hurdles | -1.4% | China, Vietnam, with spillover effects globally | Short term (≤ 2 years) |
| Power-grid bottlenecks in tier-1 metros | -0.9% | Singapore, Hong Kong, Tokyo, Seoul | Medium term (2-4 years) |
| High-seismic-zone insurance premiums | -0.6% | Japan, Philippines, Indonesia, New Zealand | Long term (≥ 4 years) |
| Liquid-cooling talent gap | -0.4% | Global, acute in Southeast Asia and emerging markets | Medium term (2-4 years) |
| Source: Mordor Intelligence | |||
Data-sovereignty compliance hurdles
New cross-border transfer rules in China and Vietnam obligate operators to perform risk assessments and appoint data-security officers, increasing both legal and technical overhead. The absence of a unified definition for “important data” forces multinational cloud platforms to replicate infrastructure country by country. Enterprises are incurring 15-20% incremental operating expense for duplicate archival systems, while construction-stage design must allocate extra white-space for nation-specific cage segregation.
Power-grid bottlenecks in tier-1 metros
Grid moratoria in Singapore and capacity queues in Tokyo and Hong Kong inject timing uncertainty into project schedules. AI-ready blocks that need 50-100 MW continuous loads sometimes wait 24-36 months for permits. As a mitigation, developers are pivoting to Johor, Ulsan, and Western China where industrial estates bundle land with captive generation. LNG and offshore-wind hybrids are emerging as interim sources until regional grids upgrade transmission corridors.
*Our forecasts treat driver/restraint impacts as directional, not additive. The impact forecasts reflect baseline growth, mix effects, and variable interactions.
Segment Analysis
By Tier Type: Tier 4 Emerges Despite Tier 3 Dominance
Tier 3 sites accounted for 70.45% of the Asia Pacific data center construction market in 2025, validating their cost-efficiency for most enterprise and cloud use cases. Yet hyperscale AI training demands fail-safe redundancy; therefore Tier 4 capacity is set to register an 10.67% CAGR through 2031. The Asia Pacific data center construction market size for Tier 4 builds is rising fastest in South Korea and Japan where multi-petaflop clusters mandate concurrent maintainability. Operators accept an estimated 40-60% capex premium because contract clauses guarantee 99.995% uptime, a pre-condition for GPU leasing revenue streams. Uptime Institute certifications are becoming competitive differentiators. NEXTDC’s accredited Tier IV Sydney campus illustrates how audit-based credentials secure premium pricing. Simultaneously, some Chinese and Australian contracts specify “Tier 4-plus” add-ons such as dual utility feeds from separate substations. Although Tier 1 and Tier 2 footprints persist for edge or industrial IoT nodes, their relevance is shrinking as enterprise colocation renewals migrate to higher resilience tiers.


By Data Center Type: Hyperscaler Self-Build Disrupts Colocation Model
Colocation still held 54.62% of the Asia Pacific data center construction market share in 2025, buoyed by financial-services and gaming tenants seeking carrier-neutral interconnect. Nevertheless, the self-build trajectory of Amazon, Google, Microsoft, and Alibaba underpins a 12.05% CAGR for owner-operated campuses to 2031. The Asia Pacific data center construction market size for self-build projects has escalated in Australia where AWS alone earmarked AUD 20 billion for new capacity between 2025 and 2029.
As hyperscalers internalize real estate, colocation incumbents respond by clustering in under-served metros and layering managed AI-platform services. ST Telemedia Global Data Centres will inject USD 3.2 billion into 550 MW of India builds, repackaging halls as turnkey GPU-pods. Edge and enterprise micro-sites also grow but at a measured clip, hinging on 5G densification and corporate hybrid-cloud preferences.
By Electrical Infrastructure: Power Distribution Innovation Drives Growth
Power backup solutions captured 52.85% of 2025 spend, reflecting the Asia Pacific data center construction market’s historic focus on generator and UPS resilience. Rising rack densities, however, make intelligent power distribution units the fastest-growing sub-segment, charting 12.68% CAGR through 2031. High-density layouts require busway designs that dynamically re-route amperage, while lithium-ion battery strings displace traditional VRLA cabinets to shave floor loading.
Renewables integration is also changing schematics. Projects such as HiCloud’s offshore wind-powered underwater module near Shanghai showcase battery energy storage systems coupled directly to turbine output. Smart-grid interfaces enable campuses to offer demand-response services and monetize idle capacity during non-peak training cycles, aligning operational savings with green-loan covenants.
By Mechanical Infrastructure: Liquid Cooling Transforms Server Architecture
Cooling systems represented 44.78% of outlays in 2025 but are transitioning from air to liquid modalities. Direct-to-chip loops and immersion tanks now underpin designs exceeding 80 kW per rack. Canon IT Solutions retrofitted its West Tokyo site for 100 kVA racks using DLC manifolds, validating retrofit economics without full shutdown.
Servers and storage investments, expanding at 10.36% CAGR, bundle high-bandwidth fabrics and NVMe arrays tuned for AI inference. Chassis vendors partner with cooling-fluid specialists to certify leak-proof quick-disconnects, while cabinet makers release sealed doors with integrated heat-exchanger panels. Modular edge pods leverage the same architectures at micro-scale, enabling telecom carriers to deploy 5 kW liquid-ready cabinets beside 5G base stations.
Geography Analysis
China retained top position in 2024 construction value on the strength of the Eastern Data Western Compute scheme, which disburses subsidies for land and renewable electricity in Guizhou, Gansu, and Inner Mongolia. Several western provinces now offer power tariffs 20-30% below coastal rates, encouraging cloud majors to shift latency-insensitive loads inland. The Asia Pacific data center construction market size for western Chinese clusters will therefore eclipse coastal additions by the late-2020s, even as national electricity demand from data centers could reach 600 TWh by 2030.
Southeast Asia is the fastest-rising sub-region. Malaysia attracted USD 23.3 billion of commitments in 2024, and Johor campuses are set to overtake Singapore capacity by 2028. Indonesia’s Batam Special Economic Zone is pairing cable-landing licenses with land parcels, drawing hyperscalers that require sub-20 ms latency into Jakarta. Vietnam’s new Law on Data mandates creation of a National Data Centre and drives local build pipelines; simultaneous cross-border rules are influencing network topologies for multinational tenants.
Developed APAC economies emphasise AI speciality builds and sustainability. South Korea has green-lit a 3 GW Jeollanam-do mega-site and AWS-SK Telecom’s 103 MW LNG-cooled campus in Ulsan. Japan’s ministry programs target 2 trillion-yen cumulative market value by 2030, encouraging deployments in Fukushima and Osaka equipped with NVIDIA H100 clusters. Australia follows with record hyperscale capex, alongside NEXTDC’s Sydney S7 land purchase that will support a Tier IV, 300 MW precinct once grid upgrades conclude.
Competitive Landscape
Industry structure is moderately fragmented; traditional colocation groups coexist with vertically integrated cloud builders. Blackstone’s USD 16 billion acquisition of AirTrunk and KKR’s USD 1.75 billion injection into ST Telemedia Global Data Centres illustrate private-equity appetite for scale platforms. Partnerships such as Singtel–Hitachi target 200 MW of regional AI-ready capacity, bundling GPU cloud services with construction expertise.
Technology leadership is the key differentiator. Equinix deploys green-bond proceeds to reach 96% renewable-energy coverage across 172 projects, positioning itself for ESG-driven tenant procurement. EdgeConneX expands into Japan to capture submarine-cable edge demand, while domestic Chinese players leverage state incentives to export design services across Belt-and-Road partners.
Supplier ecosystems are also shifting. Electrical OEMs co-develop prefabricated power rooms tailored for GPU voltage stability, and liquid-cooling specialists license patented dielectric fluids to systems integrators. Construction timelines shorten as modular blocks leave factories 90% complete, enabling 20–25 MW go-live targets inside 12 months, a critical capability for AI pipeline launches.
APAC Data Center Construction Industry Leaders
DPR Construction Inc.
Turner Construction Company
Exyte GmbH
Leighton Asia
AECOM
- *Disclaimer: Major Players sorted in no particular order

Recent Industry Developments
- June 2025: Aslan Energy Capital signed a binding agreement for a Jakarta campus incorporating a 120 MWh battery-energy storage system
- June 2025: Amazon committed AUD 20 billion to Australian data-center builds for 2025-2029, including three new solar farms.
- June 2025: SK Group and AWS confirmed a 103 MW AI facility in Ulsan using LNG cold-energy cooling
- June 2025: HiCloud agreed to develop China’s first offshore-wind powered underwater data center near Shanghai.
- June 2025: DBS and UOB issued a USD 411 million loan to the DayOne-INA campus in Indonesia
- May 2025: Vietnam’s Law on Data entered force, mandating a National Data Centre


Research Methodology Framework and Report Scope
Market Definitions and Key Coverage
Our study defines the Asia-Pacific data center construction market as annual spending on site preparation, electrical back-up and distribution, mechanical cooling, general build works, and associated design or maintenance services required to deliver Tier 1-4 data halls that host IT gear. Conversions of existing office or factory space, pure IT hardware procurement, and facility operating costs lie outside this boundary.
Scope exclusion: investments allocated purely to servers, storage, or network hardware are not counted.
Segmentation Overview
- By Tier Type
- Tier 1 and 2
- Tier 3
- Tier 4
- By Data Center Type
- Colocation
- Self-build Hyperscalers (CSPs)
- Enterprise and Edge
- By Infrastructure
- By Electrical Infrastructure
- Power Distribution Solution
- Power Backup Solutions
- By Mechanical Infrastructure
- Cooling Systems
- Racks and Cabinets
- Servers and Storage
- Other Mechanical Infrastructure
- General Construction
- Service - Design and Consulting, Integration, Support and Maintenance
- By Electrical Infrastructure
Detailed Research Methodology and Data Validation
Primary Research
Mordor analysts held structured calls with design engineers, EPC contractors, and colocation procurement heads across China, India, Japan, Australia, and Malaysia. Interviews validated typical rack densities, liquid-cooling adoption timelines, and hyperscaler self-build ratios that secondary data could not fully capture.
Desk Research
We began with public datasets from regulators and trade bodies such as the National Bureau of Statistics of China, Singapore IMDA, Japan MIC, and Australia's Clean Energy Regulator, which map land banks, power availability, and renewable quotas. Industry benchmarks from Uptime Institute and selective press disclosures were mined through Dow Jones Factiva. Company filings pulled via D&B Hoovers helped us flag project-level CAPEX norms. These sources, alongside many others not exhaustively listed here, gave foundational totals and unit economics.
Market-Sizing & Forecasting
A top-down "CAPEX pool reconstruction" turned regional new-build megawatts into spend using average cost per MW, which is then cross-checked with selective bottom-up samples of contractor revenues and channel checks. Key inputs include grid connection lead time, median cost per MW, rack density progression, PUE targets, AI workload share, and hyperscaler land bank announcements. Multivariate regression on these drivers projects values to 2030, while bottom-up roll-ups close data gaps where disclosures are thin.
Data Validation & Update Cycle
Outputs pass two analyst reviews; anomaly flags trigger re-contact with sources, and results are refreshed every twelve months or sooner if a material event, such as a government moratorium or hyperscale megacampus, is announced.
Why Our APAC Data Center Construction Baseline Earns Trust
Published estimates differ because firms mix IT hardware, consider varying country baskets, or apply disparate cost curves.
Key gap drivers include: some studies fold in servers and storage costs, others assume universal Tier 4 builds, and many still rely on 2022 exchange rates or single-point cost averages that ignore the sharp rise in liquid-cooling expenses. Our model, anchored to verified cost per MW and refreshed yearly, corrects these skews.
Benchmark comparison
| Market Size | Anonymized source | Primary gap driver |
|---|---|---|
| USD 11.44 bn (2025) | Mordor Intelligence | - |
| USD 18.63 bn (2024) | Regional Consultancy A | Includes retrofit OPEX and a broader country list |
| USD 26.25 bn (2024) | Industry Publisher B | Blended IT hardware with construction spend |
| USD 74.73 bn (2024) | Global Analytics C | Uses global average cost per MW without regional cost scaling |
The comparison shows that once non-construction items and inflated cost assumptions are stripped out, Mordor's disciplined scope and annually refreshed variables produce a balanced, decision-ready baseline for planners.


Key Questions Answered in the Report
What is the current size of the Asia Pacific data center construction market?
The market reached USD 12.31 billion in 2026 and is expected to hit USD 17.72 billion by 2031.
Which tier classification dominates new builds in Asia Pacific?
Tier 3 still leads with 70.45% share, but Tier 4 facilities are growing fastest at 10.67% CAGR.
Why are hyperscalers moving from colocation to self-build campuses?
Direct control over high-density AI workloads, power, cooling, and security drives a 12.05% CAGR for self-build projects through 2031.
How are sustainability goals influencing project financing?
Operators secure lower-cost capital through sustainability-linked loans that reward energy-efficiency and renewable-power milestones.
Which Southeast Asian location is emerging as the next hyperscale hub after Singapore?
Johor Bahru, Malaysia, backed by abundant land and green-loan funding, is projected to surpass Singapore’s installed capacity by 2028.
What technologies enable 40-80 kW rack densities required for AI?
Direct-to-chip and immersion liquid-cooling systems combined with intelligent power distribution units manage the higher thermal and electrical loads.
Page last updated on:


