United Kingdom Data Center Construction Market Size and Share
Market Overview
| Study Period | 2020 - 2031 |
|---|---|
| Forecast Data Period | 2026 - 2031 |
| Historical Data Period | 2020 - 2024 |
| Market Size (2026) | USD 2.25 Billion |
| Market Size (2031) | USD 4.92 Billion |
| Growth Rate (2026 - 2031) | 16.94% CAGR |
| Market Concentration | Medium |
Major Players *Disclaimer: Major Players sorted in no particular order Image © Mordor Intelligence. Reuse requires attribution under CC BY 4.0. | |

United Kingdom Data Center Construction Market Analysis by Mordor Intelligence
The United Kingdom data center construction market size reached USD 2.25 billion in 2026 and is projected to climb to USD 4.92 billion by 2031, reflecting a 16.94% CAGR over the period. Hyperscaler pre-leasing, government designation of data centers as critical national infrastructure, and sovereign ambitions for domestic AI compute are compressing development cycles and lifting funding appetite. A pivot toward GPU-dense designs is forcing higher rack power densities and accelerating the shift from air to liquid cooling. Meanwhile, grid congestion in the South-East and inflation in mechanical-electrical-plumbing (MEP) inputs are nudging capital toward Manchester, Scotland, and other regions where renewable electricity and land remain available. Partnerships between general contractors and specialist MEP firms are becoming the norm as owners demand turnkey delivery within narrower schedules.
Key Report Takeaways
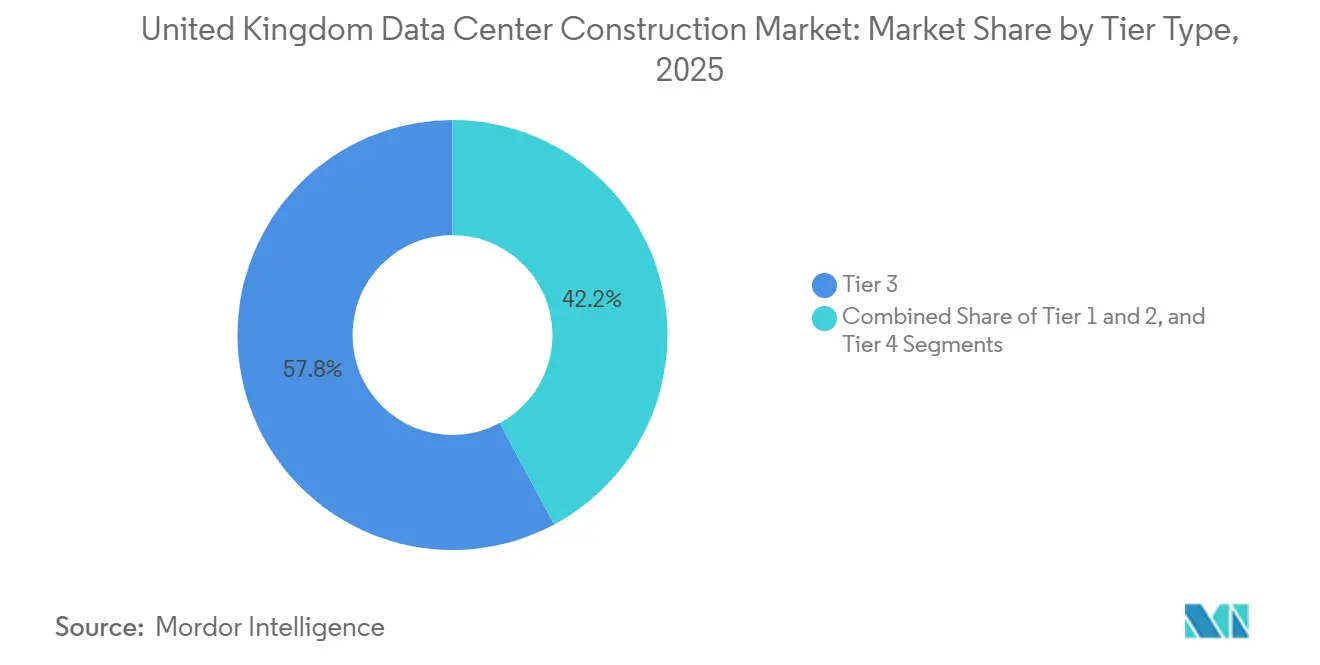
- By Tier Type, Tier 3 facilities led with a 57.84% revenue share in 2025, while Tier 4 is projected to advance at a 17.32% CAGR through 2031.
- By Data Center Size, hyperscale configurations accounted for a 62.65% share of the United Kingdom data center construction market size in 2025 and are poised to expand at a 17.43% CAGR to 2031.
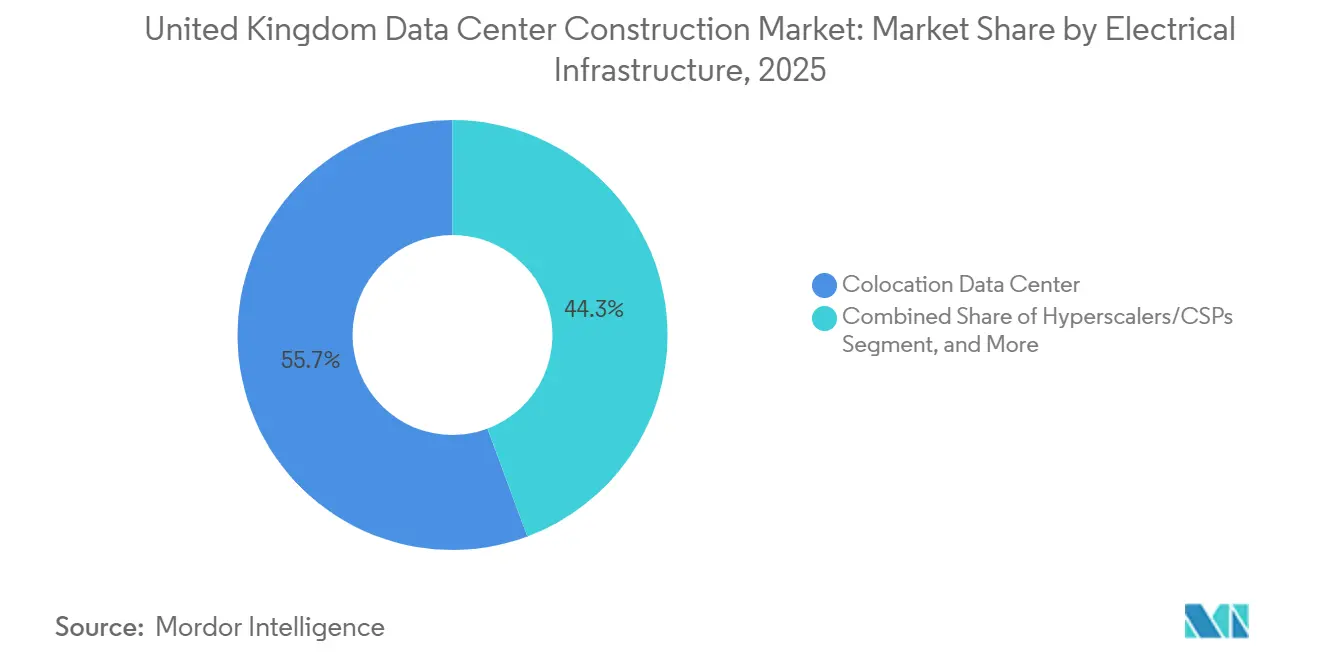
- By Data Center Type, colocation sites captured 55.68% of the United Kingdom data center construction market share in 2025, whereas owned hyperscaler facilities are set to grow at a 17.86% CAGR through 2031.
- By Infrastructure, electrical systems accounted for 40.45% of 2025 spending, yet mechanical infrastructure is forecast to post a 17.66% CAGR through 2031.
Note: Market size and forecast figures in this report are generated using Mordor Intelligence’s proprietary estimation framework, updated with the latest available data and insights as of January 2026.
United Kingdom Data Center Construction Market Trends and Insights
Drivers Impact Analysis*
| Driver | (~) % Impact on CAGR Forecast | Geographic Relevance | Impact Timeline |
|---|---|---|---|
| Hyperscaler Pre-Leasing and AI-GPU Demand Wave | +4.8% | National, concentrated in South-East England and Manchester | Short term (≤ 2 years) |
| 5G/6G Roll-Out Accelerates Edge and Core Build-Outs | +3.2% | National, early gains in London, Manchester, Edinburgh | Medium term (2-4 years) |
| Government AI Growth Zones and £14 Billion CNI Program | +2.9% | National, priority zones in Manchester, West Midlands, Edinburgh | Medium term (2-4 years) |
| Nationally Significant Infrastructure Fast-Track Permits | +2.1% | National, especially South-East England and Midlands | Short term (≤ 2 years) |
| Data-Center-as-Critical-Infrastructure Tax Incentives | +1.6% | National | Medium term (2-4 years) |
| On-Site Small-Modular-Reactor Pilots for Green Power | +0.9% | Pilot sites in Northern England and Scotland | Long term (≥ 4 years) |
| Source: Mordor Intelligence | |||
Hyperscaler Pre-Leasing and AI-GPU Demand Wave
Microsoft’s GBP 30 billion pledge bundled owned halls with long-term pre-leases that guarantee occupancy as soon as power is switched on. Google followed with a GBP 5 billion (USD 6.12 billion) program that locks in tenant status for GPU-dense space across multiple campuses. Nvidia then committed GBP 11 billion (USD 13.6 Billion) to inference-optimized capacity, further validating the anchor-tenant model. Developers such as CyrusOne secured 90 MW in Enfield before breaking ground, compressing financing spreads by 150-200 basis points.[1]UK Department for Science, Innovation and Technology, “AI Growth Zones Announced,” gov.uk The government’s critical-infrastructure designation reinforced investor confidence by signaling regulatory stability.[2]CyrusOne, “CyrusOne Announces LON6 Data Centre in London,” cyrusone.com
5G ⁄ 6G Roll-Out Accelerates Edge and Core Build-Outs
BT and AWS activated Wavelength Zones in London and Manchester, embedding cloud compute inside carrier networks to hit sub-10 millisecond latency for augmented-reality and autonomous-vehicle workloads. Vodafone paired with Google Cloud to deploy edge nodes across 15 cities by 2026, spreading demand beyond traditional hubs. The private 5G grid at Thames Freeport shows industrial clusters bypassing public carriers for dedicated edge infrastructure. A GBP 1 billion diversification fund is subsidizing domestic equipment supply, shortening procurement cycles for new micro-data centers. These initiatives fragment capacity additions into dozens of 1-5 MW sites, extending the construction opportunity set nationwide.
Government AI Growth Zones and £14 Billion CNI Program
Data-center designation as critical national infrastructure unlocked accelerated consultations and tied the sector to a GBP 14 billion (USD 17.36 billion) public-private upgrade plan for grid, fiber, and roads. AI Growth Zones in Greater Manchester, the West Midlands, and Edinburgh received GBP 500 million (USD 620 Million) to cut connection fees and shave months from project timelines. National Grid awarded a GBP 9 billion (USD 11.2 billion) reinforcement framework that allocates 15 GW of South-East capacity by 2030, assuring developers that power will be available when sites go live. Collectively, the grants and grid upgrades add almost three percentage points to mid-term build velocity.
Nationally Significant Infrastructure Fast-Track Permits
The Planning and Infrastructure Act 2025 moved data center projects above 50 MW into the Nationally Significant Infrastructure Project regime, cutting approval windows from 18 months to about 6 months. Updated National Policy Statements EN-1, EN-3, and EN-5, published in January 2026, put data centers on the same policy footing as power plants. The Abbots Langley case, which lingered 14 months in local appeals before winning permission, illustrates the delays the new regime eliminates. While developers must now submit net-zero pathways and secured grid offers up front, the streamlined path materially derisks large campuses.
Restraints Impact Analysis*
| Restraint | (~) % Impact on CAGR Forecast | Geographic Relevance | Impact Timeline |
|---|---|---|---|
| Grid Congestion in South-East, 132 kV Moratoriums | -3.1% | South-East England, notably Greater London and Thames Valley | Short term (≤ 2 years) |
| Construction-Grade Labor and MEP Cost Inflation | -2.4% | National | Medium term (2-4 years) |
| Local Opposition over Water and Visual Footprint | -1.2% | Water-stressed South-East and select rural sites | Medium term (2-4 years) |
| Tight EU/UK Scope-3 Carbon-Reporting Compliance | -0.8% | National | Long term (≥ 4 years) |
| Source: Mordor Intelligence | |||
Grid Congestion in South-East, 132 kV Connection Moratoriums
National Grid ESO paused new 132 kV offers in parts of Greater London and surrounding counties, creating seven-to-ten-year delays unless developers bankroll costly upstream upgrades. Project budgets can rise by GBP 150 million (USD 186 million) for a 100 MW campus under such self-funded reinforcement. Equinix chose a bespoke 400 kV feed for its GBP 3.9 billion (USD 4.84 billion) Hertfordshire campus, but the workaround added 18 months to the pre-construction timeline. Developers are therefore pivoting to Manchester and Scotland, where SP Energy Networks and SSE Networks still offer three-year energization slots.
Construction-Grade Labor and MEP Cost Inflation
RICS recorded a 12% year-on-year jump in MEP wages in 2025, reflecting post-Brexit skill shortages and competition from residential megaprojects.[3]Royal Institution of Chartered Surveyors, “UK Construction Market Survey,” rics.org Schneider Electric noted that transformer lead times extended to 42 weeks, up from 26 weeks two years earlier. Copper prices climbed 18% in 2025, inflating busbar and cabling costs. Builders that deploy factory-fabricated skids have cut on-site labor by up to 40% and trimmed schedules by eight months, yet Balfour Beatty reports adoption below 20% of new build value.
*Our forecasts treat driver/restraint impacts as directional, not additive. The impact forecasts reflect baseline growth, mix effects, and variable interactions.
Segment Analysis
By Tier Type: Redundancy Premium Drives Tier 4 Uptake
Tier 3 sites captured 57.84% of revenue in 2025, underscoring their suitability for general enterprise workloads that tolerate planned maintenance windows. The Financial Conduct Authority’s operational-resilience mandate, effective March 2025, requires banks to withstand infrastructure failures, nudging critical applications toward Tier 4 halls that duplicate every power and cooling path. Although Tier 4 designs demand 30-40% more capital, they remove downtime risk, appealing to financial services and healthcare operators. Over 2026-2031, Tier 4 is forecast to register a 17.32% CAGR, outpacing the broader United Kingdom data center construction market.
Demand for Tier 3 remains healthy among price-sensitive colocation customers. Operators such as Digital Realty recently expanded London campuses with Tier 3, N+1 redundancy to balance uptime guarantees against competitive rent. Tier 1 and Tier 2 footprints continue to shrink as legacy enterprise sites are decommissioned. The net effect is a gradual migration toward higher redundancy, aligning with government rhetoric on critical infrastructure and supporting the United Kingdom data center construction market’s premium-driven growth profile.


By Data Center Size: Hyperscale Supremacy
Hyperscale campuses exceeded 50 MW and accounted for 62.65% of revenue in 2025. Power-purchase leverage, cooling economies, and labor utilization drive power usage effectiveness (PUE) below 1.15, compared with 1.4-1.6 for smaller builds. Equinix’s Hertfordshire expansion and QTS’s GBP 10 billion (USD 12.4 billion) Blyth plan exemplify modular phasing, allowing supply to track tenant ramps. Over the forecast period, hyperscale is expected to record a 17.43% CAGR, reinforcing its dominance in the United Kingdom data center construction market.
Large (10-50 MW) and medium (5-10 MW) facilities together attract regional enterprises that need proximate compute but lack hyperscale budgets. Kao Data’s 30 MW Manchester campus typifies this cohort. Small edge sites under 5 MW are declining as compute shifts into telecom street furniture. Overall, scale remains the single-largest predictor of capital efficiency, ensuring hyperscale’s structural advantage persists.
By Data Center Type: The Colocation-Hyperscaler Hybrid
Colocation operators held a 55.68% stake in 2025, driven by enterprise lift-and-shift migrations and tight capital budgets. Yet owned hyperscaler sites are projected to expand at a 17.86% CAGR as Microsoft, Google, and AWS internalize GPU clusters to fine-tune cooling, network, and security parameters. Anchor leases are still common: Equinix pre-leased entire Hertfordshire phases to multiple hyperscalers, locking in 15-year revenue streams while retaining ownership of the buildings.
Enterprises lacking hyperscale balance sheets gravitate toward colocation, drawn by renewable energy procurement and carbon-tracking services. Edge data centers account for a shrinking 15% slice because mobile operators now co-locate compute at tower sites. Consequently, a hybrid model, developer-owned real estate tailored to hyperscaler specifications, defines the future profile of the United Kingdom data center construction market.
By Infrastructure: Liquid Cooling Reconfigures CapEx Mix
Electrical systems accounted for 40.45% of 2025 spending, reflecting the capital-intensive nature of substations, switchgear, and uninterruptible power supplies. However, mechanical infrastructure is set to rise at a 17.66% CAGR as racks transition from 8 kW air-cooled to 60 kW liquid-cooled configurations. Direct-to-chip solutions and immersion tanks are proliferating; Mitsubishi Electric’s rear-door heat exchangers enable 40 kW racks without overhauling legacy mechanical rooms. Stellium’s Slough retrofit cut PUE from 1.4 to 1.05, confirming the operational upside.
General construction and professional services together account for roughly 35% of spend, but their shares will decline as prefabricated modules push more value into factory settings. The cooling revolution, therefore, reshapes the bill of materials and sustains double-digit expansion within the United Kingdom data center construction market.
Geography Analysis
The South-East commanded roughly 65% of 2025 investment, thanks to proximity to London’s financial core, subsea cable landings, and dense dark-fiber routes. Equinix, Colt DCS, and Ark Data Centres each broke ground on multi-billion-pound expansions, but grid connection freezes and outspoken water utilities have tempered enthusiasm. Developers are responding by adopting closed-loop or adiabatic systems that curb water draw by up to 80%, mitigating community opposition.
Manchester captured 15% of new build value in 2025, buoyed by AI Growth Zone grants and SP Energy Networks’ three-year connection offers. BT-AWS Wavelength Zones underline the city’s edge-compute credentials, while Kao Data’s campus demonstrates the appetite for mid-scale capacity. The West Midlands and Edinburgh are gaining traction on similar policy and connectivity logic.
Scotland attracted 8% of 2025 spend, led by QTS’s Blyth megaproject and abundant wind power that yields power purchase agreements at below-market rates. Lower land prices and cool ambient temperatures provide additional incentives, even though fiber backhaul to London incurs longer routes. Wales and the Midlands shared the remaining 12%, with Thames Freeport’s private 5G initiative showcasing industrial-edge potential.
Grid relief frameworks, renewable surpluses, and infrastructure grants are nudging capital beyond the M25. As a result, regional diversification lessens the South-East bottleneck and broadens opportunity across the United Kingdom data center construction market.
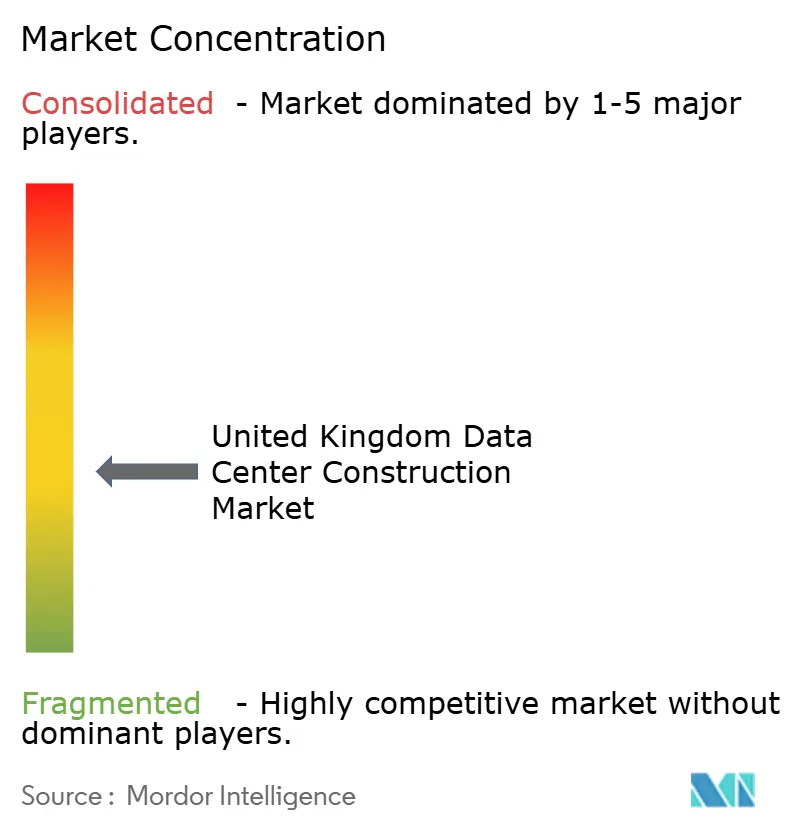
Competitive Landscape
The market is moderately fragmented. Skanska, ISG, and AECOM dominate shell-and-core scopes, while Mercury Engineering, Mace, and Laing O’Rourke lead MEP packages. Equinix’s choice of a Skanska-Mercury joint venture on Hertfordshire signals a trend toward integrated project delivery, where design, procurement, and build risk sit with a single consortium.
Modular construction remains a white-space opportunity: fewer than one-in-five new builds use factory-fabricated skids, yet those that do report 30-40% reductions in on-site manpower and eight-month schedule savings. Equipment vendors such as Schneider Electric are climbing the value stack by bundling software that monetizes battery arrays in frequency-response markets.
Emerging specialists in liquid cooling, notably Submer and LiquidStack, bypass traditional mechanical contractors by offering turnkey immersion solutions, carving out a profitable niche as AI workloads proliferate. Sustainability regulations further tilt the playing field toward firms that can quantify embodied carbon, an area where Mace and Arup invested heavily in digital toolsets during 2025. Overall, the competitive narrative remains dynamic but tilts toward integrated, sustainability-literate providers within the United Kingdom data center construction industry.
United Kingdom Data Center Construction Industry Leaders
ISG Ltd
AECOM
Rider Levett Bucknall
Mercury Engineering
Skanska UK plc
- *Disclaimer: Major Players sorted in no particular order

Recent Industry Developments
- January 2026: The Department for Energy Security and Net Zero updated National Policy Statements EN-1, EN-3, and EN-5, granting data centers the same presumption of approval as power plants.
- November 2025: The Planning and Infrastructure Act 2025 took effect, reclassifying >50 MW sites as NSIPs and slashing approval timelines.
- September 2025: National Grid awarded a GBP 9 billion reinforcement framework to Laing O’Rourke, AECOM, and Balfour Beatty to unlock 15 GW of South-East capacity.
- August 2025: Equinix unveiled a GBP 3.9 billion Hertfordshire campus expansion totaling 250 MW across multiple phases.


Research Methodology Framework and Report Scope
Market Definitions and Key Coverage
Our study defines the United Kingdom data center construction market as the value of design, civil works, mechanical-electrical-plumbing fit-outs, and commissioning for new build or capacity-expansion facilities that host mission-critical IT equipment across the UK.
Projects covering only interior refurbishments of server rooms below 250 kW are outside scope.
Segmentation Overview
- By Tier Type
- Tier 1 and 2
- Tier 3
- Tier 4
- By Data Center Size
- Small
- Medium
- Large
- Hyperscale
- By Data Center Type
- Colocation Data Center
- Hyperscalers/Cloud Service Provider (CSPs)
- Enterprise and Edge Data Center
- By Infrastructure
- Electrical Infrastructure
- Power Distribution Solution
- Power Backup Solutions
- Mechanical Infrastructure
- Cooling Systems
- Racks and Cabinets
- Servers and Storage
- Other Mechanical Infrastructure
- General Construction
- Services - Design and Consulting, Integration, Support and Maintenance
- Electrical Infrastructure
Detailed Research Methodology and Data Validation
Primary Research
Mordor analysts interviewed construction managers, colocation design leads, and permitting consultants active in London, Manchester, and the "energy-rich" North East. Discussions clarified average megawatt build costs, liquid-cooling adoption curves, and realistic grid-connection lead times, validating secondary signals and refining timeline assumptions.
Desk Research
We started with construction output series from the Office for National Statistics, Ofgem grid-connection records, Department for Science Innovation & Technology planning notes, and the UK Green Building Council's embodied-carbon guidelines to anchor investment intensity. Tender notices, Environmental Impact Statements, and Uptime Institute certification logs provided project-level timing and tier mix clues. Financials drawn from D&B Hoovers and press archives via Dow Jones Factiva helped benchmark leading contractors' UK revenue splits. These sources illustrate the evidence base; numerous additional publications, filings, and newsfeeds were reviewed to complete the picture.
Market-Sizing & Forecasting
A top-down approach converts national data-center megawatt additions, calculated from grid queue entries and planning approvals, into spend using our blended CAPEX per-MW curve, which varies by tier and cooling density. Select bottom-up checks, such as contractor revenue roll-ups and sampled project bills of quantities, are then overlaid to tighten totals. Key variables feeding the model include: (1) announced hyperscale capacity pipeline, (2) colocation pre-leasing ratios, (3) average build-time elongation driven by power-allocation delays, (4) construction-steel inflation, and (5) renewable-energy share mandates. A multivariate regression against these drivers guides the 2025-2030 forecast, and gaps in bottom-up evidence are bridged by expert-agreed ranges.
Data Validation & Update Cycle
Our outputs pass two rounds of anomaly screening, peer review, and leadership sign-off. We update the model each year, triggering interim revisions when major policy moves, hyperscale land acquisitions, or material cost shocks occur.
Why Mordor's United Kingdom Data Center Construction Baseline Is Dependable
Published estimates often differ because firms choose distinct scopes, input series, and refresh cadences. In data-center construction, totals swing when refurbishment work, land costs, or contingency buffers are treated inconsistently.
Key gap drivers we observed are: some publishers bundle electrical equipment resale, others assume constant $/MW despite liquid-cooling premiums, while a few roll forward 2021 build-to-supply ratios without rechecking the 132 kV connection moratorium in South-East England.
Mordor's model aligns scope strictly to on-site construction spend, applies dynamic cost curves, and is refreshed annually with verified grid and planning data.
Benchmark comparison
| Market Size | Anonymized source | Primary gap driver |
|---|---|---|
| USD 1.94 B (2025) | Mordor Intelligence | - |
| USD 7.30 B (2024) | Global Consultancy A | Includes retrofit interiors and fixture renewals; uses static $/MW |
| USD 11.28 B (2024) | Regional Consultancy B | Adds land purchase and developer fees; no tier-specific cost uplift |
| USD 13.53 B (2024) | Trade Journal C | Applies Europe-wide cost factors, omits power-delay project deferrals |
In sum, our disciplined scope definition, variable-driven cost curve, and yearly source refresh give decision-makers a balanced, transparent baseline they can trace to concrete drivers and replicate with ease.


Key Questions Answered in the Report
What is the current value of the United Kingdom data center construction market?
The market was valued at USD 2.25 billion in 2026 and is on track to reach USD 4.92 billion by 2031.
Which segment is growing fastest within new builds?
Tier 4 facilities, favored by financial services and healthcare firms, are projected to post a 17.32% CAGR through 2031.
Why are hyperscale projects moving north of London?
Grid connection moratoriums, lower land costs, and renewable power availability in Manchester and Scotland are drawing capital away from the congested South-East.
How is liquid cooling changing construction budgets?
Direct-to-chip and immersion solutions are shifting more capital into mechanical systems, which are forecast to grow at a 17.66% CAGR through 2031.
What regulatory reforms have had the biggest impact recently?
The Planning and Infrastructure Act 2025 and updated National Policy Statements in 2026 reclassified large data centers as nationally significant, trimming approval timelines and de-risking projects.
Page last updated on:


