Indonesia Data Center Construction Market Size and Share
Market Overview
| Study Period | 2020 - 2031 |
|---|---|
| Forecast Data Period | 2026 - 2031 |
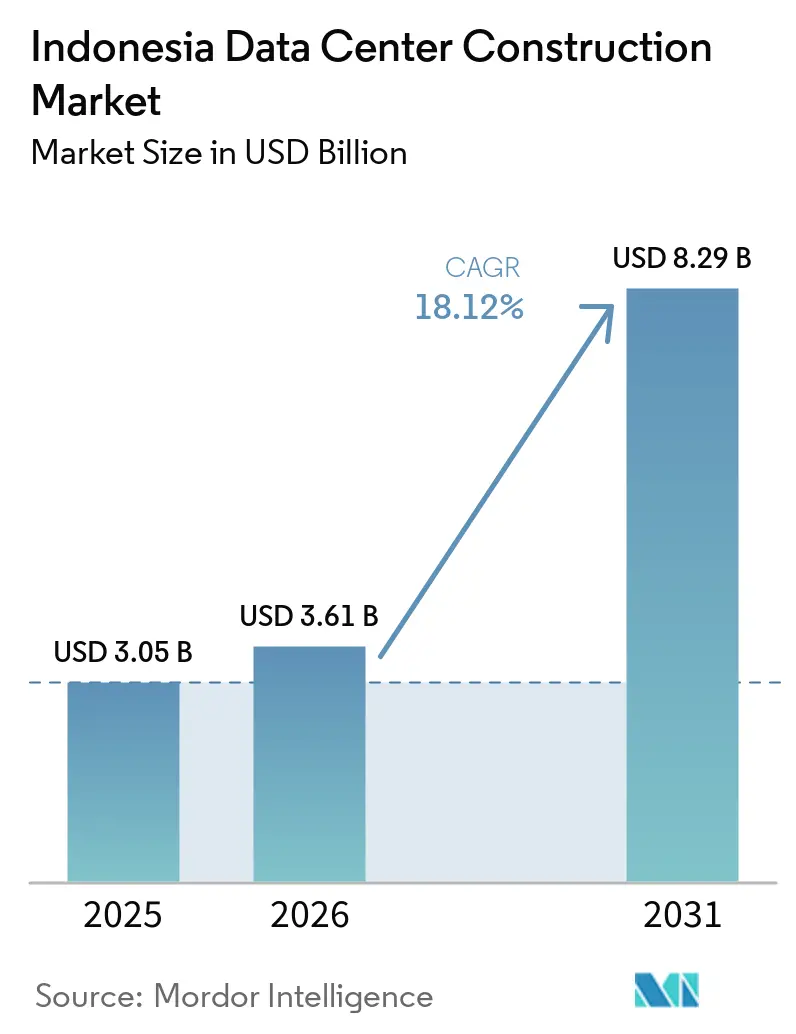
| Base Year Market Size (2025) | USD 3.05 Billion |
| Market Size (2026) | USD 3.61 Billion |
| Market Size (2031) | USD 8.29 Billion |
| Growth Rate (2026 - 2031) | 18.12% CAGR |
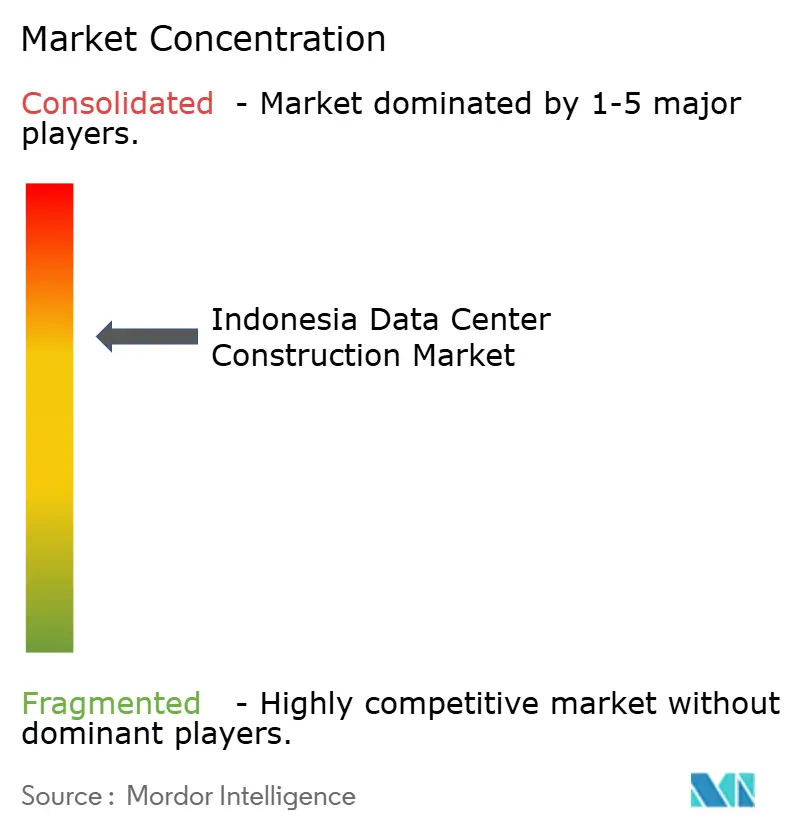
| Market Concentration | Medium |
Major Players
*Disclaimer: Major Players sorted in no particular order Image © Mordor Intelligence. Reuse requires attribution under CC BY 4.0. |
|
Indonesia Data Center Construction Market Analysis by Mordor Intelligence
The Indonesian data center construction market size in 2026 is estimated at USD 3.61 billion, growing from 2025 value of USD 3.05 billion with 2031 projections showing USD 8.29 billion, growing at 18.12% CAGR over 2026-2031. Rapid cloud adoption, an expanding digital consumer base of 280 million citizens, and firm government backing through the National Digital Indonesia Roadmap 2030 are the primary catalysts. New submarine cable landings in Jakarta and Batam, together with zoning incentives along the Jakarta-Bandung corridor, are shortening latency targets and unlocking land parcels suitable for hyperscale campuses. Renewable-power purchase agreements (PPAs) and green-tariff schemes are beginning to influence site selection as operators seek to mitigate exposure to Indonesia’s newly introduced carbon tax. On the supply side, specialised mechanical-electrical-plumbing (MEP) contractors and component vendors are racing to keep pace with artificial-intelligence (AI) workloads that demand 40-60 kW per rack.
Key Report Takeaways
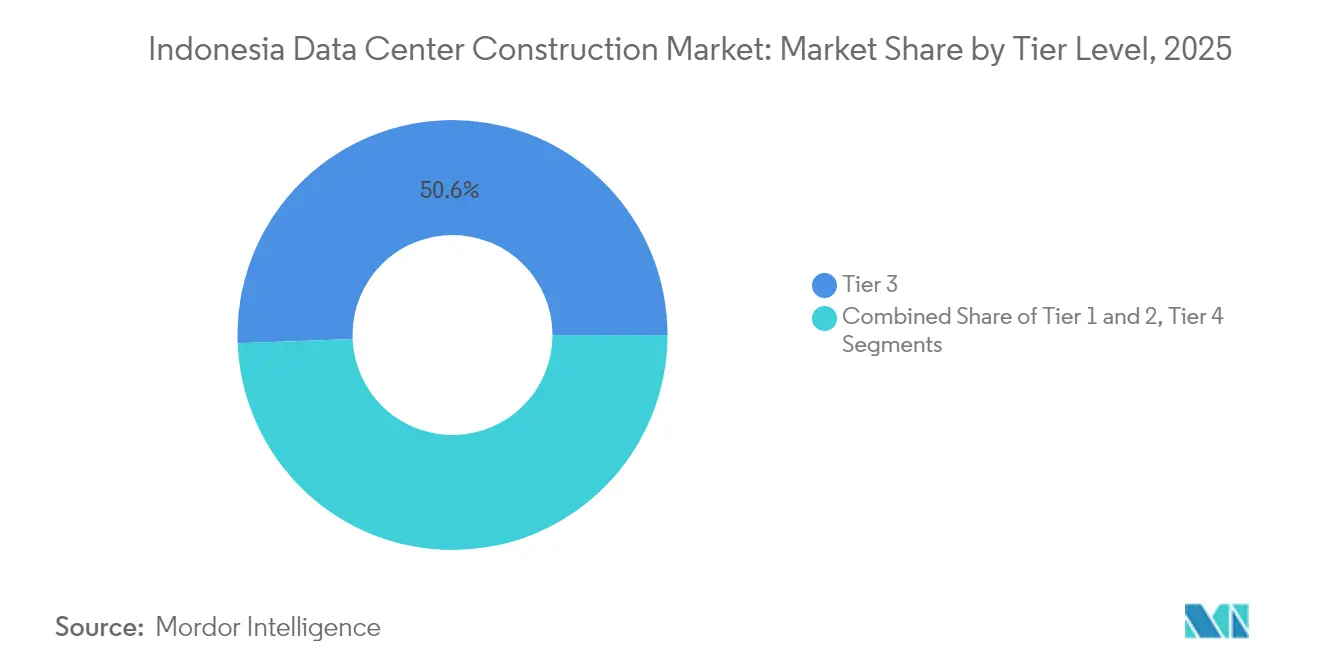
- By tier type, Tier 3 facilities captured 50.62% of the Indonesian data center construction market share in 2025, while Tier 4 builds are posting the fastest 18.6% CAGR to 2031.
- By data-center type, colocation services led with 56.72% revenue share in 2025; self-build hyperscalers are expanding at a 19.5% CAGR through 2031.
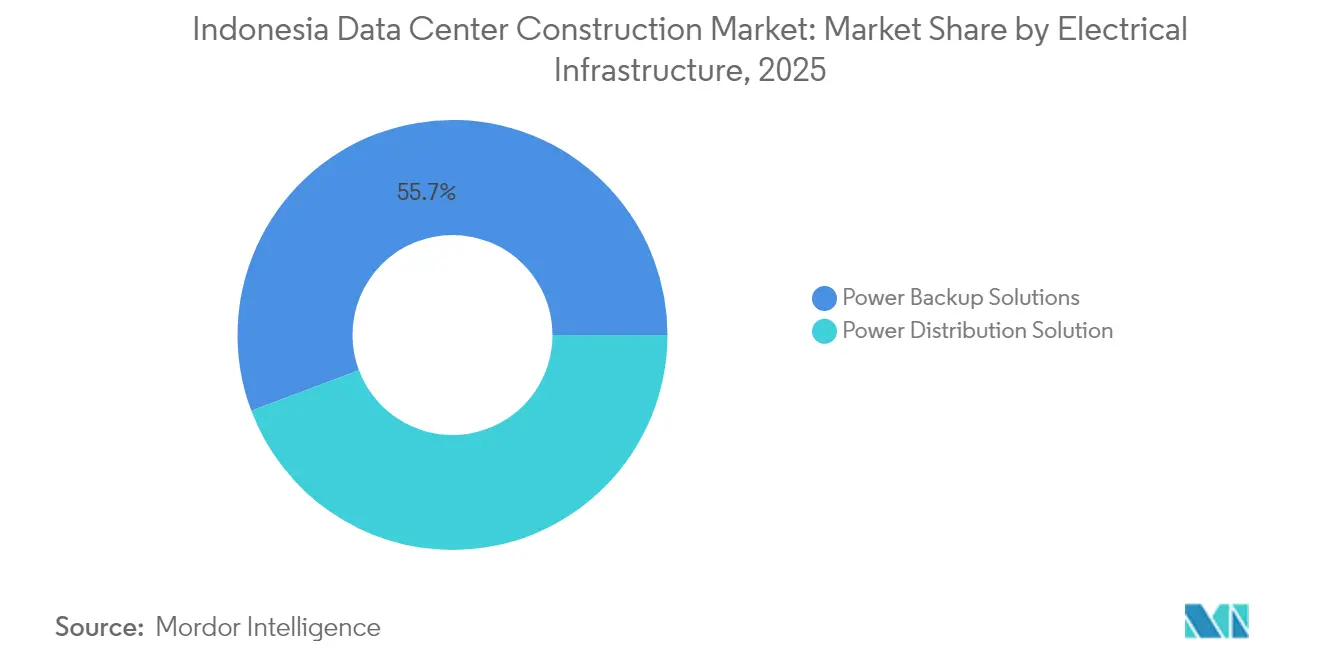
- By electrical infrastructure, power-backup solutions held 55.74% of the Indonesian data center construction market size in 2025, whereas power-distribution innovations are growing at 18.3% CAGR.
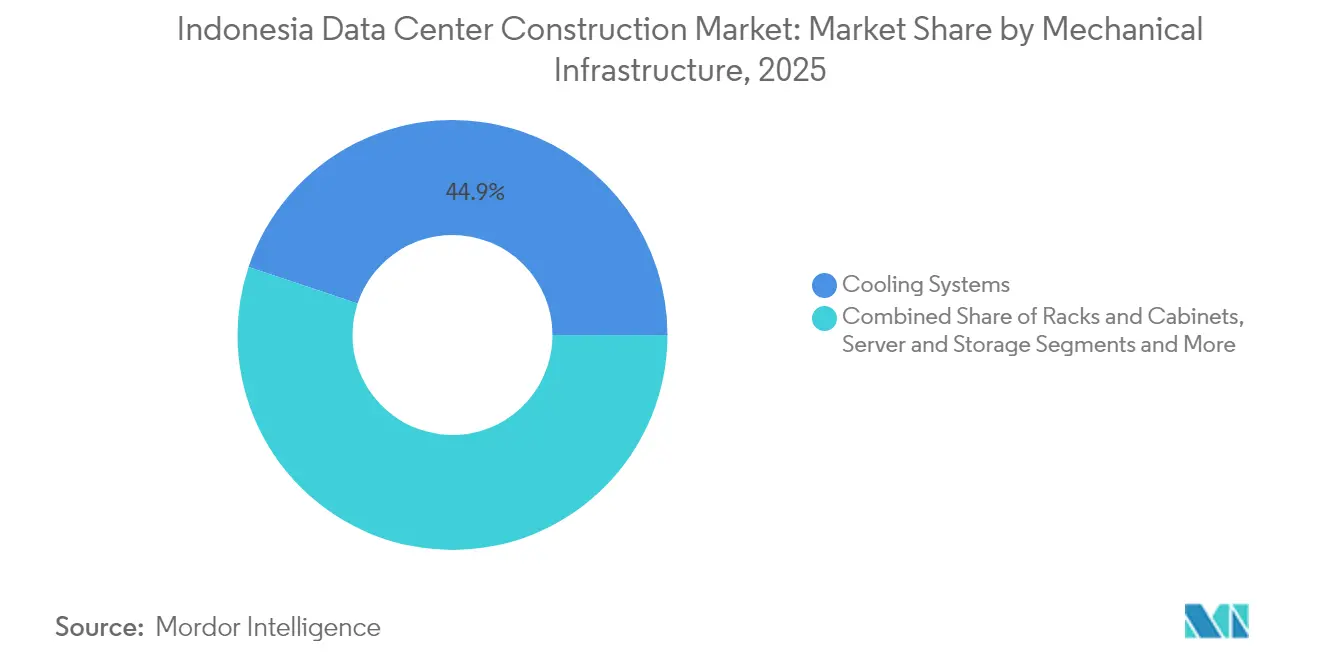
- By mechanical infrastructure, cooling systems accounted for a 44.88% share in 2025, and servers and storage are advancing at a 18.8% CAGR.
Note: Market size and forecast figures in this report are generated using Mordor Intelligence’s proprietary estimation framework, updated with the latest available data and insights as of 2026.
Indonesia Data Center Construction Market Trends and Insights
Drivers Impact Analysis*
| Driver | (~) % Impact on CAGR Forecast | Geographic Relevance | Impact Timeline |
|---|---|---|---|
| Cloud and AI-led hyperscale investments accelerate facility demand | +4.2% | Jakarta metro, Batam, Surabaya | Medium term (2-4 years) |
| National Digital Indonesia Roadmap 2030 spurs public-sector IT loads | +3.8% | National, concentrated in Jakarta–Cikarang–Batam | Long term (≥ 4 years) |
| New international subsea cables improve latency standards | +2.9% | Jakarta, Batam, with spill-over to Surabaya | Medium term (2-4 years) |
| Jakarta–Bandung corridor zoning incentives | +2.1% | West Java corridor | Short term (≤ 2 years) |
| Corporate PPAs and green tariffs for renewable power | +1.8% | National, early adoption in Jakarta | Long term (≥ 4 years) |
| Edge build-outs in Surabaya, Medan and Makassar | +1.6% | East Java, North Sumatra, South Sulawesi | Medium term (2-4 years) |
| Source: Mordor Intelligence | |||
Cloud and AI-Led Hyperscale Investments Accelerate Facility Demand
Hyperscale cloud firms are redefining the Indonesian data center construction market by introducing AI workloads that require liquid-cooling, 40-60 kW racks, and contiguous power blocks exceeding 50 MW per campus. Tencent’s USD 500 million commitment, Nvidia’s USD 200 million GPU center with Indosat Ooredoo Hutchison, and BDx’s 500 MW renewable-powered AI campus exemplify the scale of capital flowing into. Indonesia (AI) optimised data center is increasing demand for high-density infrastructure and advanced cooling technologies across hyperscale facilities. The need for immersion cooling and high-density electrical buses is stretching local contractors’ skill sets, prompting global engineering firms to form joint teams with domestic specialists. Construction schedules have tightened from an average 22 months in 2022 to 16-18 months in 2025 as land owners provide pre-approved permits and ready-built substations.[1]PT PLN (Persero), “Rencana Usaha Penyediaan Tenaga Listrik 2024–2033,” pln.co.id
National Digital Indonesia Roadmap 2030 Spurs Public-Sector IT Loads
The Roadmap mandates the consolidation of ministerial IT workloads into four National Data Centers (PDN). The flagship Cikarang PDN, financed at EUR 164.68 million (USD 189.59 million), delivers 25,000 processor cores and is scheduled to begin in August 2024.[2]Kementerian Komunikasi dan Informatika, “Percepatan Pembangunan Pusat Data Nasional,” kominfo.go.id Three additional PDN sites in Batam and Nusantara are in the pipeline, ensuring steady demand for Tier 4 builds over the next five years. Presidential Regulation 82/2023 requires agencies to migrate from legacy facilities, stimulating a surge of design-build contracts for secure cloud zones, zero-trust networks, and cyber-resilient plant rooms. The ramp-up has also catalysed INA DIGITAL, the new single window for public services that launched in May 2024, which now drives inter-ministerial bandwidth requirements well beyond earlier forecasts
New International Subsea Cables Landing in Jakarta and Batam Raise Latency Standards
The Nongsa-Changi and ALPHA cable systems will bring 24 and 8 fiber pairs, respectively, lifting lit capacity and enabling round-trip latencies under 20 ms to Singapore.[3]Telin, “Nongsa–Changi Submarine Cable System Fact Sheet,” telin.net Cable landing stations demand seismic-resistant buildings, redundant 24 × 7 power, and secure meet-me rooms—features that add 10-15% to base construction budgets yet enhance the investment thesis for adjacent data centers. NeutraDC’s 51 MW campus in Batam’s Kabil Integrated Industrial Estate capitalises on these new fibers, while Jakarta operators are clustering around the Ancol Landing Station to capture transit traffic.
Edge Build-Outs in Surabaya, Medan and Makassar to Serve Tier-2 Cities
Growth in e-commerce, fintech, and provincial e-government platforms is lifting near-user compute demand. Princeton Digital Group’s multi-city rollout and Telkom Indonesia’s regional clusters shorten latency to under 10 ms for East Java and North Sumatra users. Although average project sizes remain modest at 3-5 MW, unit economics are improving as operators deploy prefabricated modules and exploit existing fibre laid under the Palapa Ring backbone.
Restraints Impact Analysis*
| Restraint | (~) % Impact on CAGR Forecast | Geographic Relevance | Impact Timeline |
|---|---|---|---|
| Rising power-use and carbon-tax exposure | -2.8% | National, highest in Java | Short term (≤ 2 years) |
| Escalating land prices near Jakarta CBD and Cikarang | -2.1% | Greater Jakarta, West Java | Medium term (2-4 years) |
| Shortage of specialised MEP-certified labour | -1.9% | National, acute in Jakarta | Medium term (2-4 years) |
| Slow grid-upgrade cycle times at PLN substations | -1.4% | New industrial zones | Short term (≤ 2 years) |
| Source: Mordor Intelligence | |||
Rising Power-Use and Carbon-Tax Exposure
Indonesia’s carbon-tax regime took effect in 2022, applying levies on emissions that exceed sector caps. Because coal still supplies 67% of PLN’s generation mix, large campuses risk material cost over-runs unless they secure renewable PPAs or on-site solar. PLN’s roadmap to net-zero by 2060 adds future price uncertainty, driving operators toward real-time power monitoring, waste-heat reuse, and demand-response programmes. Early movers such as EDGE2 now pass carbon-neutral costs through to tenants, setting a precedent for premium pricing.
Escalating Land Prices Around Jakarta CBD and Cikarang Industrial Parks
Industrial land in Bekasi and Karawang rose by double digits in 2024 as data-center buyers absorbed 72% of the supply. A premium plot near prime fibre routes can command USD 350 per m², pushing operators to evaluate Batam, Solo, and Surabaya alternatives. Sinar Mas’s 8,516 m² Menteng Atas deal, worth IDR 4.6 trillion (USD 0.28 billion), illustrates the new pricing reality. Relocating to secondary zones, however, often necessitates added capex for extra fibre laterals and longer power feeders.
*Our forecasts treat driver/restraint impacts as directional, not additive. The impact forecasts reflect baseline growth, mix effects, and variable interactions.
Segment Analysis
By Tier Type: Tier 4 Drives Premium Growth
Tier 3 facilities account for 50.62% of the Indonesia data center construction market size, reflecting their balanced cost-to-availability ratio. Colocation providers such as NeutraDC rely on Tier 3 certifications to court enterprise tenants that demand 99.982% uptime while staying mindful of capex constraints. Tier 1 and Tier 2 sites continue to serve latency-sensitive edge nodes where modest redundancy is acceptable.
Tier 4 builds, advancing at 18.6% CAGR, are reshaping the Indonesia data center construction market as AI workloads and sovereign-cloud mandates eliminate tolerance for downtime. DCI Indonesia’s Tier IV edge facility in central Jakarta signals the march toward zero-fault architecture, with immersion cooling and compartmentalised power paths driving project costs 25-30% above Tier 3. STT GDC’s announced AI clusters will further entrench Tier 4’s position in future-ready designs.


By Data Center Type: Hyperscalers Reshape Market Dynamics
Colocation maintains 56.72% of 2025 revenue thanks to Indonesia’s fragmented enterprise base. Facilities such as Digital Edge’s 23 MW Jakarta site offer scalability through modular halls, securing multi-year anchor tenants that raise the utilisation curve faster than legacy carrier-hotels.
Self-build hyperscalers are registering a 19.5% CAGR, swelling the Indonesia data center construction market through 120-MW-plus campuses on 20-hectare plots. EdgeConneX’s USD 403.8 million sustainability-linked loan typifies how operators deploy green-bond structures to finance renewable-powered builds. The hyperscaler push is forcing colocation incumbents to pivot toward wholesale suites and build-to-suit models, blurring once-clear lines between multi-tenant and single-tenant strategies.
By Electrical Infrastructure: Power Distribution Innovation Accelerates
Power-backup systems—UPS arrays, diesel gensets, and battery-energy storage—held 55.74% of the Indonesian data center construction market share in 2025 because grid instability makes N+N redundancy non-negotiable. PLN’s commissioning of 41 new substations totalling 5,660 MVA in 2023 partly alleviates risk, yet operators still engineer black-start pathways and 48-hour fuel storage.
Demand for intelligent power distribution is growing at 18.3% CAGR as AI clusters swing between 10 kW and 60 kW per rack. Hitachi Energy’s digital substation pilot in East Java showcases real-time telemetry, enabling operators to shave peak loads and cut carbon-tax liabilities. The push toward software-defined power trains is fostering partnerships among switchgear OEMs, battery suppliers, and cloud analytics firms.
By Mechanical Infrastructure: Cooling Revolution Drives Server Growth
Cooling commanded 44.88% of mechanical spend in 2025. Operators are exhausting the limits of raised-floor air systems, turning to direct-to-chip liquid loops and immersion tanks that support 40-60 kW racks. Samsung C&T’s prototype underwater radiator and SMC’s HyperCube achieving <1.03 PUE signal rapid technology iteration.
Servers & storage components, growing at 18.8% CAGR, are the fastest-moving slice of the Indonesian data center construction market as AI accelerators multiply. Nortek’s StatePoint liquid-cooling integration at EDGE2 trimmed server-level energy draw by 20-30%, demonstrating how mechanical and IT-hardware decisions are converging into a single design-build scope.
Geography Analysis
The Indonesia data center construction market concentrates 69.78% of active capacity inside the Greater Jakarta conurbation, covering Jakarta, Bekasi, Cikarang, and Karawang. Jakarta’s colocation segment is projected to increase with hyperscalers occupying major of white space due to abundant fibre routes at facilities such as the Ancol Cable Landing Station. Clustering enables operators to pool skilled labour, share neutral meet-me rooms, and tap into PLN’s densest substation matrix.
Surabaya, Medan, and Makassar are tier-2 cities drawing targeted edge builds that keep latency below 20 ms for e-government and fintech transactions. Princeton Digital Group’s Surabaya deployment demonstrates how pre-fabricated 3-MW modules can be installed within nine months, a critical advantage in markets where backhaul capacity still lags Java’s backbone. Government fibre programmes under Palapa Ring have reduced connectivity barriers, yet thinner talent pools and smaller power blocks constrain the pace of hyperscale expansion.
Competitive Landscape
Competition in the Indonesian data center construction market divides into three strata. Global engineering consultancies—Aurecon, AECOM, Arup,and Jacobs secure complex hyperscale mandates by offering tier-4 ready designs, liquid-cooling expertise, and global procurement leverage. Domestic firms such as PT Arkonin and DSCO Group win government and mid-enterprise jobs through faster approvals and lower labour overheads. Technology infrastructure vendors Huawei, Schneider Electric, ABB, and Vertiv hold strong bargaining power by bundling long-term maintenance and modular power-train upgrades into their contracts.
Convergence is accelerating. Aurecon is partnering with Schneider Electric to deliver design-build-operate packages, while Hitachi Energy’s digital-substation alliance with PLN showcases how OEMs now co-invest in grid upgrades that unlock downstream project flow. White-space opportunity exists in specialised MEP for AI clusters and in sustainable construction, where carbon-negative concrete and recycled steel are under trial. Local integrators possessing regulatory insight are poised to disrupt traditional bid pools, especially in edge projects outside Java.
________________________________________
Indonesia Data Center Construction Industry Leaders
-
Aurecon Group Pty Ltd
-
PT AECOM Indonesia
-
Arup Group
-
Jacobs Engineering Group Inc.
-
Turner & Townsend
- *Disclaimer: Major Players sorted in no particular order

Recent Industry Developments
- January 2025: PT PLN (Persero) inaugurated 37 electricity projects across 18 provinces, totalling 3,222.75 MW and Rp 72 trillion, reinforcing grid headroom for future campuses.
- January 2025: New regulations strengthened Indonesia’s data-center framework, clarifying build standards and data-sovereignty obligations.
- December 2024: PT DCI Indonesia opened the 18 MW Tier IV E1 edge facility in central Jakarta.
- November 2024: Tencent pledged USD 500 million for local capacity expansion.


Research Methodology Framework and Report Scope
Market Definitions and Key Coverage
Our study defines the Indonesia data center construction market as the value of all new-build facilities and major upgrade projects that deliver powered shell, electrical, mechanical, and commissioning services necessary to house IT load across colocation, hyperscale, enterprise, and edge sites. Construction spending linked only to routine maintenance or purely interior fit-outs is excluded.
Scope exclusion: Stand-alone network cabling or software integration contracts that do not materially change building capacity are outside the market.
Segmentation Overview
-
By Tier Type
- Tier 1 and 2
- Tier 3
- Tier 4
-
By Data Center Type
- Colocation
- Self-build Hyperscalers (CSPs)
- Enterprise and Edge
-
By Infrastructure
-
By Electrical Infrastructure
-
Power Distribution Solution
- Power Distribution Solution
-
Power Backup Solutions
- Power Backup Solutions
-
Power Distribution Solution
-
By Mechanical Infrastructure
-
Cooling Systems
- Cooling Systems
-
Racks and Cabinets
- Racks and Cabinets
-
Servers and Storage
- Servers and Storage
-
Other Mechanical Infrastructure
- Other Mechanical Infrastructure
-
Cooling Systems
- General Construction
- Service - Design and Consulting, Integration, Support and Maintenance
-
By Electrical Infrastructure
Detailed Research Methodology and Data Validation
Primary Research
Analysts held structured calls with EPC contractors active in Jakarta-Bekasi clusters, design consultants in Batam, and procurement leads at three colocation operators. These interviews helped us stress-test average build cost per megawatt, realistic project lead times, and likely commissioning cadence across Tier III and Tier IV sites.
Desk Research
We began by downloading construction permit records and utility connection data from the Ministry of Public Works, PLN's annual power-capacity statistics, and Kominfo's Digital Indonesia Roadmap, which together frame demand and cost baselines. Trade association notes from the Southeast Asia Data Center Association, customs-level imports of HVAC and switchgear on Volza, and academic papers on tropical cooling from ASEAN Engineering Journals rounded the secondary stack. Company 10-Ks lodged with OJK, investor decks from listed contractors, and pay-wall sources such as D&B Hoovers and Dow Jones Factiva supplied unit economics, contract funnels, and tender pipelines. This list is illustrative; many other open and paid sources supported validation and clarifications during desk work.
Market-Sizing & Forecasting
A top-down reconstruction of annual construction outlays was modeled from recorded IT-load additions (MW) multiplied by blended cost per MW, which is adjusted for land price indices, imported equipment share, and local steel prices. Selective bottom-up checks, sampling supplier roll-ups and contractor billings, tempered totals before freeze. Key variables feeding the model include announced hyperscale pipeline (MW), PLN industrial tariff trajectory, Jakarta commercial land price index, average PUE-driven mechanical share, and rupiah-USD exchange movements. Multivariate regression linked these drivers to historical spend, while scenario analysis around power-grid upgrades provided upside and downside bands. Where bottom-up data were thin, gaps were bridged using contractor margin norms derived from primary interviews.
Data Validation & Update Cycle
Outputs move through variance checks against independent metrics, senior analyst review, and a pre-publication update. Mordor refreshes the model yearly and issues interim tweaks when material events, such as policy shifts and >50 MW project wins, occur.
Why Mordor's Indonesia Data Center Construction Baseline Commands Reliability
Published estimates frequently diverge because players choose different project scopes, currency bases, and refresh dates.
Key gap drivers in this market are whether refurbishment spend is counted, the share of self-built hyperscale campuses included, and how foreign-currency equipment imports are converted amid rupiah volatility. Mordor's disciplined scope alignment and annual refresh reduce these distortions, yielding a balanced baseline for planners.
Benchmark comparison
| Market Size | Anonymized source | Primary gap driver |
|---|---|---|
| USD 3.05 B | Mordor Intelligence | - |
| USD 2.60 B | Regional Consultancy A | excludes self-built hyperscale campuses; uses fixed 2023 FX rate |
| USD 2.39 B (2024) | Global Consultancy B | mixes minor facility upgrades with new builds; older cost-per-MW benchmarks |
| USD 1.13 B (2023) | Industry Association C | counts only Tier III public colocation sites; omits power infrastructure escalation |
In sum, our approach links hard construction data with forward drivers, is transparent on inclusions, and is reproducible, giving decision-makers a dependable, up-to-date starting point.


Key Questions Answered in the Report
What is the current value of the Indonesia data center construction market?
The Indonesia data center construction market size is USD 3.61 billion in 2026 and is projected to grow at an 18.12% CAGR to 2031.
Which tier classification is growing fastest?
Tier 4 facilities are expanding at 18.6% CAGR because AI and sovereign-cloud workloads demand maximum uptime.
Why is Batam becoming a popular data-center hub?
Special Economic Zone incentives, new Singapore-linked submarine cables, and 50-MW-plus campus announcements make Batam an attractive alternative to Jakarta.
How are operators addressing carbon-tax exposure?
Many pursue PLN green tariffs, sign renewable PPAs, or install on-site solar and advanced power-monitoring systems to cut emissions costs.
Page last updated on:


