Mainframe Market Size and Share
Market Overview
| Study Period | 2020 - 2031 |
|---|---|
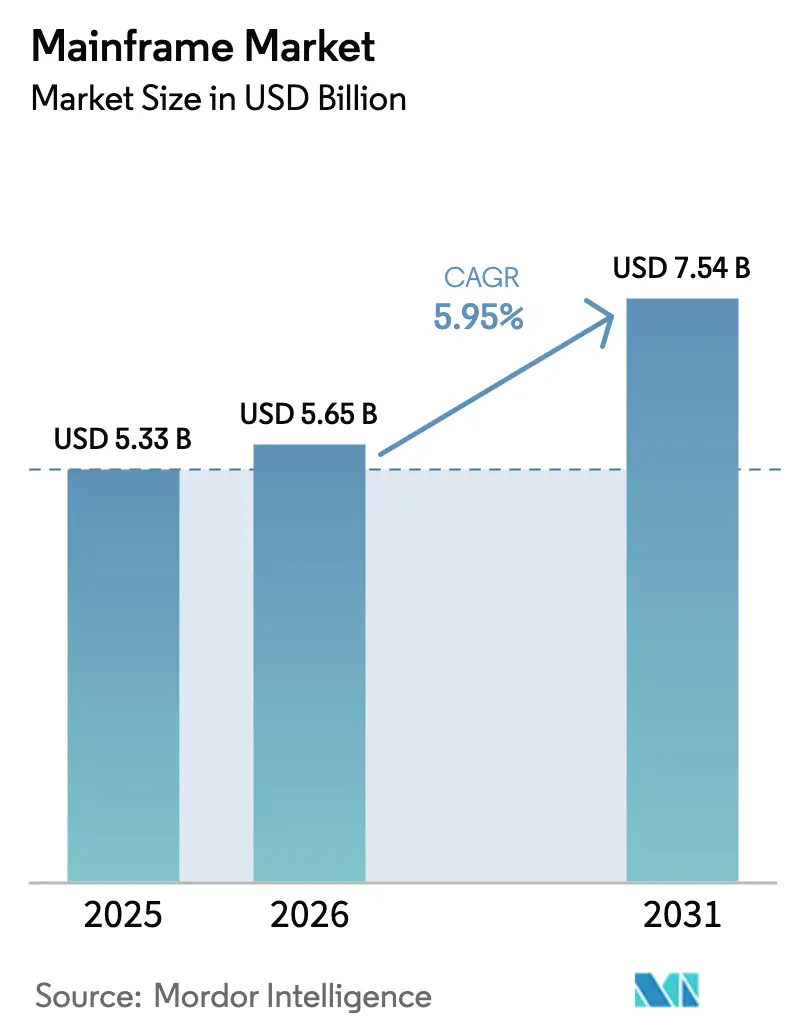
| Market Size (2026) | USD 5.65 Billion |
| Market Size (2031) | USD 7.54 Billion |
| Growth Rate (2026 - 2031) | 5.95% CAGR |
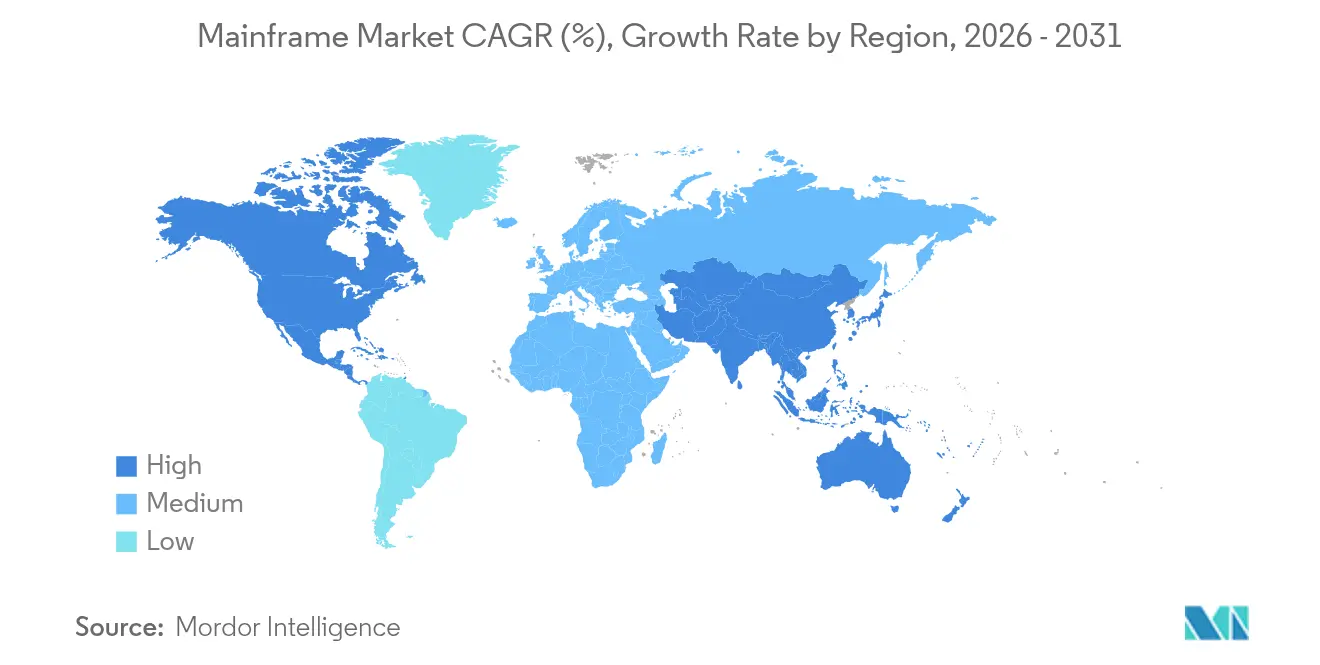
| Fastest Growing Market | Asia Pacific |
| Largest Market | North America |
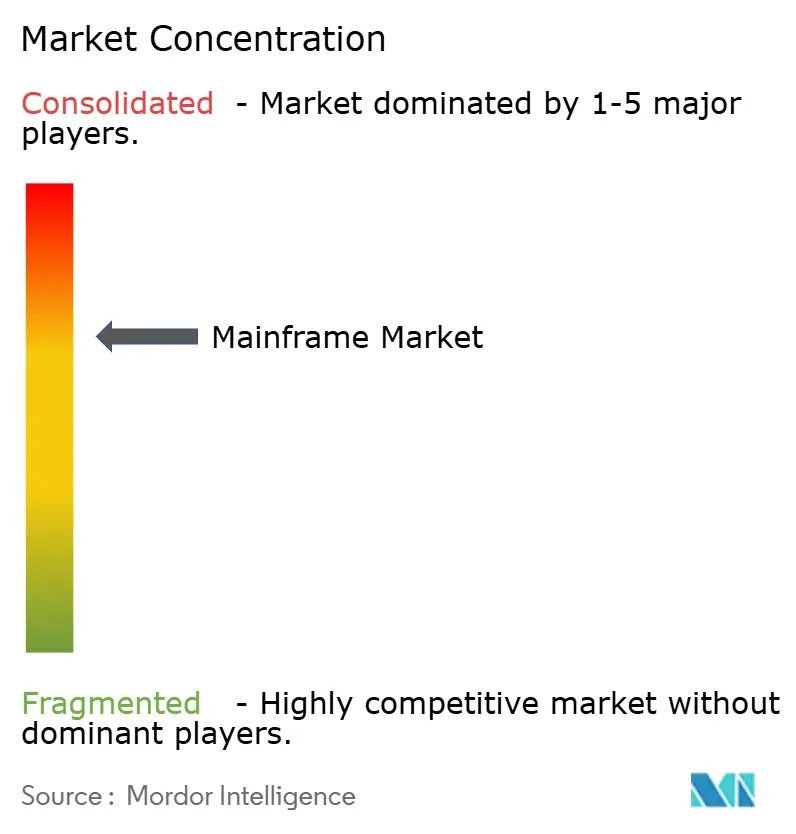
| Market Concentration | Medium |
Major Players *Disclaimer: Major Players sorted in no particular order Image © Mordor Intelligence. Reuse requires attribution under CC BY 4.0. | |
Mainframe Market Analysis by Mordor Intelligence
The mainframe market size was valued at USD 5.33 billion in 2025 and estimated to grow from USD 5.65 billion in 2026 to reach USD 7.54 billion by 2031, at a CAGR of 5.95% during the forecast period (2026-2031). Demand holds steady because large enterprises continue to rely on mainframes for real-time payment settlement, regulatory reporting and high-volume batch processing. The rollout of quantum-safe encryption on the z16 platform and the forthcoming z17 system strengthens the technology’s security proposition, while AI inference engines embedded on-chip reduce latency in fraud analytics. Hybrid cloud strategies keep existing mainframes in place yet surround them with cloud services for DevOps and test workloads. Asia Pacific is scaling fastest as banks and government agencies build sovereign-hosting facilities to satisfy local data rules and rising digital payment volumes.
Key Report Takeaways
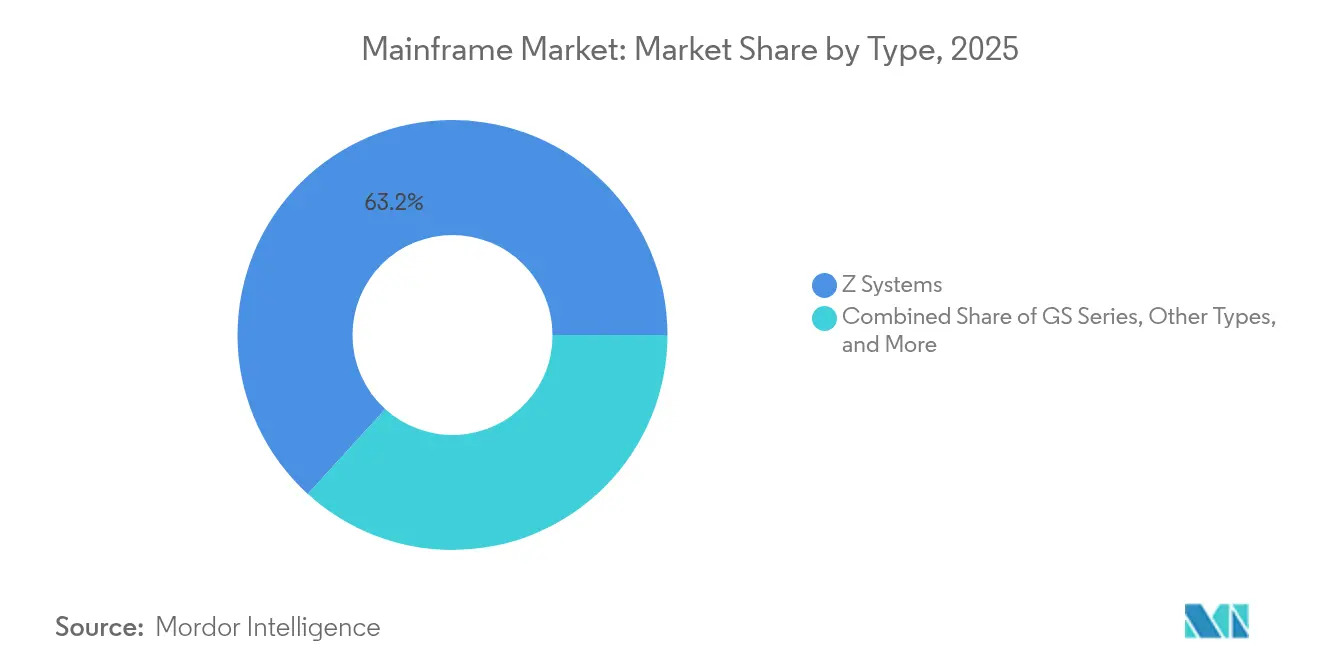
- By type, Z Systems led with 63.25% of mainframe market share in 2025, while GS Series is set to expand at a 10.12% CAGR to 2031.
- By offering, hardware commanded 47.35% share of the mainframe market size in 2025; services are growing at 9.08% CAGR through 2031.
- By deployment, on-premise installations held 70.20% of the mainframe market in 2025, whereas cloud-based Mainframe-as-a-Service is the fastest-rising model at 11.65% CAGR.
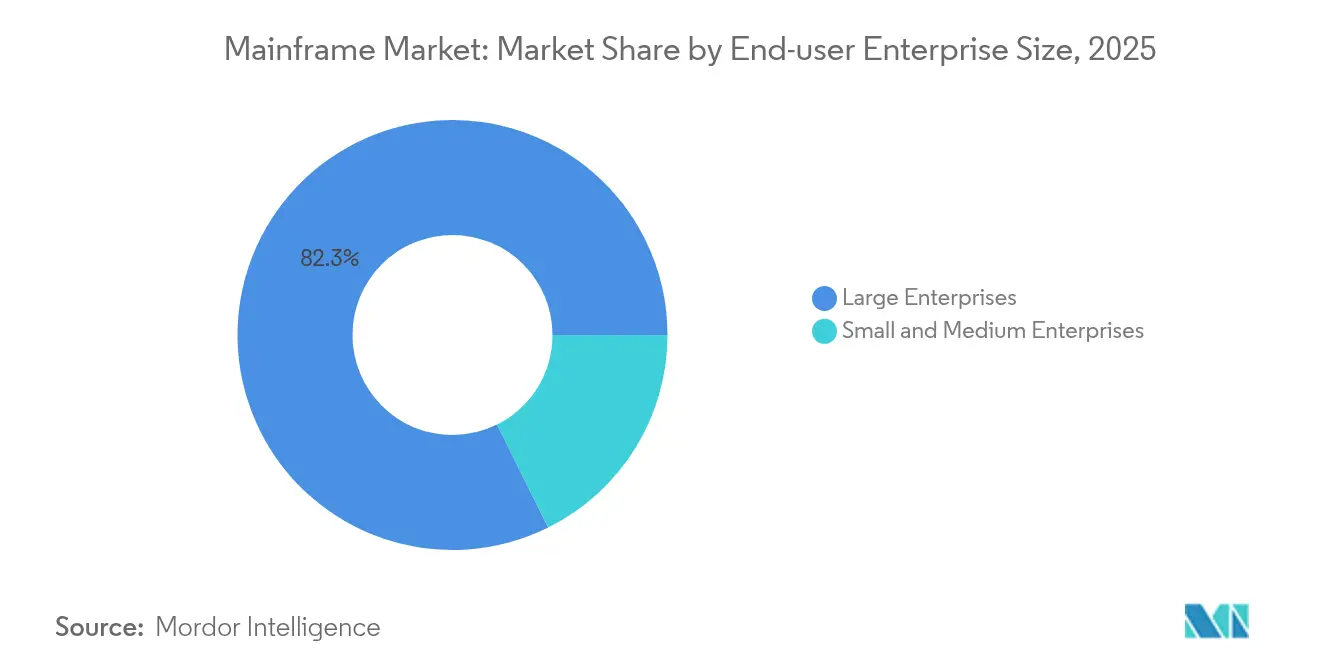
- By end-user enterprise size, large organizations controlled 82.34% of the mainframe market in 2025; the SME segment is expanding at an 8.47% CAGR.
- By end-user industry, BFSI captured 45.60% of the mainframe market share in 2025 and retail and e-commerce is advancing at an 10.55% CAGR to 2031.
- By geography, North America led with 40.55% revenue share in 2025, while Asia Pacific shows the highest growth at 9.35% CAGR.
Note: Market size and forecast figures in this report are generated using Mordor Intelligence’s proprietary estimation framework, updated with the latest available data and insights as of 2026.
Global Mainframe Market Trends and Insights
Drivers Impact Analysis*
| Driver | (~) % Impact on CAGR Forecast | Geographic Relevance | Impact Timeline |
|---|---|---|---|
| Modernization push for AI and Hybrid-Cloud workloads | +2.1% | Global, with stronger impact in North America and Europe | Medium term (2-4 years) |
| Exploding volume of real-time digital transactions | +1.8% | Global, with concentration in BFSI sector | Short term (≤ 2 years) |
| BFSI compliance requirements for zero-downtime compute | +1.3% | North America, Europe, developed Asia-Pacific | Medium term (2-4 years) |
| Rising demand for secure post-quantum cryptography engines | +0.9% | Global, with early adoption in North America and Europe | Long term (≥ 4 years) |
| Sovereign-hosting mandates in emerging economies | +0.7% | Asia-Pacific, Middle East, Latin America | Medium term (2-4 years) |
| Big Data and Analytics Growth | +0.5% | Global | Short term (≤ 2 years) |
| Source: Mordor Intelligence | |||
Modernization push for AI and hybrid-cloud workloads
AI models now run directly on mainframes, letting banks conduct fraud scoring on transactions without exporting data. An IBM survey found that 78% of IT leaders are embedding AI into mainframe applications [1]Tarquinio Tina, “AI Drives Mainframe Innovation,” IBM, ibm.com. The Telum II processor in the upcoming z17 can handle 50% more inference operations than its predecessor, supporting 450 billion inferences daily. Enterprises report operational efficiency gains near 20% after consolidating analytics next to transactional data. The approach shortens audit cycles and strengthens data governance. These benefits encourage firms to upgrade rather than retire existing frames, reinforcing the mainframe market.
Exploding volume of real-time digital transactions
Mainframes process 90% of global credit-card activity and sustain 1 million transactions each second [2]Stowell Meredith, “The Modern Mainframe: A Computing Powerhouse in the AI Era,” IBM, ibm.com. With B2B e-commerce projected to cross USD 20 trillion in 2027, throughput needs are ballooning. A Central European bank achieved 99.99% availability using a hybrid mainframe architecture, confirming resilience at scale. High availability makes mainframes cost-effective once transaction counts rise, which keeps them central to payment clearing and settlement houses. The unbroken uptick in digital commerce underpins long-term demand across the mainframe market.
BFSI compliance requirements for zero-downtime compute
Regulations such as the EU Digital Operational Resilience Act mandate strict uptime and auditability. Mainframes already underpin more than half of revenue-generating workloads at 67% of surveyed enterprises. Financial penalties for downtime are escalating, prompting banks to modernize on-platform rather than re-platform. Modern toolchains now expose REST APIs and DevOps pipelines, allowing quicker feature releases without compromising core security. As compliance intensity rises, risk-averse institutions deepen investment, lifting the mainframe market.
Rising demand for secure post-quantum cryptography engines
Threat actors are harvesting encrypted traffic now to decrypt later with quantum computers. IBM embedded post-quantum algorithms into its z16 and plans full quantum-safe capability in the z17 release. Financial regulators in North America urge early migration to quantum-safe methods. Enterprises therefore schedule firmware upgrades and key rotations that align with hardware refresh cycles. Early adopters lower long-term risk exposure and set benchmarks for audit readiness, increasing premium demand inside the mainframe market.
Restraints Impact Analysis*
| Restraint | (~) % Impact on CAGR Forecast | Geographic Relevance | Impact Timeline |
|---|---|---|---|
| Shortage of mainframe-skilled professionals | -1.2% | Global, with acute impact in North America and Europe | Medium term (2-4 years) |
| High TCO versus public-cloud x86 alternatives | -0.9% | Global, with stronger impact on SMEs | Short term (≤ 2 years) |
| Growing CIO preference for cloud-native green-compute pledges | -0.6% | North America, Europe | Medium term (2-4 years) |
| Limited Scalability Compared to Cloud | -0.4% | Global | Long term (≥ 4 years) |
| Source: Mordor Intelligence | |||
Shortage of mainframe-skilled professionals
Eighty-nine percent of enterprises call mainframes critical yet struggle to fill z/OS and COBOL roles [3]Van Pelt Allison, “The Mainframe Skills Gap,” Kyndryl, kyndryl.com. Retirement of seasoned staff could reach 30% by 2030, widening the talent gap. IBM, Broadcom and universities have formed the Mainframe Skills Council, training 440 new professionals via the Z Skills Depot. Service providers respond with automation that executes 10 million tasks daily on behalf of clients dxc.com. Still, labor scarcity pushes some workloads toward cloud substitutes, moderating growth in the mainframe market.
High TCO versus public-cloud x86 alternatives
Acquisition and licensing costs remain significant, especially for first-time buyers. IBM analysis shows that mainframes handle 72% of transactional work yet consume only 8% of IT budgets, but upfront capital acts as a barrier. Mainframe-as-a-Service offerings address the hurdle, growing 5% annually as firms rent capacity without purchasing hardware. SMEs still perceive a price gap versus x86 cloud, driving selective migration of non-core functions. Cost pressure therefore trims near-term expansion even as mission-critical loads persist on-premise.
*Our forecasts treat driver/restraint impacts as directional, not additive. The impact forecasts reflect baseline growth, mix effects, and variable interactions.
Segment Analysis
By Type: Z Systems Dominance Challenged by GS Growth
Z Systems held 63.25% of mainframe market share in 2025, reaffirming their role as the default for high-throughput banking and national government workloads. IBM’s z16 runs post-quantum encryption and delivers higher IOPS per watt, keeping the platform attractive for data-intensive use. The mainframe market size tied to GS Series is projected to climb at 10.12% CAGR thanks to a favorable price-performance mix that appeals to retailers and manufacturers.
GS Series customers leverage configurable cores and lower entry pricing to achieve sub-second response times for logistics planning. PCIe and Data Processing Unit enhancements spread across both families simplify hybrid cloud integration. Although niche legacy systems stay operational in some plants, modernization roadmaps increasingly converge on either Z Systems or GS Series, concentrating vendor focus and sharpening differentiation inside the mainframe market.


By Offering: Services Surge as Hardware Maintains Foundation
Hardware delivered 47.35% of the mainframe market size in 2025, reflecting continued refresh cycles as organizations install AI-ready chips. IBM allocated USD 30 billion to advance mainframe and quantum hardware production, signaling long-term commitment.
Services revenue is expanding 9.08% per year as enterprises outsource administration and modernization. DXC manages 1.1 million MIPS and applies robotic process automation to routine tasks, easing the skills shortage. Software remains vital for DevOps plugins and code conversion utilities that streamline cloud adjacency. These cross-layer upgrades keep the mainframe market positioned as a full-stack proposition rather than a hardware-only niche.
By Deployment: On-Premise Resilience Amid Cloud Acceleration
On-premise installations accounted for 70.20% of the mainframe market in 2025 due to regulatory control over physical assets in banking and defense. Sovereign-hosting legislation in the Middle East and Asia further reinforces local data residency, leading to fresh site builds with redundant power and cooling.
Cloud-based Mainframe-as-a-Service is rising at 11.65% CAGR as subscription packages cut capital outlay and shorten onboarding. Ninety-six percent of enterprises follow hybrid models, keeping 36% of workloads off-host while retaining mission-critical cores on the frame. Cloud toolchains attached through secure APIs enable rapid test cycles, creating a glide path for incremental modernization across the mainframe market.
By End-user Enterprise Size: Large Enterprises Lead as SMEs Accelerate
Large corporations produced 82.34% of 2025 revenue, reflecting transaction volumes that require sustained throughput and sub-second latency. For global banks, mainframes process half of annual revenue streams, cementing their strategic status.
SMEs are growing at an 8.47% CAGR, aided by pay-per-use models and simpler management consoles. Retailers and regional fintechs adopt tailored mainframe bundles that fit under tighter capital budgets. As cybersecurity threats intensify, smaller firms view quantum-safe encryption as a differentiator, pulling them into the mainframe market sooner than earlier cycles suggested.
By End-user Industry: BFSI Dominance Amid Retail’s Digital Acceleration
BFSI controlled 45.60% of the mainframe market in 2025. Eighty percent of banks plan to modernize existing COBOL code through AI-assisted refactoring rather than offload to x86, which lowers integration risk.
Retail and e-commerce activities are growing 10.55% annually. Flash sales and peak events drive compute spikes that mainframes absorb without capacity shortfalls. Government entities maintain citizen services on frames for pension, tax and defense systems, while healthcare uses them for claims processing and electronic health records. Manufacturing and telecom segments round out demand with supply chain scheduling and network inventory management, keeping the mainframe market diversified across sectors.
Geography Analysis
North America held 40.55% of the mainframe market in 2025, anchored by large payment networks and federal agencies. IBM’s USD 150 billion domestic investment over five years includes USD 30 billion aimed at mainframe hardware, guaranteeing supply chain depth and next-generation Research and Development. Regulatory clarity around quantum-safe standards draws continued platform spending in financial services and government.
Asia Pacific is the fastest-growing region at 9.35% CAGR through 2031. Japanese megabanks upgrade to z16 platforms while Australian superannuation funds integrate mainframe datasets with public cloud analytics. India’s digital public infrastructure roadmap and Indonesian open-banking rules both amplify transaction counts, expanding the addressable mainframe market size across emerging economies. Sovereign-hosting mandates in Saudi Arabia and the wider Gulf Cooperation Council spur fresh data-center builds with on-site mainframes to meet residency laws.
Europe posts steady renewals despite macro-economic headwinds. Banks in Germany and the Nordics migrate to hybrid frameworks that interlink z/OS applications with Kubernetes clusters. A 28% skills gap drives reliance on managed service providers headquartered in France, Spain and the UK. The continent’s push for green compute favors energy-efficient chips, prompting users to trade older frames for z16 models that consume less power per transaction.

Competitive Landscape
IBM remains the anchor vendor, shipping z Systems and LinuxONE lines and embedding quantum-safe cryptography. Its multiyear spending plan reinforces supply resilience and shows intent to merge AI inference engines with transaction pipelines. Broadcom deepens ecosystem ties through no-cost Enterprise Support for Zowe that eases DevOps on the frame.
Kyndryl, DXC Technology and Atos expand managed services portfolios to fill skills gaps. DXC automates 10 million mainframe tasks daily, freeing staff for modernization projects. Rocket Software releases code inspection tools that convert legacy programs into cloud-native libraries with minimal rework.
Hyperscale clouds add competitive tension. Microsoft, AWS and Google position refactoring suites that replicate workload patterns on x86 while partnering with IBM for hybrid orchestration. Security, latency and compliance needs nonetheless keep core workloads on the frame, ensuring sustained demand and stable pricing inside the mainframe market.
Mainframe Industry Leaders
IBM Corporation
Fujitsu Limited
BMC Software
Unisys Corporation
Broadcom Inc.
- *Disclaimer: Major Players sorted in no particular order

Recent Industry Developments
- April 2025: IBM announced the forthcoming z17 mainframe with Telum II processor and full quantum-safe capabilities.
- April 2025: IBM committed USD 150 billion to U.S. operations, earmarking USD 30 billion for mainframe and quantum hardware.
- March 2025: Kyndryl and Google Cloud launched the Mainframe Modernization with Gen AI Accelerator Program to simplify application migration.
- January 2025: BMC updated its AMI portfolio, adding AI features that automate performance tuning and workload balancing.


Research Methodology Framework and Report Scope
Market Definitions and Key Coverage
Our study defines the mainframe market as newly shipped, high-performance computer systems built around symmetrical multiprocessing and secure logical partitioning that sustain mission-critical transaction loads for banking, public-sector, and large-retail datacenters. The value measured covers the core chassis, native operating system, and bundled firmware sold at first installation.
Scope exclusion: Services for legacy modernization, mid-range servers, and x86 virtualization appliances are outside the present scope.
Segmentation Overview
- By Type
- Z Systems
- GS Series
- Other Types
- By Offering
- Hardware
- Software
- Services
- By Deployment
- Cloud
- On-Premise
- Hybrid
- By End-user Enterprise Size
- Small and Medium Enterprises
- Large Enterprises
- By End-user Industry
- BFSI
- IT and Telecom
- Government and Public Sector
- Retail and E-commerce
- Healthcare
- Manufacturing
- Other End-user Industries
- By Geography
- North America
- United States
- Canada
- Mexico
- South America
- Brazil
- Argentina
- Rest of South America
- Europe
- Germany
- United Kingdom
- France
- Italy
- Spain
- Russia
- Rest of Europe
- Asia-Pacific
- China
- Japan
- India
- South Korea
- Australia and New Zealand
- Rest of Asia-Pacific
- Middle East and Africa
- Middle East
- Saudi Arabia
- United Arab Emirates
- Turkey
- Rest of Middle East
- Africa
- South Africa
- Nigeria
- Egypt
- Rest of Africa
- Middle East
- North America
Detailed Research Methodology and Data Validation
Primary Research
Mordor analysts interviewed mainframe solution architects, procurement heads at tier-one banks, and regional system integrators across North America, Europe, and Asia Pacific. The conversations validated shipment estimates, average selling prices, and emerging MaaS subscription ratios, then filled gaps on retirement cycles and upgrade triggers.
Desk Research
We started with public sources such as the United States Census trade data, Japan's Information-technology Promotion Agency, the European Banking Authority statistics, and global customs records that track hardware flows. Industry portals like SHARE Inc. and peer-reviewed IEEE journals provided workload trends, while company 10-Ks and investor decks clarified segment revenues. Select paid datasets, notably D&B Hoovers for vendor financial splits and Dow Jones Factiva for deal news, anchored supply-side signals. These examples are illustrative; many other repositories informed our desk work.
Market-Sizing & Forecasting
A top-down model converts manufacturer revenue and export-import statistics into unit shipments, which are then multiplied by calibrated ASPs. Select bottom-up checks, sampled installed-base audits and channel stock reviews, anchor the totals before adjustments. Key variables include quarterly MIPS shipped, share of MaaS contracts, regional digital-payment volumes, BFSI compliance spend, and cloud migration rates. Forecasts employ multivariate regression blended with scenario analysis; equation coefficients are stress-tested with primary-research consensus to keep long-range drift in check. Where bottom-up gaps emerge, interpolation follows nearest verified benchmarks rather than assumption-only fillers.
Data Validation & Update Cycle
Outputs pass anomaly filters, variance checks against independent capacity indicators, and a two-step analyst peer review. The dataset refreshes each year, with interim updates triggered by material vendor launches or regulatory shifts, ensuring clients always receive the latest viewpoint.
Why Mordor's Mainframe Baseline Commands Reliability
Published figures often diverge because firms select different service scopes, price deflators, and refresh cadences. By anchoring to physical system shipments and verified ASPs before layering modernization revenues, Mordor minimizes hidden double counts.
Key gap drivers include: some studies fold modernization services entirely into hardware value, others ignore MaaS subscriptions, several apply static currency rates, and many refresh less frequently than Mordor's annual cadence.
Benchmark comparison
| Market Size | Anonymized source | Primary gap driver |
|---|---|---|
| USD 5.33 B (2025) | Mordor Intelligence | - |
| USD 8.39 B (2025) | Global Consultancy A | Combines modernization services and support contracts with hardware totals |
| USD 3.61 B (2025) | Trade Journal B | Counts only physical chassis sales, excludes MaaS and upgrade licenses |
| USD 2.70 B (2024) | Industry Data Firm C | Uses limited vendor sample and single-year average exchange rates |
In sum, Mordor's disciplined scope selection, dual-path modeling, and yearly updates provide a balanced, transparent baseline that decision-makers can trace back to observable variables and replicate with confidence.


Key Questions Answered in the Report
What is the projected growth rate for the mainframe market between 2026 and 2031?
The market is forecast to expand at a 5.95% CAGR, reaching USD 7.54 billion in 2031.
Which region will grow fastest in the mainframe market over the forecast period?
Asia Pacific is projected to advance at a 9.35% CAGR as banks and governments invest in sovereign-hosting facilities.
Why are organizations keeping mainframes instead of moving fully to cloud?
Mainframes deliver unmatched transaction throughput, quantum-safe security and 99.99% availability, which remain hard to replicate on commodity cloud infrastructure.
How are skills shortages being addressed in mainframe operations?
Vendors and universities run targeted training, while service providers like DXC and Kyndryl automate routine tasks and offer managed mainframe services.
What role does post-quantum cryptography play in mainframe upgrades?
New z-series models integrate quantum-safe algorithms, allowing enterprises to protect data against future quantum-enabled decryption threats.
Can small and medium enterprises afford mainframe capabilities?
Yes, Mainframe-as-a-Service subscriptions let SMEs rent secure compute capacity without large upfront hardware purchases, supporting use cases such as retail payment peaks and fintech compliance.
Page last updated on:


