Livestock Insurance Market Size and Share
Market Overview
| Study Period | 2020 - 2031 |
|---|---|
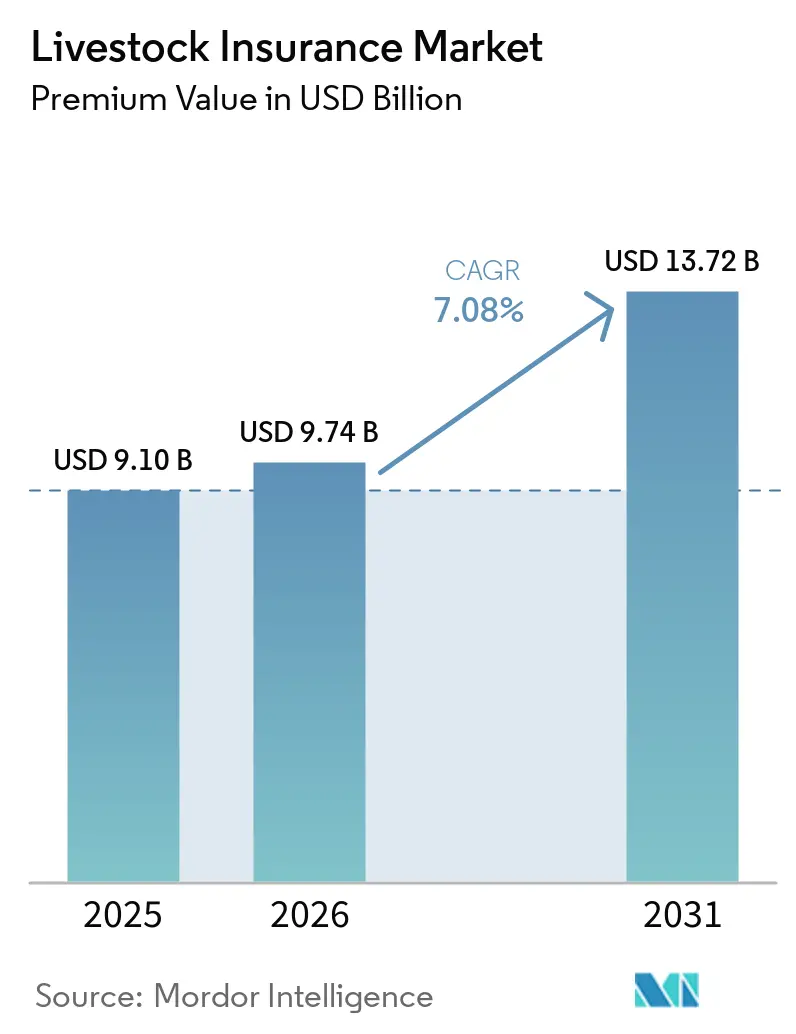
| Market Size (2026) | USD 9.74 Billion |
| Market Size (2031) | USD 13.72 Billion |
| Growth Rate (2026 - 2031) | 7.08% CAGR |
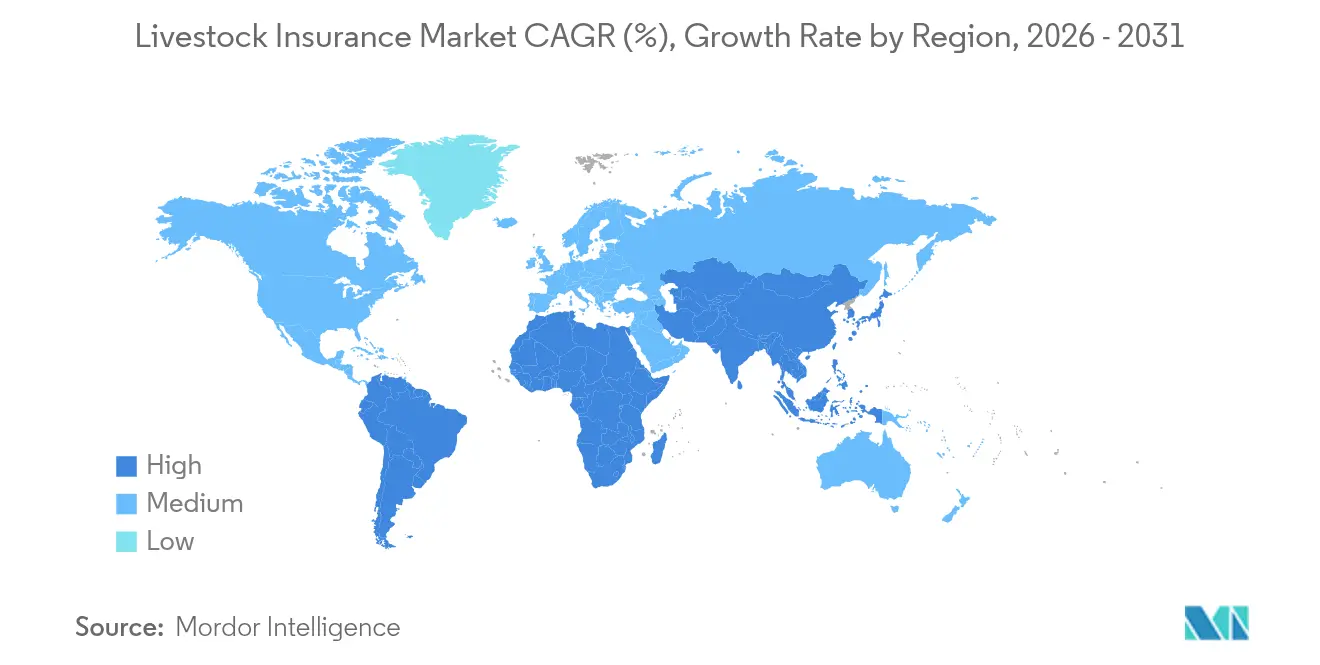
| Fastest Growing Market | Asia Pacific |
| Largest Market | Asia Pacific |
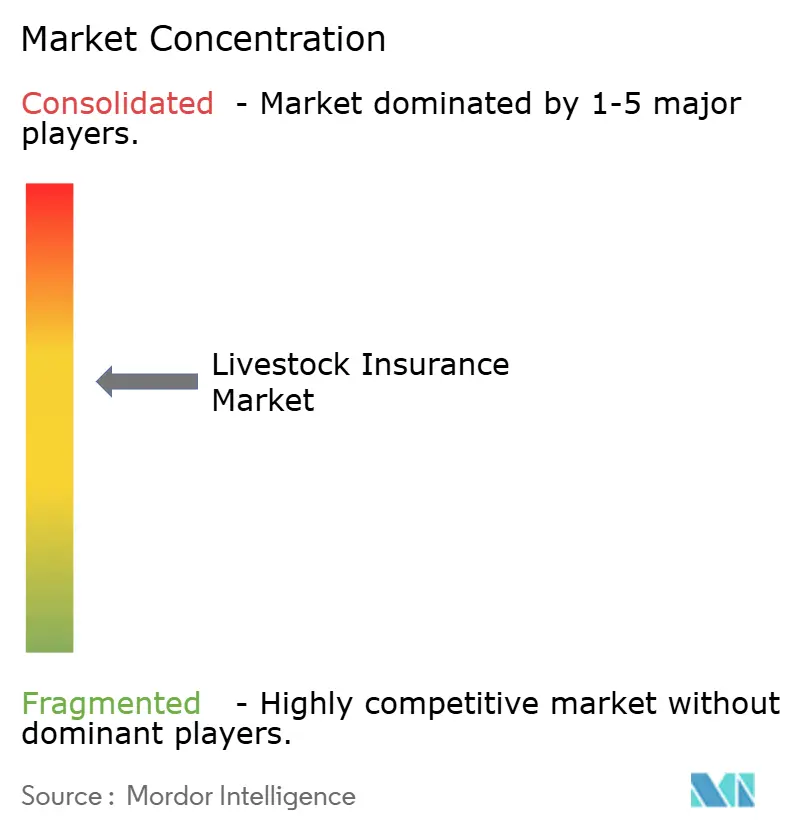
| Market Concentration | Medium |
Major Players *Disclaimer: Major Players sorted in no particular order Image © Mordor Intelligence. Reuse requires attribution under CC BY 4.0. | |
Livestock Insurance Market Analysis by Mordor Intelligence
The Livestock Insurance Market size in terms of premium value is expected to increase from USD 9.10 billion in 2025 to USD 9.74 billion in 2026 and reach USD 13.72 billion by 2031, growing at a CAGR of 7.08% over 2026-2031.
Rapid digitalization, climate-linked product innovation, and strong policy support are reshaping how insurers underwrite livestock risks. Advanced solutions, ranging from parametric covers that rely on satellite indices to blockchain-enabled fraud controls, are displacing traditional mortality-only products. Asia-Pacific commands the largest regional position, largely due to China and India’s vast animal inventories. Commercial mortality remains the dominant coverage type as corporatized farms safeguard valuable breeding stock and production herds. Meanwhile, embedded insurance platforms are scaling quickly by piggybacking on agriculture lending and supply-chain portals. Demand is also being reshaped by acute climate events; United States producers alone booked USD 20.3 billion in weather-related farm losses during 2024, yet only 53% were indemnified by crop insurance, underscoring a protection gap now spilling into animal lines.
Key Report Takeaways
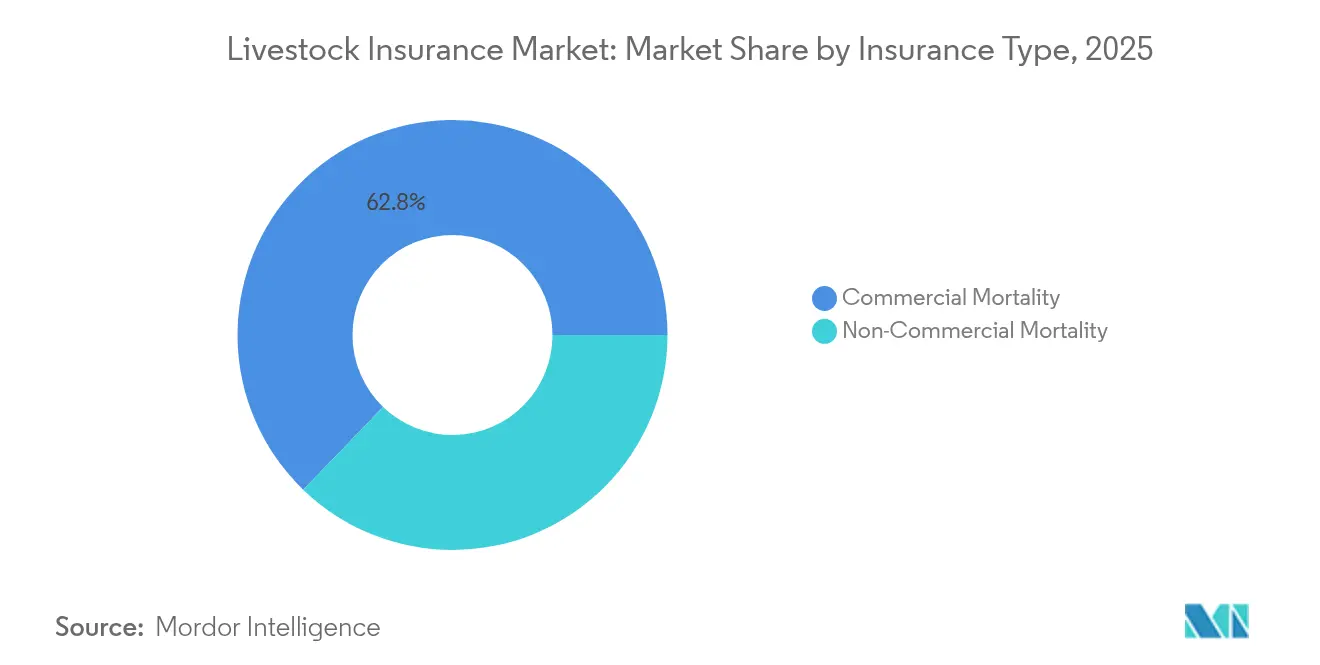
- By product type, commercial mortality led with 62.78% of livestock insurance market share in 2025, while non-commercial mortality is projected to expand at an 8.25% CAGR to 2031.
- By application, dairy cattle accounted for 30.56% of the livestock insurance market size in 2025; aquaculture is advancing at an 8.05% CAGR through 2031.
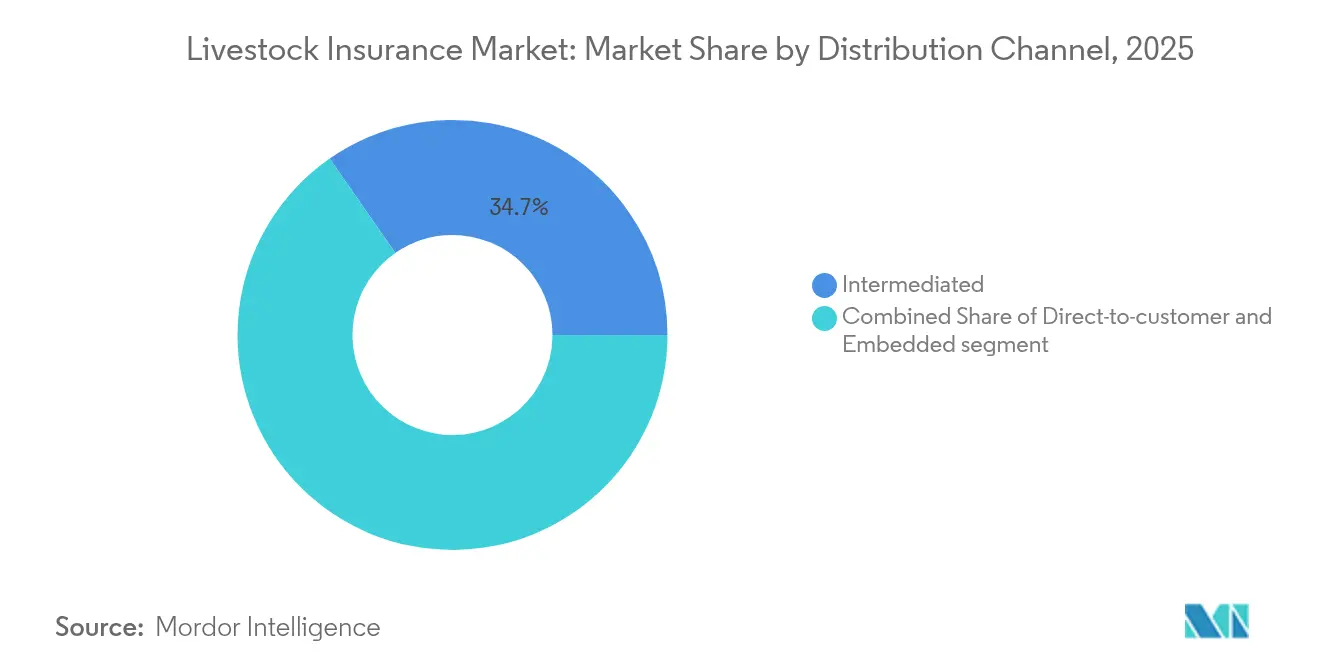
- By distribution channel, the intermediate model held 34.68% revenue share in 2025, whereas embedded distribution is the fastest growing at 6.43% CAGR.
- By geography, Asia-Pacific captured 27.14% of premium in 2025 and is forecast to grow at 7.04% CAGR to 2031.
Note: Market size and forecast figures in this report are generated using Mordor Intelligence’s proprietary estimation framework, updated with the latest available data and insights as of 2026.
Global Livestock Insurance Market Trends and Insights
Drivers Impact Analysis*
| Driver | ( ~ ) % Impact on CAGR Forecast | Geographic Relevance | Impact Timeline |
|---|---|---|---|
| Rising demand for animal-derived protein | +1.8% | Asia-Pacific and Latin America | Medium term (2–4 years) |
| Government subsidies & support programs | +1.5% | North America, Europe, Asia-Pacific | Short term (≤ 2 years) |
| Climatic risk & disease outbreak exposure | +2.1% | Global | Long term (≥ 4 years) |
| Parametric covers enabled by satellite/IoT | +1.3% | North America, Europe, Asia-Pacific | Medium term (2–4 years) |
| Blockchain-based fraud mitigation | +0.7% | Early adopters in North America and Europe | Long term (≥ 4 years) |
| Mobile micro-insurance platforms | +0.9% | Asia-Pacific, Sub-Saharan Africa, Latin America | Short term (≤ 2 years) |
| Source: Mordor Intelligence | |||
Rising demand for animal-derived protein
Global shifts in dietary habits are amplifying herd sizes and boosting insured asset values. The Asia-Pacific animal health market alone is growing rapidly, signalling robust downstream insurance demand[1]Khalid Asiry, “Livestock and Feed Efficiency Under Water Scarcity,” Frontiers in Sustainable Food Systems, frontiersin.org . Large integrated producers now bundle mortality, disease, and business-interruption covers within financing agreements, ensuring uninterrupted cash flows despite biological shocks. Capacity expansions in Saudi Arabia and Indonesia illustrate how intensification necessitates higher per-animal sums insured. As processors and retailers require biosecurity certifications, insurance becomes integral to supply-chain continuity. The livestock insurance market, therefore, grows in tandem with protein consumption as financiers insist on comprehensive risk transfer.
Government subsidies accelerate market penetration
Public support trims premiums and elevates awareness among smaller producers. U.S. livestock policy subsidies expanded from USD 3.8 million in 2018 to USD 411.3 million in 2023, driving a six-fold jump in policies[2]U.S. Government Accountability Office, “Agricultural Insurance Subsidy Trends 2018-2023,” gao.gov. China’s “insurance + futures” model stabilises farm income by pairing indemnities with commodity hedges. Similar frameworks emerge in Kenya and Mexico, where multilateral funds co-finance indices that unlock bank credit. Subsidies also mandate weather and disease data collection, enriching actuarial pools and enabling fairer pricing over time. As farmers witness faster payouts and lower deductibles, renewal rates strengthen, and premium retention improves for carriers.
Climatic risk exposure intensifies coverage requirements
Extreme weather and pathogenic events are rewriting loss curves. Canadian insurers incurred USD 6.29 billion in weather claims in 2024, dwarfing previous decades. Floods in Queensland wiped out more than 100,000 head, while rising sea temperatures killed 57.8 million salmon in Norway. Such shocks drive uptake of multi-trigger policies combining parametric heat, flood, and disease protection. Reinsurers respond by expanding catastrophe bonds that reference livestock mortality indices, injecting alternative capital into the livestock insurance market. Regulators in Australia and Brazil now encourage climate-risk disclosures, nudging producers to evidence insurance as part of resilience planning.
Parametric technology transforms risk assessment
High-resolution earth-observation feeds, IoT collars, and automated weather stations allow underwriters to price risk daily. Milkshake™ pays U.S. dairies within 72 hours when heat indices breach thresholds, bypassing traditional loss adjustment. Pasture.io’s 3 m² imagery informs both grazing decisions and actuarial models, shrinking basis risk for drought covers[3]Pasture.io, “High-Resolution Pasture Monitoring,” pasture.io. Satellite-verified stocking rates also underpin loan covenants, enabling banks to flex credit lines in real time. As data granularity rises, insurers differentiate on analytics rather than pure capacity, shifting competition toward technology partnerships. Wider adoption in Vietnam and Chile suggests the model is scaling beyond early adopter markets.
Restraints Impact Analysis*
| Restraint | ( ~ ) % Impact on CAGR Forecast | Geographic Relevance | Impact Timeline |
|---|---|---|---|
| Low farmer awareness & literacy | –1.2% | Sub-Saharan Africa, South Asia | Long term (≥ 4 years) |
| High premiums & actuarial-data gaps | –0.9% | Emerging markets globally | Medium term (2–4 years) |
| Cultural resistance to data sharing | –0.6% | Pastoral regions | Long term (≥ 4 years) |
| Re-insurance capacity tightening | –0.8% | Global | Short term (≤ 2 years) |
| Source: Mordor Intelligence | |||
Low farmer awareness constrains market expansion
Informal coping mechanisms and distrust in insurers dampen uptake. India’s fisheries remain largely uninsured despite escalating cyclone damage because producers view premium payments as sunk costs. Nepal shows similar patterns, where only 4% of eligible farmers participate in subsidized schemes. Limited mobile connectivity further impedes digital enrollment in many African rangelands. To counteract this, cooperatives now deploy peer educators and vernacular radio campaigns to demonstrate claim settlements. Improved transparency gradually converts sceptical households, but literacy gaps will weigh on the livestock insurance market for several years
High premiums limit smallholder access
Sparse loss data compels conservative rating, leaving many producers priced out. Cattle cover can cost 5.8% of an animal’s value, while goats often exceed 12%, straining margins already compressed by feed inflation. Reinsurers charge extra loadings for regions with limited historical datasets, pushing primary rates even higher. Aquaculture faces the steepest tariffs due to volatile disease patterns and asset concentration. Emerging blockchain-based mortality registries may eventually cut uncertainty and soften rates, yet for now, premium sticker-shock keeps penetration below potential across the livestock insurance market.
*Our forecasts treat driver/restraint impacts as directional, not additive. The impact forecasts reflect baseline growth, mix effects, and variable interactions.
Segment Analysis
By Type: Commercial Mortality Retains Leadership While Non-Commercial Gains Traction
Commercial mortality products generated 62.78% of the livestock insurance market share in 2025, anchoring the sector’s premium pool. Large corporate dairies, feedlots, and breeder operations willingly absorb premiums to protect multi-million-dollar herds and favor bespoke terms covering mortality, disease, and business interruption. Tied-agent networks embedded within ag lenders reinforce volume inflows from this cohort, and many contracts now link coverage limits to real-time herd valuations sourced from blockchain registries. Reinsurers have responded by creating quota-share treaties that reward carriers for deploying IoT-based monitoring, thereby lowering loss-adjustment expenses and improving combined ratios.
Non-commercial mortality is the fastest climber at an 8.25% CAGR through 2031 as subsidies and mobile distribution shrink cost hurdles for family farms. Digital platforms bundle micro-loans, veterinary advice, and flexible monthly premiums, turning previously informal producers into policyholders. iFarmer’s alliance with Provati Insurance in Bangladesh illustrates how fintech can accelerate grassroots reach. As more governments mandate proof of coverage for concessional credit, policy counts grow even in remote districts. While commercial lines will keep dominating absolute dollars, non-commercial head-count expansion widens overall livestock insurance market penetration and offers carriers a diversified risk book that balances high-value single-site exposures with geographically dispersed smallholder portfolios.


By Application: Dairy Dominance Meets Aquaculture Upswing
Dairy cattle still anchor the application mix with 30.56% of the 2025 premium, reflecting decades of insurance-friendly management and lender requirements. Heat-stress parametric covers such as Milkshake™ now complement traditional mortality products, protecting milk-output income streams and enhancing loan security for processors in hot climates. Steady mechanization and genetic intensification sustain sizable sums insured, ensuring dairy’s prominent place in the livestock insurance market. Recent regulatory changes in the European Union that tighten animal-welfare audits also push producers toward comprehensive policies that bundle liability protection with disease endorsements, further enlarging dairy’s premium base.
Aquaculture, however, is on course to outpace every land-based category at an 8.05% CAGR. Disease spikes, algal blooms and storm surges plague fish farmers from Norway to Vietnam, making parametric wave-height and temperature policies attractive complements to conventional all-risks covers. Technology-based surveillance, including underwater cameras and biometric analytics, allows carriers to price these volatile exposures and expand capacity. Major reinsurers have begun syndicating aquaculture-specific catastrophe bonds, adding fresh capital to support rapid scale-up. As global seafood demand rises, aquaculture’s share of livestock insurance market size is expected to broaden well beyond today’s single-digit level, bringing with it new actuarial datasets that will further refine premium adequacy.
By Distribution Channel: Intermediated Strength Faces Embedded Disruption
Agents and brokers control 34.68% of the livestock insurance market premium thanks to their advisory role in complex policy wording, loss-prevention strategies, and claims management. Deep relationships with veterinarians and feed suppliers also feed lead pipelines, and some brokerages now deploy drone imagery to validate stock numbers during renewal discussions. Yet high servicing costs and slower onboarding create openings for more scalable models.
Embedded insurance is scaling fastest at a 6.43% CAGR by piggybacking on ag-equipment sales, digital marketplaces, and farm-management apps. Providers like Pula weave coverage into seed financing or input credit, letting growers secure protection with a single click during loan origination. The model is especially suited to standardized covers for goats, poultry, and index-based drought products, and application programming interfaces (APIs) now permit real-time premium financing at checkout. While intermediated business will dominate bespoke corporate placements, embedded distribution is expected to bring large volumes of first-time buyers into the livestock insurance market and to slash acquisition costs per policy through automated underwriting.
Geography Analysis
Asia-Pacific leads the livestock insurance market with 27.14% of global premium and a forecast 7.04% CAGR through 2031. China runs the world’s biggest national scheme, and India is scaling its index coverage at pace on the back of public-private partnerships. Expansion potential remains sizable because penetration lags underlying herd growth, particularly in Indonesia, Vietnam, and the Philippines. Domestic carriers are partnering with reinsurers to deepen capacity while mobile micro-insurance apps spread literacy across rural belts.
North America shows high maturity yet remains a growth contributor as federal subsidies keep evolving. The U.S. Risk Management Agency broadened Livestock Risk Protection terms in 2024 and is adding unborn-calf and cull-cow options from 2026, sustaining fresh premium channels. Canada’s recent weather catastrophes are also prompting provincial governments to co-fund livestock covers, raising take-up among cow-calf and hog operators.
Europe presents divergent trajectories. Germany and France sustain sophisticated multi-peril products, whereas Eastern states such as Romania and Bulgaria register lower adoption and consequently higher uninsured losses. Climate legislation that incentivizes risk-transfer solutions is expected to narrow this gap over the next decade.
Latin America is experiencing brisk expansion driven by regulatory modernization and digital intermediaries, even though consistent data on premium growth remains scarce following the removal of consulting firm statistics in this analysis. Brazil’s renewed subsidy envelope and Mexico’s satellite-based drought scheme are notable catalysts for regional uptake.

Competitive Landscape
The livestock insurance market is moderately concentrated. Legacy insurers, including Nationwide Mutual, ICICI Lombard, and AXA SA, hold sizeable books through long-standing rural sales forces. Nationwide’s recent withdrawal from high-net-worth personal lines reallocates capital toward agricultural operations, reinforcing its rural franchise. ICICI Lombard posted a 68% profit jump in Q3 FY 2025, spotlighting robust demand in India’s corporate dairy sector.
Reinsurers continue to backstop capacity. Munich Re delivered USD 4.96 billion net profit in 2023 and signalled a sustained appetite for extreme-weather livestock exposures. Hannover Re is likewise expanding agricultural retrocession pools, improving primary insurers’ headroom in climate-prone geographies.
Technology differentiation is gaining weight. Several carriers integrate IoT collars, satellite pasture indices and blockchain claims ledgers to cut loss ratios and speed payouts. Start-ups such as ProAg’s digital portal enable real-time policy adjustments, while InsurTech entrants target aquaculture and small-ruminant niches with data-rich underwriting. As established players embrace similar tools or acquire niche tech firms, further consolidation is anticipated.
Livestock Insurance Industry Leaders
AXA SA
Allianz SE
Zurich Insurance Group
Nationwide Mutual Insurance Company
ICICI Lombard General Insurance Co.
- *Disclaimer: Major Players sorted in no particular order

Recent Industry Developments
- January 2025: Generali Global Corporate & Commercial launched its Indian operations, marking a strategic entry into the country's growing specialty insurance market. The offering includes parametric agriculture and livestock covers designed to provide rapid payouts based on predefined triggers like rainfall, temperature, or disease outbreaks.
- October 2024: AIR Parametric, Guy Carpenter and Liberty Mutual Re launched MilkshakeTM to protect U.S. dairy herds against heat stress.
- November 2024: Lockton Re joined with Verisk to co-develop indexed livestock products using advanced climate models.
- April 2024: Pula raised USD 20 million in a Series B funding round to accelerate the expansion of its embedded livestock insurance solutions. The company aims to deepen its footprint across Africa and Asia by partnering with financial institutions, agritech platforms, and governments to offer data-driven, accessible coverage to smallholder farmers.


Global Livestock Insurance Market Report Scope
Livestock insurance safeguards owners from financial losses resulting from risks to their animals. It compensates for losses incurred from death, injury, or theft, offering peace of mind amid unforeseen events.
The livestock insurance market is segmented by type, application, distribution channel, and region. By type, the market is segmented into commercial mortality and non-commercial mortality. By application, the market is segmented into dairy, cattle, swine, and other applications. By distribution channel, the market is segmented into direct sales, bancassurance, agents, and brokers. By region, the market is segmented into North America, Europe, Asia-Pacific, Middle East and Africa, Latin America, and Rest of the World. The report offers market sizes and forecasts for all the above segments in value (USD).
| Commercial Mortality |
| Non-commercial Mortality |
| Dairy |
| Cattle |
| Swine |
| Poultry |
| Aquaculture |
| Direct-to-Consumer (DTC) |
| Intermediated |
| Embedded |
| North America | United States |
| Canada | |
| Mexico | |
| South America | Brazil |
| Peru | |
| Chile | |
| Argentina | |
| Rest of South America | |
| Europe | Germany |
| United Kingdom | |
| France | |
| Italy | |
| Spain | |
| BENELUX (Belgium, Netherlands, and Luxembourg) | |
| Nordics (Sweden, Norway, Denmark, Finland) | |
| Rest of Europe | |
| Asia-Pacific | China |
| India | |
| Japan | |
| South Korea | |
| Australia | |
| South East Asia | |
| Indonesia | |
| Rest of Asia- Pacific | |
| Middle East & Africa | United Arab Emirates |
| Saudi Arabia | |
| South Africa | |
| Nigeria | |
| Rest of Middle East and Africa |
| By Type | Commercial Mortality | |
| Non-commercial Mortality | ||
| By Application | Dairy | |
| Cattle | ||
| Swine | ||
| Poultry | ||
| Aquaculture | ||
| By Distribution Channel | Direct-to-Consumer (DTC) | |
| Intermediated | ||
| Embedded | ||
| By Geography | North America | United States |
| Canada | ||
| Mexico | ||
| South America | Brazil | |
| Peru | ||
| Chile | ||
| Argentina | ||
| Rest of South America | ||
| Europe | Germany | |
| United Kingdom | ||
| France | ||
| Italy | ||
| Spain | ||
| BENELUX (Belgium, Netherlands, and Luxembourg) | ||
| Nordics (Sweden, Norway, Denmark, Finland) | ||
| Rest of Europe | ||
| Asia-Pacific | China | |
| India | ||
| Japan | ||
| South Korea | ||
| Australia | ||
| South East Asia | ||
| Indonesia | ||
| Rest of Asia- Pacific | ||
| Middle East & Africa | United Arab Emirates | |
| Saudi Arabia | ||
| South Africa | ||
| Nigeria | ||
| Rest of Middle East and Africa | ||


Key Questions Answered in the Report
How big is the Livestock Insurance Market?
The Livestock Insurance Market size is expected to reach USD 9.74 billion in 2026 and grow at a CAGR of 7.08% to reach USD 13.72 billion by 2031.
What is the current size of the livestock insurance market?
The livestock insurance market generated USD 9.74 billion premium in 2026 and is forecast to reach USD 13.72 billion by 2031.
Which region leads the livestock insurance market?
Asia-Pacific holds the top position with 27.14% of global premium owing to large livestock populations in China and India.
Which coverage type dominates the livestock insurance market?
Commercial mortality insurance commands 62.78% of global premium due to high-value herds on corporatized farms.
Why is aquaculture insurance growing so quickly?
Disease outbreaks and climate-driven water quality swings expose fish farms to high mortality risk, pushing aquaculture premium up at an 8.05% CAGR.
Page last updated on:


