
Light Tower Market Size and Share
Market Overview
| Study Period | 2020 - 2031 |
|---|---|
| Market Size (2026) | USD 5.08 Billion |
| Market Size (2031) | USD 6.28 Billion |
| Growth Rate (2026 - 2031) | 4.32 % |
| Fastest Growing Market | Asia Pacific |
| Largest Market | North America |
| Market Concentration | Medium |
Major Players *Disclaimer: Major Players sorted in no particular order Image © Mordor Intelligence. Reuse requires attribution under CC BY 4.0. | |
Light Tower Market Analysis by Mordor Intelligence
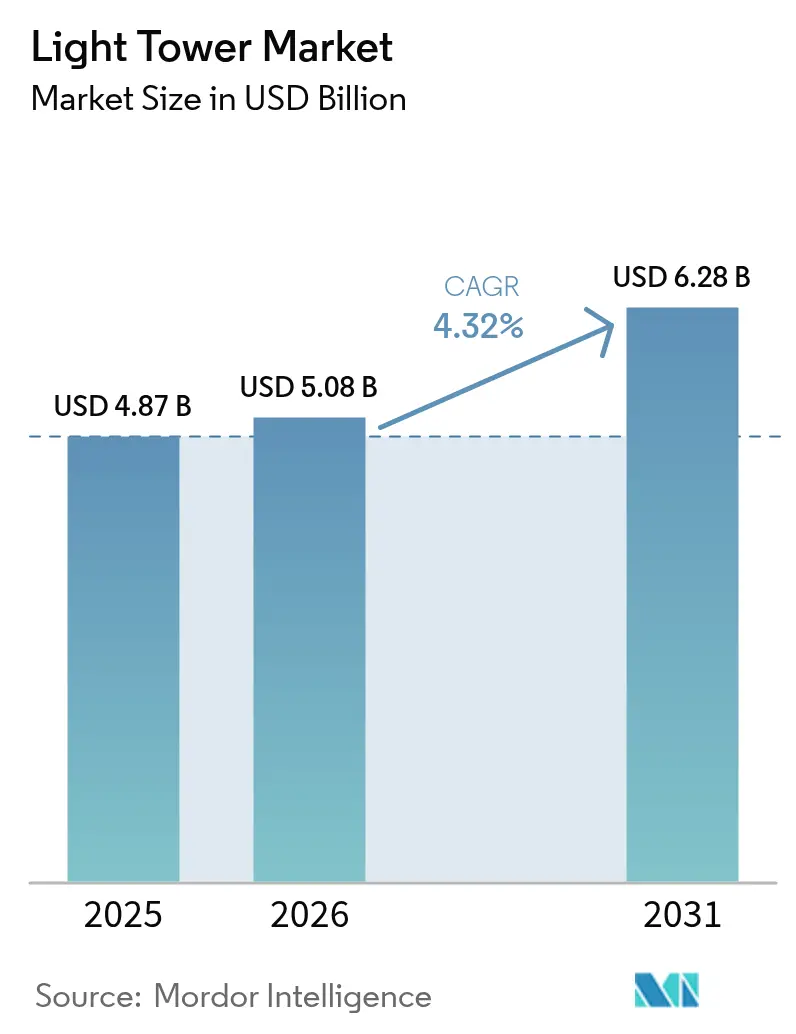
The light tower market size was valued at USD 4.87 billion in 2025 and estimated to grow from USD 5.08 billion in 2026 to reach USD 6.28 billion by 2031, at a CAGR of 4.32% during the forecast period (2026-2031). Demand resilience stems from the need for reliable, movable lighting across construction, mining, oil and gas, and emergency response sites. Contractors favor energy-efficient equipment, prompting a rapid migration toward LED units and a parallel push for hybrid power sources that cut fuel use and emissions. Rental providers are modernizing fleets to comply with Tier-4 and Stage V norms and to meet total-cost-of-ownership targets. Hydrogen fuel-cell prototypes and solar-hybrid systems widen the technology palette, while stricter environmental policies create headroom for premium designs focused on runtime, sound attenuation, and telematics.
Key Report Takeaways
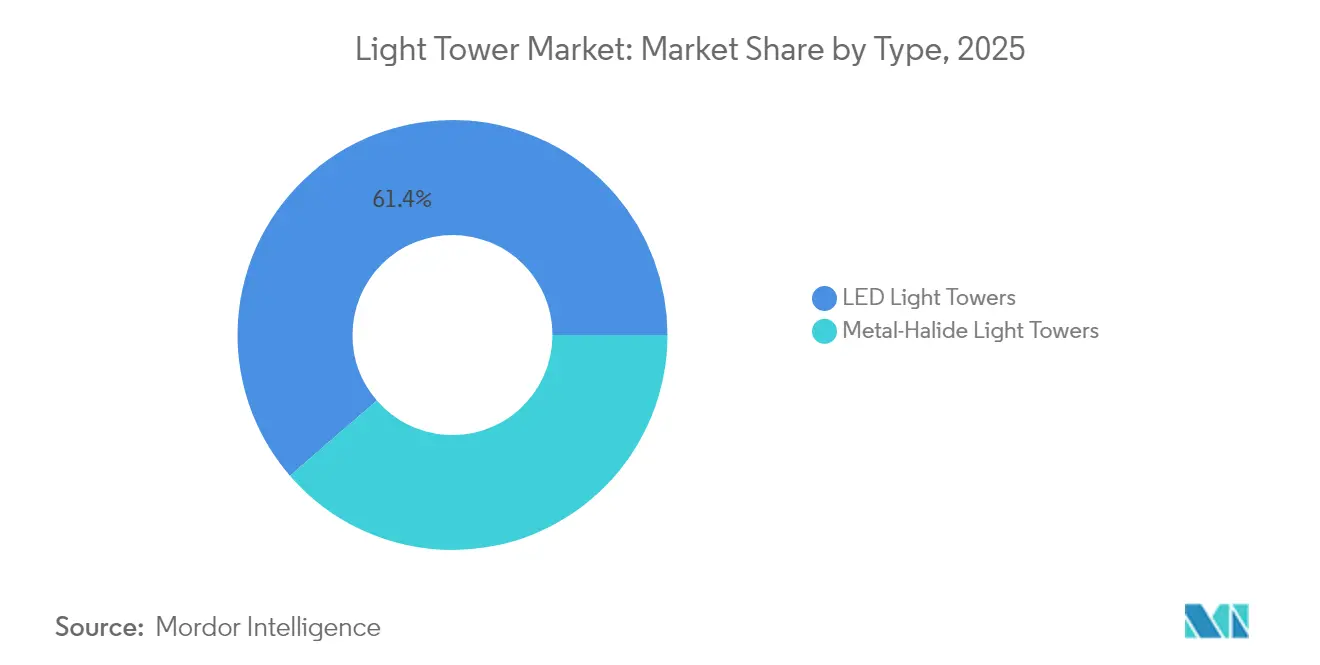
- By type, LED towers led with 61.35% revenue share in 2025; solar-hybrid variants are projected to expand at a 6.91% CAGR to 2031.
- By power source, diesel models held 69.20% of the light tower market share in 2025, while solar-hybrid solutions post the highest expected CAGR at 6.91% through 2031.
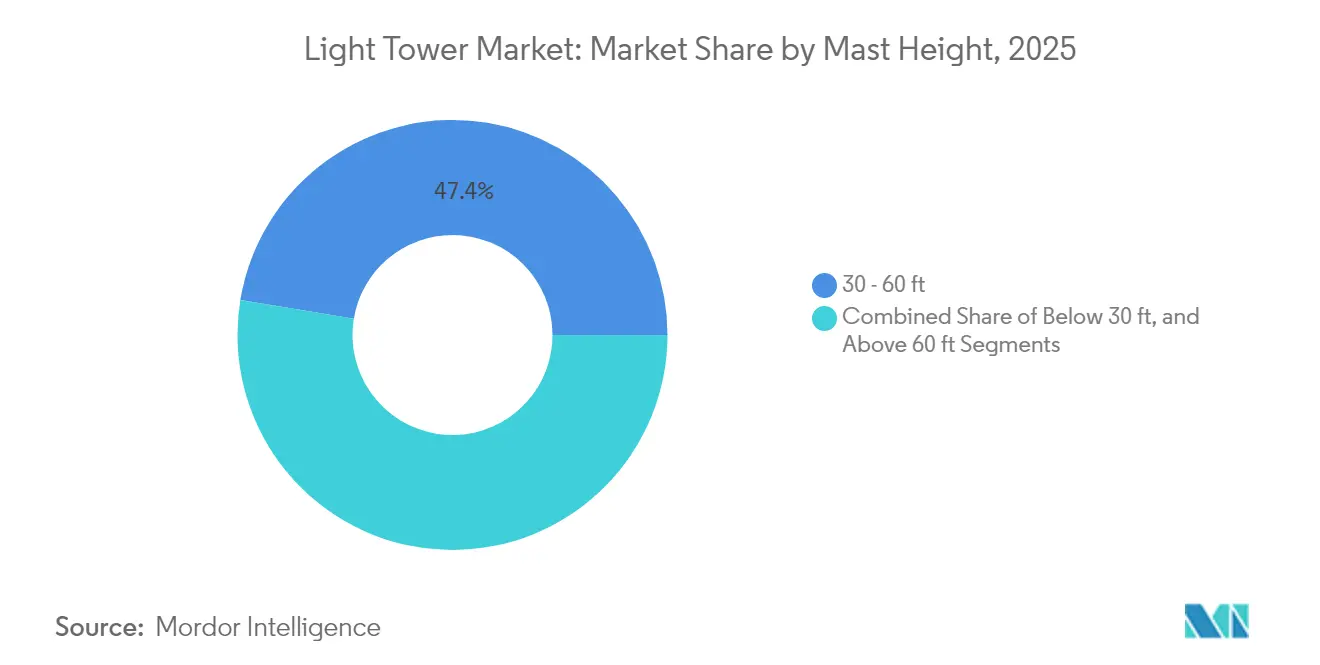
- By mast height, the 30-60 ft range captured 47.40% of the light tower market size in 2025; units above 60 ft are set to grow at 5.86% CAGR between 2026-2031.
- By mobility, trailer-mounted systems led with 82.30% share in 2025; skid-mounted designs show the quickest rise at 5.04% CAGR to 2031.
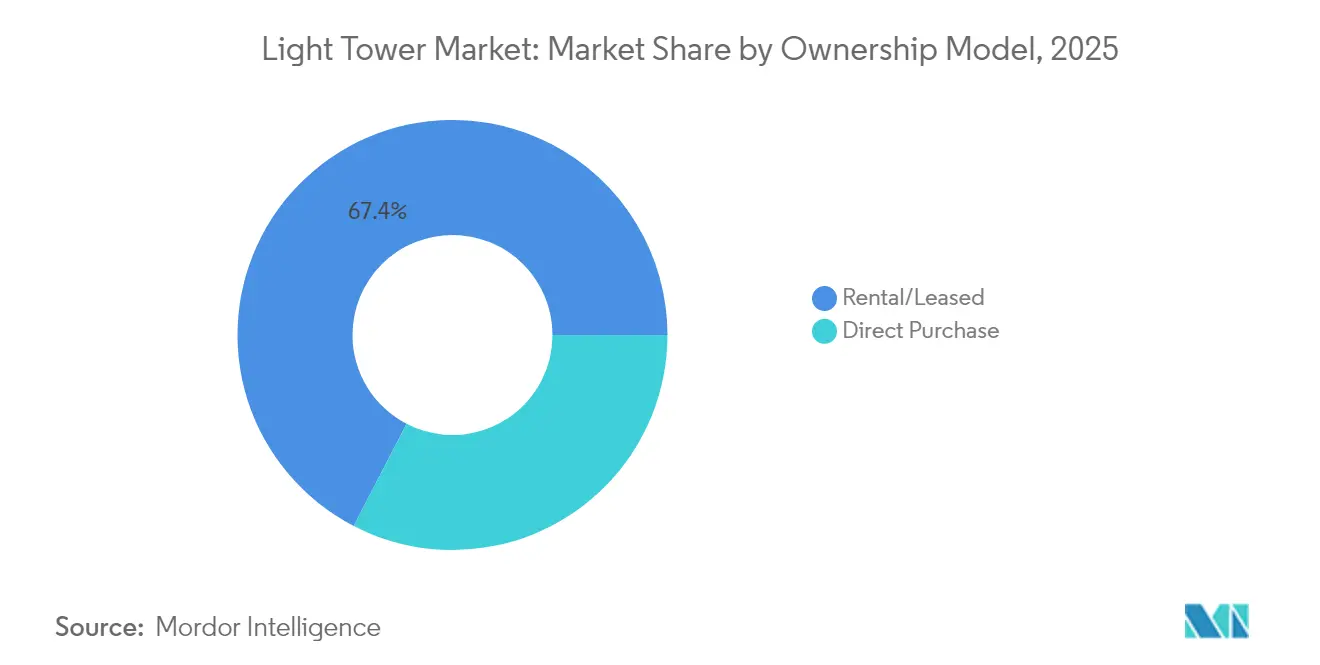
- By ownership model, the rental segment accounted for 67.40% share of the light tower market size in 2025 and is advancing at a 5.18% CAGR through 2031.
- By end-user, construction dominated with 44.60% revenue share in 2025; oil and gas operations are poised for the fastest 5.52% CAGR over 2026-2031.
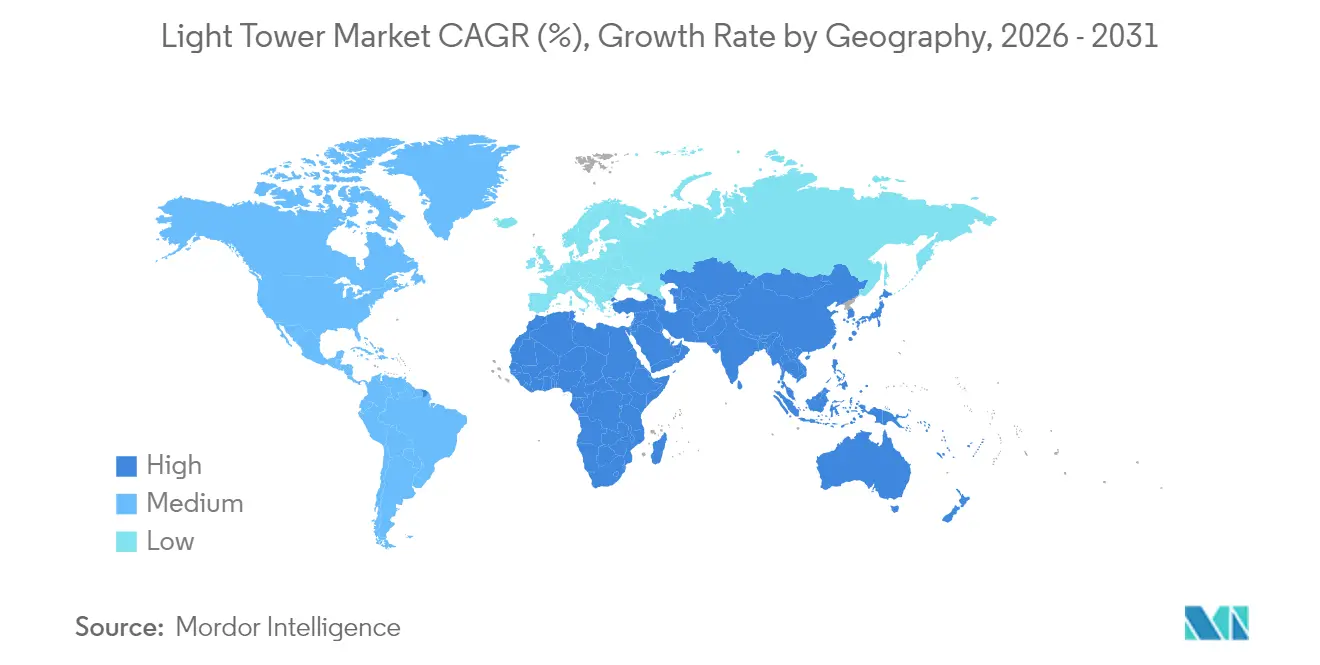
- By geography, North America held 33.60% of the light tower market share in 2025; Asia Pacific is forecast to post a 5.12% CAGR to 2031.
Note: Market size and forecast figures in this report are generated using Mordor Intelligence’s proprietary estimation framework, updated with the latest available data and insights as of 2026.
Market Trends and Insights
Drivers Impact Analysis of Light Tower Market*
| Driver | (~) % Impact on CAGR Forecast | Geographic Relevance | Impact Timeline |
|---|---|---|---|
| Booming 24 × 7 infrastructure-repair programs | +1.2% | North America | Medium term (2-4 years) |
| Rapid LED retrofit in rental fleets | +0.9% | Europe | Short term (≤ 2 years) |
| Solar-hybrid towers at remote oil and gas pads | +0.7% | Middle East and Africa | Medium term (2-4 years) |
| Tier-4 and Stage V norms driving hybrid adoption | +1.1% | Global (focus on North America and Europe) | Medium term (2-4 years) |
| Mega-mining projects lifting high-mast demand | +0.4% | Asia Pacific (Australia) | Long term (≥ 4 years) |
| Disaster-relief funding surge | +0.5% | ASEAN | Medium term (2-4 years) |
| Source: Mordor Intelligence | |||
Booming 24 × 7 Infrastructure-Repair Programs in North America
Round-the-clock bridge, airport, and highway refurbishments create sustained demand for high-output towers able to operate for multiple shifts. The American Society of Civil Engineers lists a USD 9.1 trillion infrastructure gap that accelerates night-work schedules and heightens lighting requirements.[1]American Society of Civil Engineers, “A Comprehensive Assessment of America’s Infrastructure 2025,” infrastructurereportcard.org Municipal budgets mirror this urgency; San Diego earmarked USD 451.37 million for streetlight upgrades across 2025-2029, signaling widespread procurement of portable units.[2]City of San Diego, “Fiscal Year 2025-2029 Five-Year Capital Infrastructure Planning Outlook,” sandiego.gov Equipment spec sheets now highlight extended fuel tanks and telematics for up-time monitoring. Manufacturers respond with designs like Allmand’s Maxi-Lite, featuring a 175-hour runtime, a specification that meets contractor requests for fewer refuels.
Rapid Shift Toward LED Retrofit in Rental Fleets across Europe
European rental houses compete on total operating cost, prompting fleet conversions from metal-halide to LED. Restrictions on noise and exhaust in dense urban zones speed the switch, as LED fixtures cut fuel burn and maintenance visits. Generac Mobile’s GLT series now offers adjustable LED arrays and hybrid variants that meet strict municipal standards. Early adopters gain tender advantages when public contracts score sustainability criteria. The retrofit trend has also shifted residual-value calculations, with LED units achieving higher resale prices, a benefit reflected in rental rate structures that favor energy-efficient models.
Rising Deployment of Solar-Hybrid Towers at Remote Oil and Gas Pads in MENA
Hybrid configurations combining photovoltaic panels, batteries, and small diesel engines cut fuel logistics by up to 80% in desert environments. ScienceDirect reports that integrating solar with storage stabilizes off-grid systems and lowers lifecycle costs.[3]ScienceDirect, “Integrating Solar and Wind Energy into the Electricity Grid for Community Support,” sciencedirect.com Oil majors employ these towers to meet corporate decarbonization targets while maintaining stringent uptime mandates. Predictable operating costs shield budgets from diesel price volatility, and remote monitoring reduces onsite technician visits. Suppliers are scaling ruggedized enclosures, corrosion-proof masts, and dust-resistant panels to meet regional climate demands, creating a niche yet lucrative product line within the light tower market.
Stringent Tier-4 and Stage V Emission Norms Fueling Hybrid-Powered Adoption
The United States EPA’s 2027 multi-pollutant standards target a 50% greenhouse-gas cut versus 2026 levels, indirectly pressuring non-road equipment categories.[4]Environmental Protection Agency, “Multi-Pollutant Emissions Standards for Model Years 2027 and Later,” federalregister.gov Parallel European Stage V rules require diesel particulate filters on small engines, adding cost and complexity. Hybrid towers with smart start-stop engines and sizable battery packs offer a compliance path while trimming fuel consumption. Generac’s GLT4-A Hybrid pairs a 2-cylinder engine with lithium-ion storage, extending maintenance intervals and cutting onsite emissions. Rental fleets pivot toward such models to ensure cross-border availability without separate compliance SKUs, reinforcing hybrid adoption.
Restraints Impact Analysis of Light Tower Market*
| Restraint | (~) % Impact on CAGR Forecast | Geographic Relevance | Impact Timeline |
|---|---|---|---|
| High initial CAPEX for hydrogen-fuel towers | -0.7% | Europe and North America | Medium term (2-4 years) |
| Operational downtime from battery drain in Nordic cold | -0.3% | Nordic countries | Short term (≤ 2 years) |
| Volatile diesel prices distorting rental rates | -0.5% | Global | Medium term (2-4 years) |
| Complex permitting for temporary lighting in EU cities | -0.4% | Europe | Medium term (2-4 years) |
| Source: Mordor Intelligence | |||
High Initial CAPEX for Hydrogen-Fuel Towers
Fuel-cell units eliminate combustion emissions but cost three to four times more than conventional diesel models. Procurement departments focused on payback periods often defer purchases despite lifecycle savings. Limited refueling infrastructure confines deployments to pilot sites and high-profile events. As hydrogen hubs expand and stack prices fall, adoption barriers are expected to recede, yet near-term growth remains tempered by tight capital budgets and project bid pressures.
Operational Downtime Due to Battery Drain in Cold Nordic Climates
Lithium-ion capacity declines sharply in sub-zero temperatures, trimming runtime and forcing more frequent change-outs. Contractors in Finland, Sweden, and Norway maintain fleets of diesel units as backup, undermining the utilization of battery or hybrid models. Suppliers are testing heated enclosures and chemistries optimized for low temperatures, but added hardware raises purchase price and complexity.
*Our forecasts treat driver/restraint impacts as directional, not additive. The impact forecasts reflect baseline growth, mix effects, and variable interactions.
Light Tower Market Segment Analysis
By Type:
LED’s Operational Savings Reinforce Market LeadershipLED towers retained 61.35% share of the light tower market in 2025 and continue growing at a 4.38% CAGR. Reduced wattage and bulb lifespans beyond 50,000 hours cut fuel burn and service intervals, making LED the default specification for rental bids that score on sustainability metrics. Bright white output improves worksite visibility, reducing accident rates and aligning with regulatory safety checklists. Construction contractors in urban Europe increasingly specify low-glare LED arrays to comply with noise and light-pollution ordinances.
Metal-halide systems persist in niche heavy-industrial applications where very high lumen output per fixture is prioritized over fuel use. Manufacturers respond with ruggedized housings and quick-strike lamps to shorten warm-up times. Product innovation extends across both formats; Atlas Copco’s Hilight V4+ protects components under a molded canopy and fits 16 units per 13-m truck, showcasing how design efficiency supplements lighting performance. The coexistence of LED and metal-halide keeps component supply chains diversified yet tilts R&D budgets toward solid-state technologies.



By Power Source:
Diesel’s Dominance Meets Renewable PressureDiesel-powered towers accounted for 69.20% of the light tower market share in 2025, benefiting from ubiquitous fueling infrastructure and field-proven reliability. Tier-4 engines with electronic management cut emissions and idle time, while automatic start-stop functions align runtime with real light demand, trimming fuel bills. These enhancements enable diesel units to remain competitive in remote or extreme environments where solar exposure or battery performance is uncertain.
Solar-hybrid designs post the highest 6.91% CAGR forecast. Integrated panels charge onboard batteries by day, allowing silent night operations, with small engines activating only under low-state-of-charge thresholds. Atlas Copco’s HiLight BI+4 matches lithium-ion packs with a micro-diesel engine, cutting carbon dioxide output by more than half across a standard workweek. Hydrogen fuel-cell prototypes, like TCP Group’s 500-unit fleet completed in 2025, promise zero-local-emission performance but remain cost-intensive. Direct grid-connected towers fill specialized roles in tunneling and large events where shore power exists, demonstrating the diversified technology mix inside the broader light tower market.
By Mast Height:
Versatile Mid-Range Units Anchor Fleet DecisionsUnits between 30 ft and 60 ft represented 47.40% of the light tower market size in 2025. Their coverage radius suits most civil works, sports events, and disaster-relief setups while preserving towing practicality. Standardized telescopic sections ease maintenance and spare-parts logistics, strengthening their status as rental fleet staples. The Wacker Neuson LTW20’s five-section mast rotates 360°, offering flexible coverage from a compact footprint.
Demand for masts above 60 ft is growing at a 5.86% CAGR, driven by Australian mining and sprawling infrastructure corridors where fewer high-capacity towers reduce deployment labor. Taller towers feature reinforced stabilizers and remote winch controls that improve safety during raising and lowering. The below-30 ft category holds steady for confined urban sites and quick-response scenarios such as first-responder staging areas.
By Mobility:
Trailer-Mounted Units Remain the WorkhorseTrailer-mounted towers captured an 82.30% share in 2025, reflecting the itinerant nature of construction, events, and emergency operations. Road-legal towing frames, swing-out outriggers, and fold-down masts support fast relocation. Rishabh Engineering’s mobile series offers 360° rotation, LED or metal-halide head options, and weatherproof enclosures suited for monsoon climates. High utilization rates in rental fleets underpin stable demand.
Skid-mounted systems grow 5.04% per year, favored for semi-permanent deployments at mines and oil pads. Eliminating axles and brakes trims costs and reduces failure points. Operators often integrate skids with site power management networks that automate lighting schedules and report fuel levels. Hybrid skid designs with forklift pockets provide occasional mobility without full trailer expense, blurring traditional mobility boundaries inside the light tower market.
By Ownership Model:
Rental Leads as Technology EvolvesRental companies supplied 67.40% of units deployed in 2025, and the segment maintains a 5.18% CAGR outlook. Contractors convert capital expenditure to project-based operating costs, access newer emissions-compliant models, and outsource maintenance. United Rentals recorded USD 14.3 billion in 2023 revenue, with proprietary telematics enabling customers to track assets across job sites. Fleet renewal cycles tighten as LED, hybrid, and telemetry upgrades improve utilization and rate premiums.
Direct ownership persists for mines, refineries, and municipalities with predictable year-round lighting needs. Buyers weigh depreciation against service costs and regulatory risk. Suppliers provide total-cost-of-ownership calculators and extended warranties to strengthen value propositions. Leasing programs with buyout clauses blur the lines between pure rental and ownership, creating flexible procurement pathways.
By End-User Industry:
Construction Steady, Oil and Gas AcceleratingConstruction projects accounted for 44.60% of revenue in 2025, reflecting the sector’s scale and use of night shifts to shorten timelines and comply with daytime traffic restrictions. Federal infrastructure packages in the United States and Canada funnel funds into bridges, airports, and road renewals, ensuring sustained equipment hire. LED arrays with adjustable beam angles minimize glare complaints near urban residences, aiding permit approval.
Oil and gas operations are projected to rise at a 5.52% CAGR. Remote pads rely on equipment capable of 24/7 operation, low service frequency, and resistance to sand ingress. Generac’s MLT6SMD LED towers operate alongside MMG185CAN diesel generators on Klondike gold projects, proving resilience in harsh climates. Mining, events, industrial plants, and military logistics represent additional steady niches, each dictating specific lumen, runtime, and transport constraints.
Geography Analysis
North America Light Tower Market
North America led the light tower market with a 33.60% share in 2025. Infrastructure renewal mandates, stringent safety regulations, and frequent extreme-weather events sustain year-round demand. The American Society of Civil Engineers underscores the investment gap that drives night construction schedules. Manitoba’s 2024/2025 strategy includes runway light upgrades to meet Transport Canada rules, highlighting aviation’s contribution. Rental giants leverage digital platforms such as Total Control to optimize fleet allocation, enabling contractors to combine towers, generators, and pumps within unified dashboards.
APAC Light Tower Market
Asia Pacific is the fastest-growing region at 5.12% CAGR, propelled by mega-mining activities, urban population growth, and expanding renewable-energy infrastructure. Australian projects necessitate high-mast towers to illuminate haul roads spanning several kilometers. Elsewhere, rapid urban expansion requires flexible trailer units for bridge, rail, and mixed-use developments. BloombergNEF estimates USD 89 trillion in energy investments are needed for net-zero by 2050, signaling long-term capital flows into grid and renewable installations that will require temporary lighting during build-out phases.
EMEA and South America Light Tower Market
Europe remains a sizable market characterized by strict emission compliance and sophisticated rental penetration. LED and hybrid adoption rates exceed global averages due to urban environmental restrictions and carbon-pricing mechanisms. Government incentives for low-emission equipment increase the payback speed of next-generation towers. The Middle East and Africa register steady growth as oil, gas, and utility operators embrace solar-hybrid units for remote desert sites. South America’s demand varies by commodity cycle; copper and iron ore mines in Chile and Brazil procure taller masts and robust chassis suited for mountainous terrain. Telecommunications fiber rollouts also spur equipment orders, as network installers require spot illumination for trenching and splice work after daylight.

Value Chain Analysis
The light tower value chain starts with upstream inputs such as LED luminaires and drivers, small industrial diesel engines compliant with EPA Tier 4 Final and EU Stage V, steel and aluminum for chassis and telescopic masts, hydraulic cylinders, alternators, and, for hybrid or solar units, lithium-ion batteries and power electronics (inverters, BMS, ruggedized MPPT controllers). OEMs and assemblers (including Generac, Atlas Copco, Terex, Doosan, Allmand, Wacker Neuson, and Trime) integrate these subsystems into trailer- and skid-mounted platforms, adding controls, safety hardware, and increasingly telematics for runtime and maintenance monitoring. Compliance and certification requirements across emissions and transport add engineering and testing steps, which can lengthen new-product release cycles for hybrid models.
Downstream, distribution relies on rental and fleet channels that procure at scale and rotate inventory based on utilization and residual values, while direct sales serve end users with steady needs (mining, oil and gas, municipalities, and industrial plants). After-sales support is a key value chain lever because hybrid powertrains, batteries, and telematics require trained technicians and parts availability, and service network depth influences fleet-standardization decisions. Bottlenecks include battery cell price and availability swings and longer lead times for specialized power electronics, while constrained supply of compliant small engines can affect production planning for diesel and hybrid configurations.
Competitive Landscape
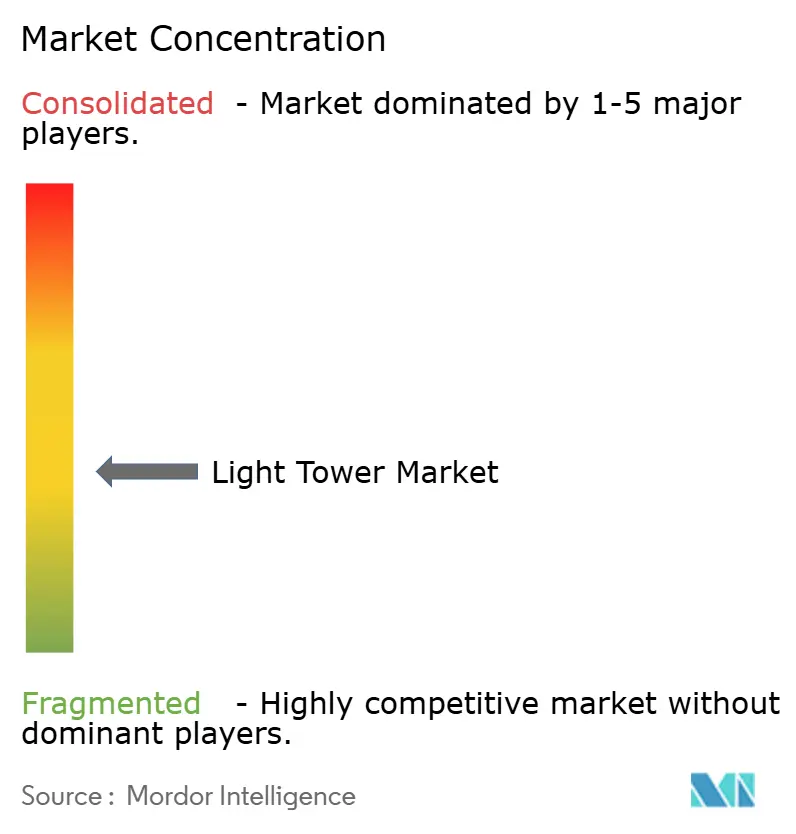
The light tower market exhibits moderate concentration: global leaders Generac, Terex, Atlas Copco, and Doosan compete with regional specialists that focus on price and after-sales proximity. Product differentiation centers on fuel efficiency, noise output, telematics, mast design, and lighting technology. Generac’s Mobile Battery Light Tower, winner of a GOOD DESIGN Award, eliminates external power inputs and addresses stringent urban noise ordinances.[7]Generac, “GOOD DESIGN Awards News Release,” investors.generac.com Terex unveiled a hybrid solar tower in May 2025 that reduces diesel use by 80% and targets application overlap with conventional units. Atlas Copco advances modular designs to lower shipping costs, and Doosan enhances durability for mining-specific models.
Rental companies hold significant negotiating power, shaping manufacturers' roadmaps toward lower total-cost-of-ownership features such as auto-dimming sensors and predictive maintenance analytics. A 2025 class-action lawsuit alleges price-fixing among major rental chains, including United Rentals and Sunbelt Rentals. The outcome could reset pricing structures, encouraging equipment suppliers to offer direct-to-contractor financing or subscription models.
Digital integration deepens as fleets aggregate data on runtime, engine hours, and CO₂ emission savings. Vendors bundle service packages that guarantee uptime and relieve contractors of routine maintenance. The resulting service orientation allows manufacturers to capture recurring revenue and buttress margins against rising steel and battery raw-material costs.
Light Tower Industry Leaders
Atlas Copco AB
Terex Corporation
Generac Power Systems Inc.
Larson Electronics LLC
Doosan Portable Power
- *Disclaimer: Major Players sorted in no particular order
Light Tower Market Companies Covered in this Report
- Atlas Copco AB
- Generac Power Systems Inc. (Generac Mobile)
- Terex Corp.
- Doosan Portable Power
- Wacker Neuson SE
- Trime S.r.l.
- Allmand Bros. Inc. (Briggs and Stratton)
- Larson Electronics LLC
- Wanco Inc.
- Xylem Inc. (Seltorque)
- J C Bamford Excavators Ltd.
- United Rentals Inc.
- BMI Group (Genergy)
- Lind Equipment Ltd.
- Colorado Standby
- Youngman Richardson and Co. Ltd.
- Westquip Diesel Sales Ltd.
- Inmesol Gensets SL
- Atlas Luminaires Inc.
- The Will-Burt Company

Market Opportunities and Future Outlook
Rental-led fleet modernization creates whitespace for interoperable connected towers that can be integrated into mixed-brand fleet platforms. The market shows clear momentum toward standardized data and remote management, with telematics implementations referencing ISO 15143-3 for fleet integration and including GNSS-based tracking and geofencing features to reduce loss and improve dispatch control. This creates opportunities for OEMs and rental houses to bundle subscription-based monitoring, predictive diagnostics (fuel, battery voltage, and temperature alerts), and uptime-focused service contracts into procurement decisions, beyond competing primarily on capex.
Technology shifts toward LED-first and hybridized powertrains also open up opportunities in urban and regulated worksites, where contractors face tighter noise and emissions limits and where permitting can penalize high-idle diesel operation. Recent product roadmaps described by suppliers emphasize LFP battery-based hybrid systems managed by CAN-bus controllers, aligning with the report focus on hybrid adoption driven by Tier 4 and Stage V norms. Hydrogen fuel-cell light towers remain a premium niche due to high upfront costs, but TCP Group’s completion of a 500-unit fuel-cell mobile tower fleet in 2025 indicates a step from pilot deployments toward broader availability, helping suppliers refine logistics, serviceability, and customer acceptance for zero-local-emission use.
Recent Industry Developments in Light Tower Market
- March 2026: Atlas Copco launched the HiLight M+ 5 and HiLight M+ 7 light towers, featuring Stage V engines, hydraulic masts, and electric mast head rotation. The models are positioned for broad jobsite conditions, with stated operating capability from -25 C to +50 C, supporting use cases in mining, infrastructure, and remote industrial work where reliability and compliance drive fleet decisions.
- May 2025: TCP Group completed production of a 500-unit fleet of fuel-cell mobile light towers. The milestone advances hydrogen-powered lighting from limited pilots toward fleet-scale availability, giving rental and event operators a clearer pathway to deploy zero-local-emission towers where noise and exhaust constraints restrict diesel equipment.
- October 2024: Generac Mobile expanded its GLT light tower family with two hybrid models combining fuel-efficient engines and battery packs. The additions strengthen Generac Mobile’s lineup for customers seeking longer runtime with reduced fuel burn and lower onsite emissions, aligning with rental fleet upgrades tied to Tier 4 and Stage V compliance requirements.


Light Tower Market Report Scope and Research Methodology
Market Definition and Coverage
For this study, the light tower market covers portable and mobile lighting tower units used for temporary illumination across job sites and outdoor operations. Revenue is counted in USD from equipment supplied into end use needs, covering common lamp types and power configurations.
Scope exclusions: This sizing excludes fixed-area lighting systems and standard luminaires that are permanently installed in buildings, streets, or industrial facilities.
Segments Covered in This Report
- By Type
- LED Light Towers
- Metal-Halide Light Towers
- By Power Source
- Diesel Powered
- Solar-Hybrid Powered
- Hydrogen Fuel-Cell Powered
- Direct Grid/Battery Powered
- By Mast Height
- Below 30 ft
- 30 - 60 ft
- Above 60 ft
- By Mobility
- Mobile/Trailer-Mounted
- Skid/Fix-Mounted
- By Ownership Model
- Rental/Leased
- Direct Purchase
- By End-user Industry
- Construction
- Oil and Gas
- Mining
- Industrial and Manufacturing
- Infrastructure (Road, Rail, Airport, Ports)
- Events, Sports and Entertainment
- Military, Emergency and Disaster Relief
- By Geography
- North America
- United States
- Canada
- Mexico
- Europe
- Germany
- United Kingdom
- France
- Italy
- Spain
- Nordics (Denmark, Sweden, Norway, Finland)
- Rest of Europe
- Asia-Pacific
- China
- Japan
- South Korea
- India
- Southeast Asia
- Australia
- Rest of Asia-Pacific
- South America
- Brazil
- Argentina
- Rest of South America
- Middle East
- Gulf Cooperation Council Countries
- Turkey
- Rest of Middle East
- Africa
- South Africa
- Nigeria
- Rest of Africa
- North America
Data Sources, Market Sizing, and Validation
Desk Research
Desk research was used to build the initial demand and supply picture and to keep basic assumptions grounded in facts that can be checked. We referenced public sources such as US Census construction spending releases, US Bureau of Labor Statistics employment and wage series (for construction and mining activity signals), US Energy Information Administration fuels data (diesel pricing trends), and USGS commodity summaries for mining activity context. For trade and cross border movement signals, sources such as UN Comtrade and national customs dashboards were reviewed to understand equipment import and export direction.
On the industry side, we also used company annual reports, investor presentations, product brochures, and trusted press coverage to map product definitions, typical configurations, and likely channel structures. Where useful, paid subscriptions for company financials and news intelligence, patent databases, and shipment-level import or export records were used to cross-check timelines and fill gaps in public disclosures. The sources mentioned are illustrative and not exhaustive, and many other references were also used for data collection, validation, and research clarification.
Primary Interviews and Surveys
Primary work focused on validating what drives unit demand, where equipment is deployed, and how pricing typically changes by fuel type, lamp type, and duty cycle. Interviews with manufacturers, rental and leasing participants, distributors, and end users (including construction and mining contractors) across APAC, EMEA, and the Americas helped confirm utilization patterns, replacement cycles, and how quickly LED and hybrid units are adopted in active job environments.
Distribution of primary research fieldwork respondents
| Company type | Respondent position | Region |
|---|---|---|
| Top tier: 38% | CXOs: 18% | APAC: 43% |
| Mid tier: 44% | Functional/Unit leaders: 24% | EMEA: 32% |
| Smaller Players: 18% | Managers: 58% | Americas: 25% |
Market-Sizing & Forecasting
Sizing started with a top-down build where construction and infrastructure activity signals were translated into an addressable temporary-lighting demand pool, and then filtered through typical light tower penetration and average fleet intensity by job type. Key model inputs included construction spending direction, active mining and quarrying activity signals, rental utilization and replacement timelines, the split between diesel and hybrid or solar units, and average selling price bands by lighting technology (LED versus metal halide). When the main clause mattered most, it came after we matched these drivers to regional seasonality and project cycles, since temporary lighting demand is rarely flat through the year.
To keep totals realistic, the results were corroborated with selective bottom-up approximations, such as sampling unit shipments and pricing for a set of suppliers, channel checks on rental fleet additions, and simple ASP x volume calculations for a few high-activity countries. Where bottom-up coverage was incomplete, gaps were handled through conservative range assumptions that were then rechecked in interviews and adjusted only when multiple respondents aligned on the same direction. For forecasting, scenario analysis was used alongside indicator outlooks agreed by experts, so upside and downside cases could be linked back to construction activity and fuel cost assumptions rather than a single trend line.
Data Validation & Update Cycle
Validation was done through triangulation between the model outputs and independent signals, such as regional construction pipelines, rental share indicators, and fuel cost movements that typically change total cost of ownership. Variance checks were run across regions and ownership models, and any outliers were reviewed again before final sign-off so the totals stayed consistent with how fleets and purchases behave in the real world.
The workflow uses multiple analyst reviews, and re-contact triggers are used when a key assumption moves materially, such as a sudden shift in construction activity or a step change in diesel pricing. Reports are refreshed annually, and interim updates are made when major events materially affect demand. Before delivery, a final pass is completed to ensure the most recent public releases and primary feedback are reflected.
Mordor Intelligence's Light Tower Market Estimate Compared With Other Published Estimates
Published market sizes for light towers can differ a lot, even when the product name looks the same, because the counted revenue pool is not always aligned. Differences usually come from what is treated as a light tower versus adjacent lighting equipment, whether rental and leasing is counted as part of the market value, and how near-term currency and pricing are applied.
Fixed installed lighting systems sit outside Mordor Intelligence's scope definition for the light tower market, which keeps the totals focused on temporary illumination equipment rather than broader lighting categories. The remaining spread across figures is also influenced by whether ownership models are captured as equipment value only or blended with rental service economics, plus how quickly LED and hybrid pricing is assumed to shift across regions.
Benchmark comparison
| Source | Market Size | Gaps in Research Methodology |
|---|---|---|
| Mordor Intelligence | USD 4.87 B (2025) | |
| Global Consultancy A | USD 2.39 B (2024) | Uses an earlier base year and appears to apply a narrower product or channel scope, with unclear treatment of rental or leased fleets, which can reduce the captured revenue pool. |
| Industry Publisher B | USD 2.54 B (2025) | Likely emphasizes equipment sales value and may not fully reconcile ownership model splits, and it can also differ on ASP progression assumptions for LED and hybrid units across regions. |
Overall, the comparison shows that the biggest differences come from scope coverage around adjacent lighting categories and how ownership models are valued. By tying assumptions to observable demand drivers like construction activity and fleet replacement behavior, the output stays traceable to clear inputs that can be rechecked and updated in repeatable steps.


Key Questions Answered in the Report
What is the expected growth rate for the light tower market between 2026 and 2031?
The market is projected to expand at a 4.32% CAGR, rising from USD 5.08 billion in 2026 to USD 6.28 billion by 2031.
Why are LED light towers preferred over metal-halide models?
LED units reduce fuel consumption, extend bulb life beyond 50,000 hours, and improve light quality, resulting in lower operating costs and compliance with stricter emission and noise rules.
How significant is the rental segment in the light tower market?
Rental providers accounted for 67.40% of equipment deployment in 2025 and continue to grow at 5.18% CAGR because contractors favor flexible, project-based access to the latest compliant technology.
Which region is forecast to grow the fastest, and what drives this growth?
Asia Pacific leads with a 5.12% CAGR, supported by large-scale mining projects, rapid urbanization, and sizable investments in renewable-energy infrastructure.
How are emission regulations influencing product development?
Tier-4 and Stage V standards push manufacturers toward hybrid and battery-dominant designs that cut exhaust and fuel use, driving R&D into advanced engines, battery packs, and hydrogen fuel cells.
What challenges limit wider adoption of hydrogen-fuel light towers?
High upfront costs and limited refueling infrastructure currently restrain widespread uptake, although ongoing investment in hydrogen hubs is expected to lower barriers over the medium term.
Page last updated on:


 Your data is secure and never sold or shared.


