Market Overview
| Study Period | 2020 - 2031 |
|---|---|
| Forecast Data Period | 2026 - 2031 |
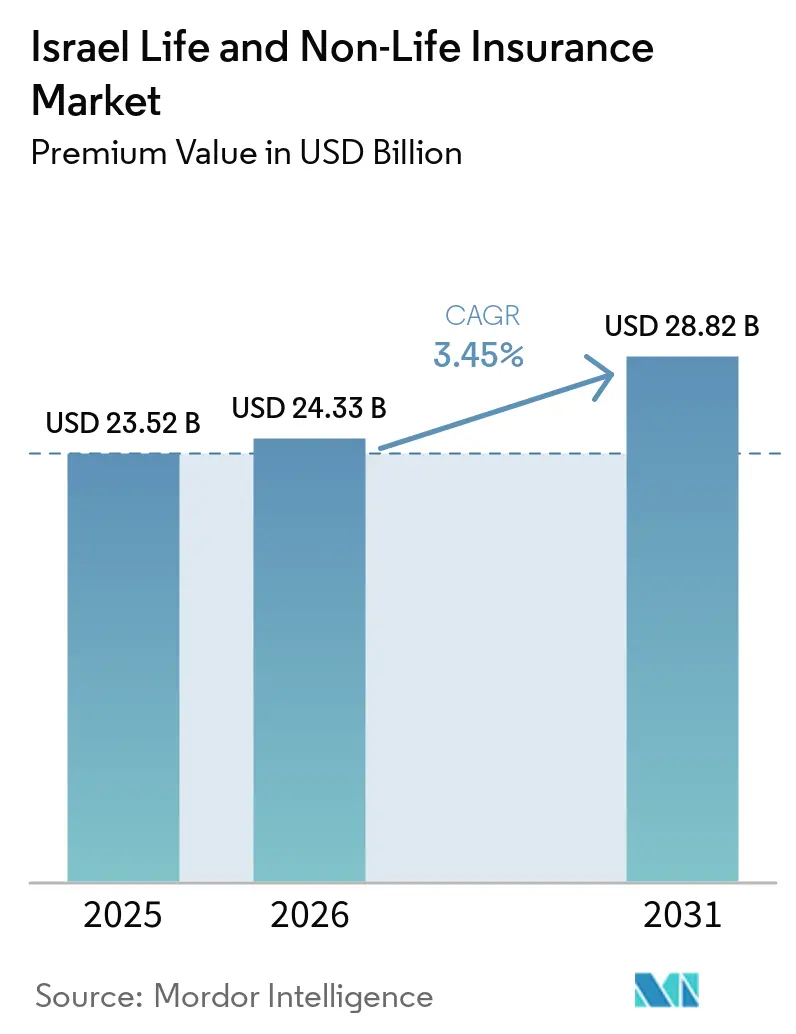
| Base Year Market Size (2025) | USD 23.52 Billion |
| Market Size (2026) | USD 24.33 Billion |
| Market Size (2031) | USD 28.82 Billion |
| Growth Rate (2026 - 2031) | 3.45% CAGR |
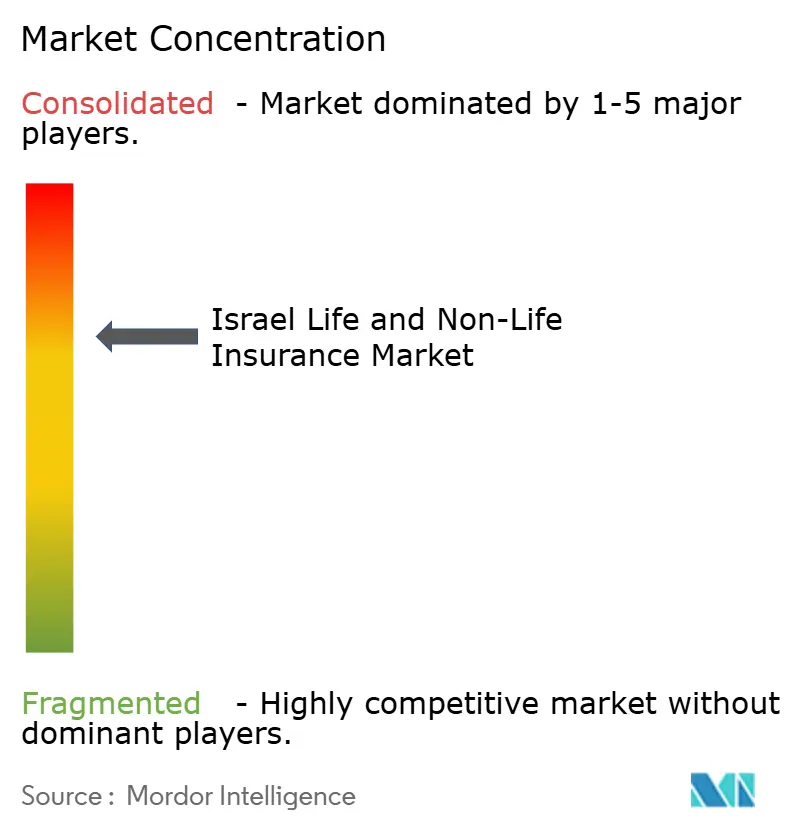
| Market Concentration | Medium |
Major Players *Disclaimer: Major Players sorted in no particular order Image © Mordor Intelligence. Reuse requires attribution under CC BY 4.0. | |
Israel Life and Non-Life Insurance Market Analysis by Mordor Intelligence
The Israel Life And Non-Life Insurance Market size in terms of premium value is projected to expand from USD 23.52 billion in 2025 and USD 24.33 billion in 2026 to USD 28.82 billion by 2031, registering a CAGR of 3.45% between 2026 to 2031.
Solid macro-economic fundamentals—unemployment near 2.5% and inflation easing toward 2.8%—anchor the market’s steady expansion despite regional tensions. Compulsory motor cover, supplemental health policies, and rising cyber protection continue to lift non-life demand, while tax-favored retirement products reinforce life uptake. Digital distribution is widening access to micro-policies and accelerating price transparency, encouraging product experimentation. Competitive intensity remains moderate; the five largest carriers command 58% of general premiums, yet nimble InsurTech entrants are capturing high-growth niches.
Key Report Takeaways
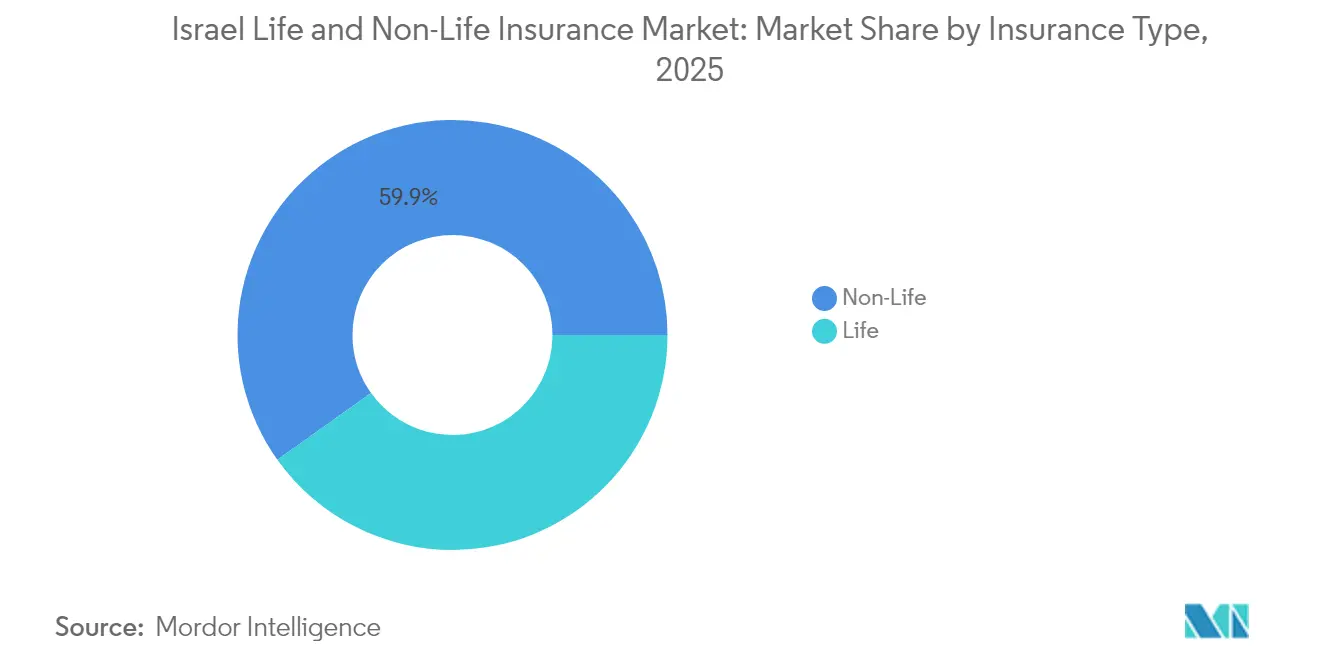
- By insurance type, non-life led with 59.85% of the Israel life and non-life insurance market share in 2025, while life is projected to expand at a 4.32% CAGR to 2031.
- By distribution channel, agents and tied representatives held 41.65% of the Israel life and non-life insurance market in 2025; digital-only/InsurTech platforms are on track for an 10.95% CAGR through 2031.
- By geography, the Central District commanded 35.40% of the Israel life and non-life insurance market in 2025, whereas the Southern District is forecast to grow at 5.55% CAGR between 2026 to 2031.
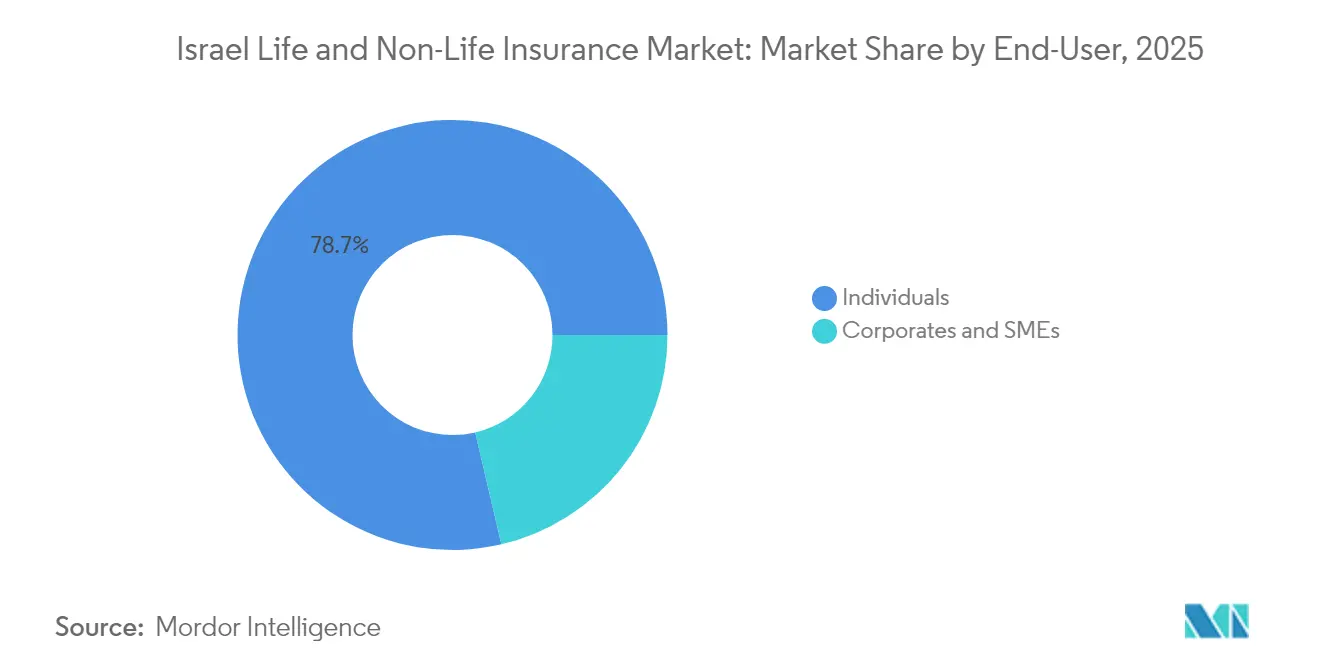
- By end-user, individuals accounted for 78.65% of the Israel life and non-life insurance market size in 2025, but the corporate and SME segment is advancing at a 5.86% CAGR through 2031.
Note: Market size and forecast figures in this report are generated using Mordor Intelligence’s proprietary estimation framework, updated with the latest available data and insights as of 2026.
Israel Life and Non-Life Insurance Market Trends and Insights
Drivers Impact Analysis*
| Driver | (~) % Impact on CAGR Forecast | Geographic Relevance | Impact Timeline |
|---|---|---|---|
| Compulsory MTPL law | +0.8% | Central & Jerusalem Districts | Short term (≤ 2 years) |
| National health fund reforms | +0.7% | National | Medium term (2-4 years) |
| Pension & annuity tax revisions | +0.6% | Affluent urban areas | Medium term (2-4 years) |
| High FinTech adoption | +0.5% | Central District | Medium term (2-4 years) |
| Cyber-Attack Incidents on Critical Infrastructure Elevating Corporate Cyber Cover Demand | +0.4% | National, with concentration in industrial and technology hubs | Short term (≤ 2 years) |
| Rising Car-Leasing Culture Among SMEs Accelerating Fleet Insurance | +0.3% | Central and Haifa Districts | Medium term (2-4 years) |
| Source: Mordor Intelligence | |||
Compulsory Motor Third-Party Liability (MTPL) Law Driving Non-Life Premium Uptake
Israel’s strictly enforced MTPL requirement delivers reliable premium inflows that stabilize the Israel life and non-life insurance market during economic swings. AIG Israel’s gross earned premiums rose 9.7%[1]AIG Israel, “Interim Financial Report Q1 2025,” aig.co.il to NIS 567.1 million in Q1 2025, with vehicle lines contributing the most. Insurers are refining digital issuance and claim tools to handle high-volume motor business efficiently, turning the mandatory cover into a springboard for cross-selling voluntary motor and personal accident products. Predictable cash flows from compulsory cover are also free capital for innovation across less-regulated segments.
Government-Mandated National Health Insurance Fund Reforms Stimulating Supplemental Health Policies
The 2023 reform obliges each health plan to partner with at least four hospitals, enlarging patient choice and exposing coverage gaps. Carriers are packaging tiered supplemental health products that guarantee quicker access to premium care, addressing rising customer expectations. The academic analysis notes that these reforms broaden patient empowerment and spur complementary insurance demand[2]Gideon Leibner et al., “Challenging Selective Contracting: Reforms for Enhancing Patient Empowerment in Healthcare,” Israel Journal of Health Policy Research, ijhpr.org. Enhanced transparency has pushed insurers to publish clearer benefit schedules and roll out digital comparison tools, raising trust and nudging uptake among middle-income households.
Pension & Annuity Tax Revisions Boosting Individual Life-Savings Products
Tax revisions on pensions and annuities are fueling growth in Individual life savings products. With the backing of generous fiscal incentives like matching contributions and tax-exempt allowances, unit-linked life contracts have surged, now representing over 60% of total life premiums. In a bid to attract younger professionals, insurance carriers have rolled out robo-advice modules. These tools pinpoint retirement gaps and also highlight the advantages of compound tax benefits. Bolstered by a supportive tax code, these inflows provide a buffer for life insurers against the whims of short-term capital market fluctuations, paving the way for anticipated growth in both the life and non-life segments of Israel's insurance market[3]OECD, “Annual Survey on Financial Incentives for Retirement Savings,” oecd.org.
High FinTech Adoption Enabling Digital-Only Micro-Policies
Seventeen homegrown InsurTech firms are crafting a diverse array of products, from digital asset coverage to "pay as you live" micro policies. EasySend's no-code platform and Notch's crypto wallet protection showcase the efficiency of cloud architectures, which can expedite launch cycles and cut distribution costs. Digital onboarding resonates with Millennial and Gen-Z consumers, who demand instant, usage-based coverage. With venture funding, exemplified by Novidea's USD 30 million raise in 2024, the product diversity is set to expand, intensifying competition against traditional channels in Israel's life and non-life insurance market.
Restraints Impact Analysis*
| Restraint | (~) % Impact on CAGR Forecast | Geographic Relevance | Impact Timeline |
|---|---|---|---|
| Heightened Reinsurance Costs Owing to Regional Geopolitical Tensions | -0.7% | National, with higher impact on property and casualty lines | Medium term (2-4 years) |
| Capital-Adequacy Tightening by the Capital Markets, Insurance & Savings Authority (CMISA) | -0.5% | National | Medium term (2-4 years) |
| Interest-Rate Volatility Reducing Investment Income Margins | -0.4% | National, with higher impact on life insurers | Short term (≤ 2 years) |
| Price-Cap Regulation on Management Fees Compressing Life Profitability | -0.3% | National | Long term (≥ 4 years) |
| Source: Mordor Intelligence | |||
Heightened Reinsurance Costs Owing to Regional Geopolitical Tensions
The Iron Swords conflict has raised reinsurance prices and tightened terms on property and infrastructure risks. Primary carriers are retaining larger net lines or turning to captives and parametric covers to bridge capacity gaps. Elevated retrocession premiums compress margins and may slow policy issuance in higher-risk zones, tempering the overall expansion of the Israel life and non-life insurance market.
Capital-Adequacy Tightening by the Capital Markets, Insurance & Savings Authority
CMISA’s revised solvency circulars elevate capital buffers and governance standards. Smaller insurers face higher funding costs and may downscale growth plans to preserve ratios. Larger groups exploit diversified earnings to comply, but even they are automating functions to offset the incremental capital drag. Stricter oversight improves systemic resilience, yet it marginally limits top-line acceleration until new capital is raised.
*Our forecasts treat driver/restraint impacts as directional, not additive. The impact forecasts reflect baseline growth, mix effects, and variable interactions.
Segment Analysis
By Insurance Type: Regulatory Reforms Reshape Growth Trajectories
Non-life generated 59.85% of the Israel life and non-life insurance market in 2025, anchored by compulsory motor and expanding supplemental health lines. Motor telematics, AI-driven fraud analytics, and usage-based pricing foster underwriting precision, sustaining stable combined ratios. Health premiums climbed in Q1 2025 as carriers responded to post-reform consumer demand with tiered products and wellness add-ons. Property coverage, though bruised by costlier reinsurance, benefits from IoT-enabled risk surveys that refine capital allocation. Liability classes, notably cyber, are gaining corporate attention, lifting non-life fee income.
Life insurance trails in absolute scale yet is projected to grow faster at 4.32% CAGR through 2031, buoyed by tax-advantaged savings plans. Unit-linked contracts, now exceeding 60% of life premiums, blend protection and investment, matching household wealth aspirations. Term cover is popular among younger borrowers seeking mortgage collateral, while whole-life and endowment policies cater to estate planning. Group life offered through employers streamlines acquisition costs. This dual-track expansion ensures the Israel life and non-life insurance market size for life products maintains structural momentum.


By Distribution Channel: Digital Platforms Disrupt Traditional Networks
Agents and tied representatives retained 41.65% of total premiums in 2025, reflecting deep client ties and advisory clout in complex lines. Many agencies deploy AI chatbots from firms such as LeO to expedite onboarding and support, reinforcing relevance even as digital rivals scale. Independent brokers dominate bespoke marine, aviation, and high-value property placements, leveraging international reinsurance links.
Digital-only platforms, however, are the fastest-growing route, advancing at an 10.95% CAGR to 2031. Seamless apps deliver quote-to-bind journeys within minutes, appealing to time-pressed consumers. InsurTech innovators bundle micro-policy offers with lifestyle apps, capturing granular data for dynamic pricing. Bancassurance leverages trust in household banks, but regulatory firewalls cap cross-selling depth. Hybrid insurers now operate omnichannel, aligning face-to-face expertise with online self-service to defend share across the Israel life and non-life insurance market.
By End-User: Corporate Segment Gains Momentum
Individuals generated 78.65% of premiums in 2025, reflecting compulsory motor coverage and rising health awareness. Smartphone adoption has eased comparison shopping, nudging insurers toward transparent fees and modular riders. Tax support for long-term savings keeps life demand resilient, while micro-duration travel and gadget cover entice younger buyers.
Corporate and SME policies, although smaller, are set for a 5.86% CAGR through 2031 as cyber threats and fleet-leasing culture proliferate. Financial firms note cyber events costing the sector USD 12 billion since 2004, pushing demand for integrated risk and indemnity solutions. Element Fleet Management’s insurance arm reports heightened fleet cover uptake among leasing clients. Sector-specific liability and supply-chain interruption products round out corporate portfolios, gradually enlarging this slice of the Israel life and non-life insurance industry.
Geography Analysis
In 2025, the Central District, encompassing Tel Aviv, accounted for 35.40% of premiums, solidifying its role as the economic powerhouse of Israel's life and non-life insurance sectors. The Tel Aviv Insurance Index's impressive 22% year-to-date surge, buoyed by robust capital market performance, has bolstered disposable incomes and also heightened the appetite for advanced insurance coverage. With corporate headquarters densely packed in this district, there is a pronounced demand for cyber insurance, directors’ liability coverage, and group health plans. Furthermore, local InsurTech start-ups are testing their innovations here before rolling them out on a national scale, amplifying the region's reputation as a hub of insurance innovation.
The Southern District is the fastest-growing region, poised for a 5.55% CAGR to 2031 as infrastructure projects and population inflows widen risk exposures. Residential construction spurs mortgage-linked life and property covers. Government incentives for manufacturing parks create opportunities for commercial multiline packages. Lloyd’s Israel hub extends access to specialized property and energy placements across 60 lines, supporting regional capacity. Unique climatic and security exposures prompt parametric product development tailored to local hazards, diversifying the Israel life and non-life insurance market.
Jerusalem’s market is stable, underpinned by public-sector employment and tourism. Specialized pilgrimage travel and artifact indemnity policies meet niche needs. The Haifa and Northern Districts combine port logistics and petrochemical complexes; marine, cargo, and environmental liability covers prevail. Increased focus on business-interruption policies follows security incidents, and carriers employ granular geospatial pricing to balance risk. Nationwide, conflict dynamics lead underwriters to monitor accumulation limits carefully to sustain solvency within the Israel life and non-life insurance market size boundaries.
Competitive Landscape
The Israel life & non-life insurance market is moderately concentrated, where the top five players hold the major shares. Harel, Phoenix, and Clal use diversified portfolios and omnichannel distribution to protect scale advantages. Harel posted revenue of shekel 24.25 billion and a 115% share-price rise over the past year, underscoring investor confidence. Phoenix recorded NIS 568 million comprehensive income in Q1 2025, underpinned by a 43% jump in asset-management earnings.
Digital transformation is the dominant strategic theme. Carriers deploy AI underwriting engines and straight-through claims processing to compress cycle times. Partnerships flourish, and Aon’s acquisition of Atlas Insurance deepens marine capabilities. Munich Re’s USD 2.6 billion purchase of Next Insurance highlights the global appetite for local InsurTech talent. Scale players pursue venture investments to capture niche technologies early, while regional specialists exploit agility to offer tailored products, ensuring healthy rivalry across the Israel life and non-life insurance market.
International reinsurers remain selective yet still view Israel’s disciplined underwriting and digital expertise as attractive. Domestic carriers differentiate through integrated wellness platforms, loyalty ecosystems, and ESG-centric investment portfolios. Over the medium term, consolidation may accelerate if solvency demands rise, nudging smaller underwriters toward mergers or niche specialization within the Israel life and non-life insurance industry.
Israel Life and Non-Life Insurance Industry Leaders
Harel Insurance Investments & Financial Services Ltd.
Phoenix Holdings Ltd.
Clal Insurance Enterprises Holdings Ltd.
Menora Mivtachim Holdings Ltd.
Migdal Insurance & Financial Holdings Ltd.
- *Disclaimer: Major Players sorted in no particular order

Recent Industry Developments
- April 2025: Aon acquired Atlas Insurance Agency, expanding its marine offerings in Israel.
- March 2025: Munich Re bought the remaining 71% of Next Insurance for USD 2.6 billion, integrating it into ERGO Group.
- February 2025: Harel Insurance Investments & Financial Services reached a market cap of ₪14.73 billion with revenue of ₪24.25 billion.
- January 2025: Seventeen Israeli InsurTech firms, including Notch and EasySend, offer advanced digital-asset and no-code solutions.
- April 2024: Novidea secured USD 30 million in Series C funding to support global expansion.
- March 2024: CMISA issued revised governance circulars to strengthen compliance requirements.
- February 2024: The Israel Innovation Authority launched Yozma Fund 2.0, channeling USD 155 million to institutional investors, including insurers, for VC allocations.


Research Methodology Framework and Report Scope
Market Definitions and Key Coverage
Our study defines Israel's life and non-life insurance market as all gross written premiums collected by locally licensed insurers across life protection, savings-linked life, health, motor, property, liability, and specialty covers that are sold to individuals or enterprises within Israel.
Scope Exclusion: Reinsurance cessions, investment-only pension fund flows, and overseas branches are outside this analysis.
Segmentation Overview
- By Insurance Type
- Life
- Term Life
- Whole & Endowment
- Annuities & Pension
- Group Life
- Non-Life
- Health (Supplemental & Long-Term Care)
- Motor
- Property (Homeowners, Commercial Property)
- Liability (General, Professional, Product)
- Travel & Personal Accident
- Life
- By Distribution Channel
- Agents & Tied Representatives
- Independent Brokers
- Direct (Insurer Branch)
- Bancassurance
- Digital-Only / InsurTech Platforms
- By End-User
- Individuals
- Corporates & SMEs
- By Region (Israel)
- Central District (incl. Tel Aviv)
- Jerusalem District
- Haifa & Northern Districts
- Southern District
Detailed Research Methodology and Data Validation
Primary Research
We interviewed underwriting managers, digital-only start-ups, agency heads, and policy-holders across Tel Aviv, Haifa, and Be'er Sheva. Discussions clarified product mix shifts, average selling prices, lapse behavior, and emerging cyber-risk take-up, letting us reconcile desk findings and refine assumptions.
Desk Research
We began with statutory data released by the Capital Market, Insurance and Savings Authority, monthly premium filings, and Bank of Israel financial-stability bulletins, followed by macro inputs from the Central Bureau of Statistics, OECD Insurance Indicators, and World Bank Sigma datasets. Company 10-Ks, investor decks, and press releases enriched carrier-level splits, while journals such as Insurance Post and academic work on actuarial reserving provided contextual ratios. Select paid databases, including D&B Hoovers for insurer financials and Dow Jones Factiva for deal tracking, were accessed by Mordor analysts to cross-verify figures. This list is illustrative; additional public and subscription sources were consulted throughout the project.
Market-Sizing and Forecasting
A top-down premium pool reconstruction was built from official life and non-life writings, then stress-tested with sampled channel ASP multiplied by policy volumes and carrier roll-ups to catch under-reported niches. Key drivers modeled include vehicle parc growth, disposable income per capita, supplemental health uptake, capital adequacy rules, inflation-adjusted ASP drift, and InsurTech penetration. We applied multivariate regression to forecast 2026 to 2030 premiums, with scenario bounds agreed during expert calls. Any bottom-up gaps, for example in niche liability lines, were bridged by interpolating peer ratios and validated against shipment-level motor data.
Data Validation and Update Cycle
Outputs pass three-step variance checks, peer review, and management sign-off. Models refresh annually; mid-cycle updates are triggered when regulation, interest rates, or catastrophic losses materially alter assumptions. Clients therefore receive an always current view.
Why Mordor's Israel Life and Non-Life Insurance Baseline Stands Firm
Published market values often diverge because firms pick different scopes, base years, and currency treatments.
Major gap drivers are a narrow focus on direct premiums only, inclusion of provident fund assets, or static exchange rates that mute inflation-linked shekel movements. Mordor's disciplined scope and yearly refresh avoid such pitfalls, yielding the most decision-ready baseline.
Benchmark comparison
| Market Size | Anonymized source | Primary gap driver |
|---|---|---|
| USD 23.52 B (2025) | Mordor Intelligence | - |
| USD 15 B (2025) | Regional Consultancy A | Excludes savings-linked life and health riders; generic macro uplift only |
| USD 25 B (2024) | Industry Analyst B | Adds pension and provident funds; optimistic scenario layering |
| USD 22 B (2023) | Trade Journal C | Older base year; fixed 2023 FX; omits retrocession adjustments |
In sum, by anchoring estimates to regulator-verified data, cross-checking with carrier disclosures, and refreshing variables each year, Mordor Intelligence supplies a balanced, transparent baseline that managers can trace back to clear inputs and repeatable steps.


Key Questions Answered in the Report
What is the current value of the Israel life and non-life insurance market?
The market stands at USD 24.33 billion in 2026 and is forecast to reach USD 28.82 billion by 2031.
Which segment holds the largest Israel life and non-life insurance market share?
Non-life insurance leads, accounting for 59.85% of premiums in 2025.
How fast is the digital distribution channel growing?
Digital-only and InsurTech platforms are projected to grow at an 10.95% CAGR between 2026-2031.
What region shows the fastest premium growth?
The Southern District is forecast to expand at 5.55% CAGR, outpacing other regions.
Why are cyber insurance policies gaining traction among Israeli businesses?
A surge in sophisticated cyber attacks and related financial losses—estimated at USD 12 billion for global financial firms since 2004—has heightened corporate risk awareness, driving demand for specialized cover.
How are regulatory changes affecting carrier profitability?
CMISA’s tighter capital standards and caps on management fees press margins, prompting insurers to invest in automation and diversify revenue streams
Page last updated on:


