Launch Vehicle Avionics Market Size and Share
Market Overview
| Study Period | 2019 - 2030 |
|---|---|
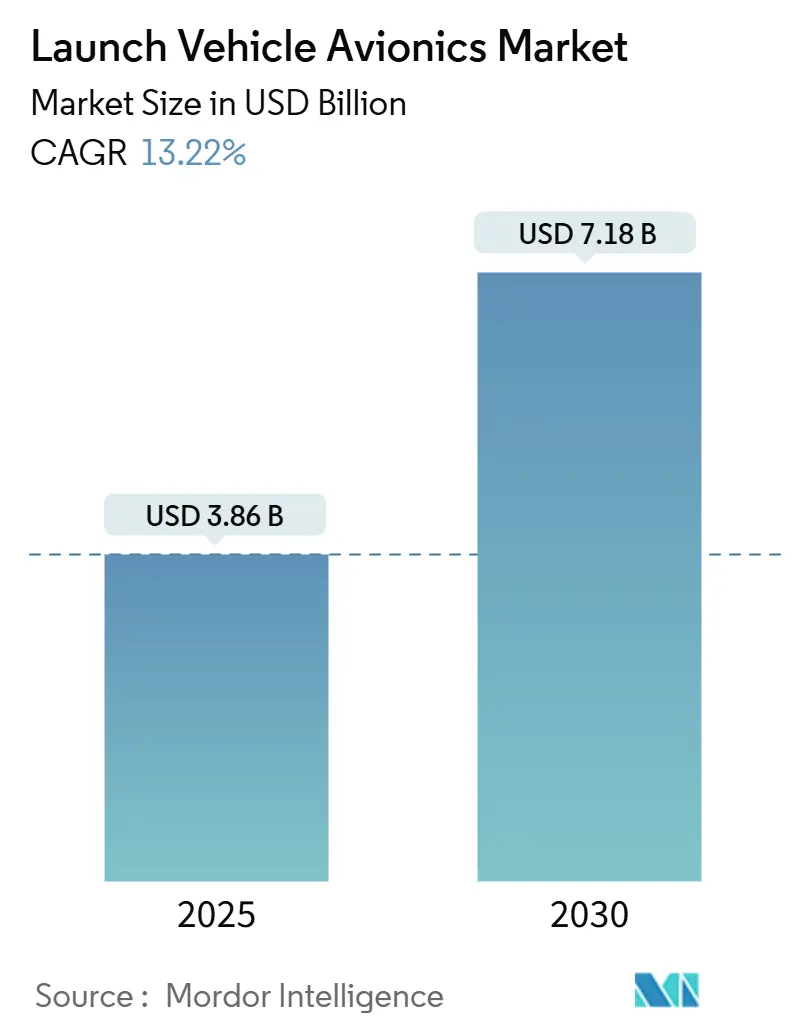
| Market Size (2025) | USD 3.86 Billion |
| Market Size (2030) | USD 7.18 Billion |
| Growth Rate (2025 - 2030) | 13.22% CAGR |
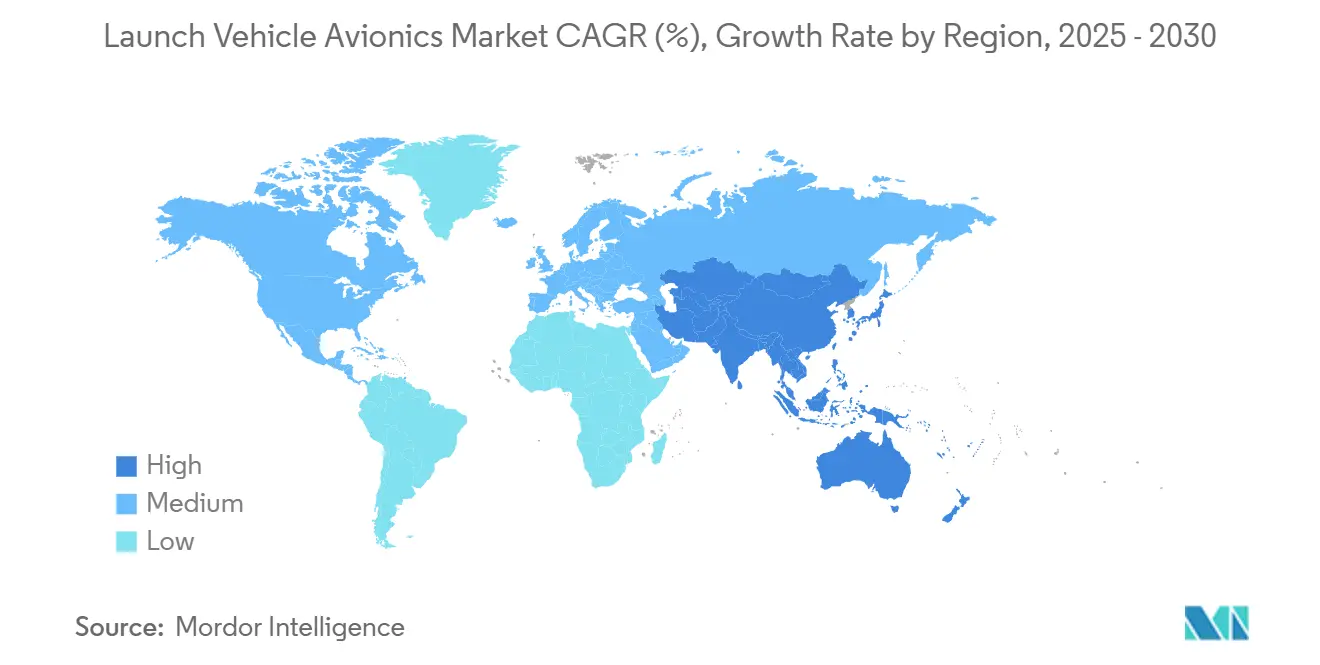
| Fastest Growing Market | Asia Pacific |
| Largest Market | North America |
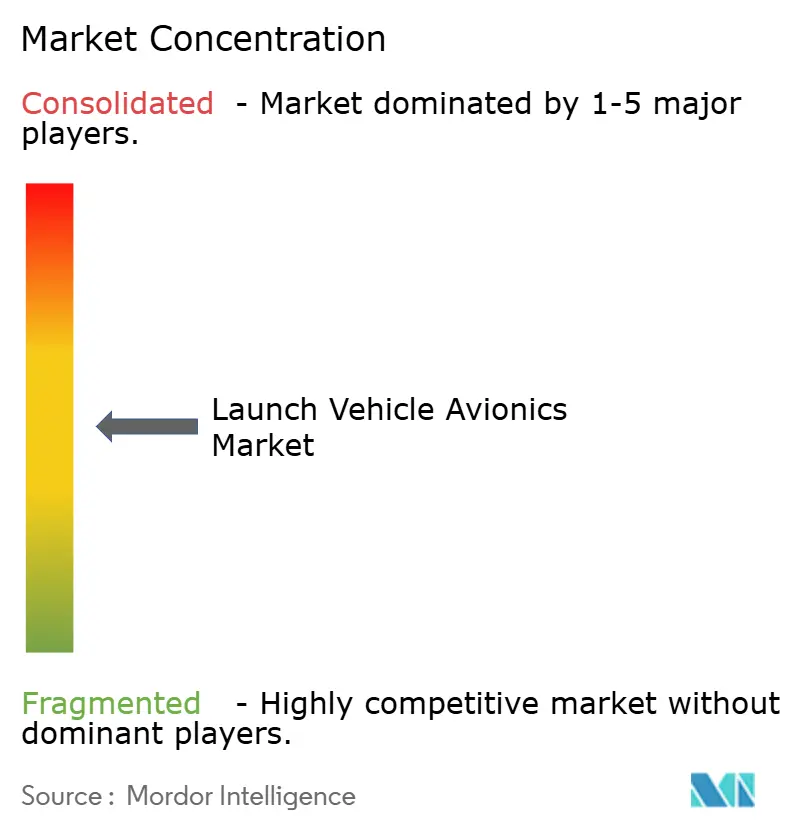
| Market Concentration | Medium |
Major Players *Disclaimer: Major Players sorted in no particular order Image © Mordor Intelligence. Reuse requires attribution under CC BY 4.0. | |
Launch Vehicle Avionics Market Analysis by Mordor Intelligence
The launch vehicle avionics market size reached USD 3.86 billion in 2025 and is forecasted to advance at a 13.22% CAGR, lifting value to USD 7.18 billion by 2030. This rapid trajectory reflects the sector’s pivot to reusable platforms that demand rugged, high-cycle electronics and the record 263 global launches logged in 2024.[1]Source: Elon Musk, “Starlink Mission Updates and Launch Statistics,” SpaceX, spacex.com Growing small-satellite constellations, expanding government deep-space programs, and falling component costs collectively push the launch vehicle avionics market toward standardized, scalable architectures. Suppliers that couple radiation-hardened hardware with software-defined flexibility now capture procurement priority, while semiconductor shortages and cybersecurity certification backlogs temper near-term expansion. Competitive intensity remains moderate as primes such as Northrop Grumman and Thales defend share against nimble entrants like Rocket Lab and Aurora. Still, the breadth of opportunities keeps barriers to exit low and the launch vehicle avionics market open to specialized innovators.
Key Report Takeaways
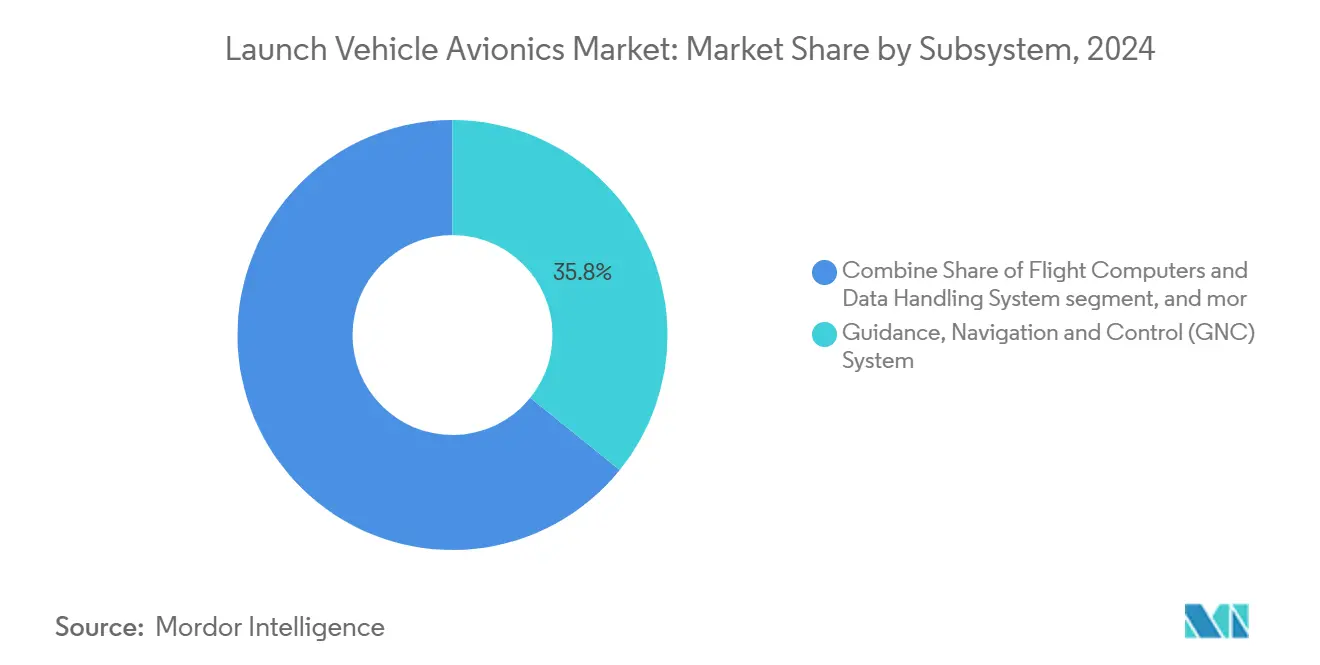
- By subsystem, guidance, navigation, and control systems led with 35.80% of the launch vehicle avionics market share in 2024, while telemetry, tracking, and command systems are projected to expand at a 15.20% CAGR through 2030.
- By launch-vehicle class, small vehicles below 1,000 kg commanded 47.30% share of the launch vehicle avionics market size in 2024 and are expected to grow at a 14.60% CAGR over the forecast horizon.
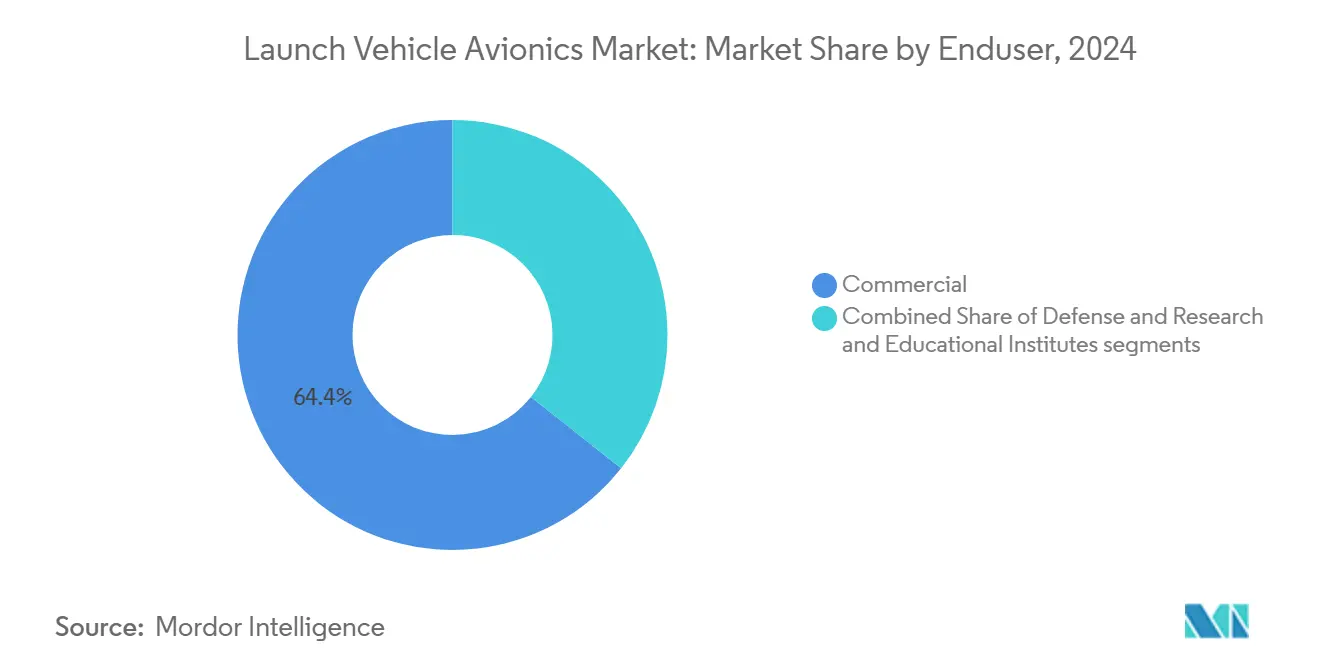
- By end user, commercial operators held a 64.35% share in 2024; research and educational institutes are advancing at a 14.87% CAGR to 2030 as democratized access drives incremental demand.
- By geography, North America accounted for 44.20% of 2024 revenue, while Asia-Pacific is set to register the fastest regional CAGR at 14.85% to 2030, driven by China, India, and Japan’s expanding programs.
Global Launch Vehicle Avionics Market Trends and Insights
Drivers Impact Analysis*
| Driver | (~)% Impact on CAGR Forecast | Geographic Relevance | Impact Timeline |
|---|---|---|---|
| Surge in small-satellite constellations driving launch cadence | +2.5% | Global — North America and Asia-Pacific hubs | Medium term (2-4 years) |
| Reusable launch vehicles demanding high-cycle avionics | +2.8% | North America and EU, expanding into Asia-Pacific | Long term (≥4 years) |
| Government deep-space programs requiring radiation-hardened systems | +1.9% | North America and Europe, emerging Asia-Pacific | Long term (≥4 years) |
| Advances in low-cost COTS miniaturized components | +2.1% | Global, manufacturing density in Asia-Pacific | Short term (≤2 years) |
| Autonomous in-flight range safety systems adoption | +1.7% | North America and EU, regulatory spillover worldwide | Medium term (2-4 years) |
| VC funding for digital-twin and AI-centric avionics startups | +1.8% | Funding concentration in North America and Europe | Short term (≤2 years) |
| Source: Mordor Intelligence | |||
Surge in Small-Satellite Constellations Driving Launch Cadence
Record constellation build-outs are rewriting demand curves within the launch vehicle avionics market. Starlink alone required 96 dedicated launches in 2024, and parallel networks from Amazon, OneWeb, and regional newcomers add a relentless cadence that compresses integration timelines. Operators now insist on avionics that can complete pre-launch validation in days rather than weeks, prompting suppliers to embed quick-connect harnesses, automated software loads, and digital-twin verification tools. Predictable replacement schedules for aging constellation spacecraft create rolling upgrade windows, ensuring the launch vehicle avionics market benefits from steadier order flows than the episodic programs of the expendable-rocket era. Regulators at the Federal Communications Commission and International Telecommunication Union have streamlined licensing for mega-constellations, eliminating bureaucratic bottlenecks that once throttled launch rates and reinforcing sustained avionics procurement cycles.
Reusable Launch Vehicles Demanding High-Cycle Avionics
Falcon 9 boosters have surpassed 20 reflights, proving that avionics must now survive dozens of thermal, vibro-acoustic, and re-entry stress cycles without performance drift. This shift forces suppliers to enhance solder-joint fatigue resistance, specify wider operational temperature margins, and integrate health-monitoring firmware that flags degradation before it jeopardizes mission assurance. The economics are compelling: amortizing USD 3 million of avionics hardware across 10 flights cuts per-mission cost by roughly 70% according to operator disclosures. The launch vehicle avionics market rewards vendors capable of certifying systems for 15 or more cycles under NASA NPR 8705.4 and ESA ECSS regimes. Blue Origin’s New Glenn and Rocket Lab’s Neutron amplify this demand signal, broadening the customer base for high-cycle avionics well beyond SpaceX.
Government Deep-Space Programs Requiring Radiation-Hardened Systems
NASA’s Artemis and ESA’s Hera missions need electronics that endure multi-year radiation exposure far from Earth’s magnetosphere.[2]Source: NASA, “Artemis Program Overview and Contractor Awards,” nasa.gov Contract awards topping USD 4.2 billion for lunar systems allocate sizable budgets to flight computers, power-conditioning units, and inertial sensors hardened to withstand total ionizing doses exceeding 100 krad(Si). Such specifications elevate unit pricing, enabling margins that offset the smaller production volumes typical of exploration vehicles. Therefore, the launch vehicle avionics market is segmented into high-value, low-volume deep-space programs versus price-sensitive, high-volume LEO launchers, giving diversified suppliers a hedge against cyclical commercial swings. Compliance with ECSS-Q-ST-60-15C and MIL-STD-883 further entrenches incumbents with certified product lines.
Advances in Low-Cost COTS Miniaturized Components
Gallium-nitride (GaN) power devices and system-on-chip microcontrollers sourced from high-volume terrestrial fabs now achieve Technology Readiness Level 9 for spaceflight, slashing procurement lead times from 52 weeks to under 20 weeks for many non-critical avionics cards. The flight heritage amassed through CubeSat programs gives launch vehicle prime contractors confidence to migrate COTS parts into primary flight computers and sensor suites. Asian fabrication clusters in Taiwan and South Korea deliver cost reductions of up to 45% versus bespoke rad-hard lines, an advantage especially pivotal for the small-launcher segment that anchors nearly half of the launch vehicle avionics market. While parts still require up-screening for shock, vibe, and lot-acceptance radiation tests, the aggregate savings expand margins and encourage iterative design improvements at an annual, not decadal, cadence.
Restraints Impact Analysis*
| Restraint | (~)% Impact on CAGR Forecast | Geographic Relevance | Impact Timeline |
|---|---|---|---|
| High qualification and radiation-hardening costs | -1.8% | Global, highest in emerging space nations | Long term (≥4 years) |
| Supply-chain shortages of radiation-hardened semiconductors | -1.2% | Global, acute in Asia-Pacific | Medium term (2-4 years) |
| Cybersecurity certification delays for software-defined avionics | -0.9% | North America and EU, spreading worldwide | Short term (≤2 years) |
| Vibro-acoustic fatigue limiting re-use cycles | -1.1% | Global, affects all reusable fleets | Long term (≥4 years) |
| Source: Mordor Intelligence | |||
High Qualification and Radiation-Hardening Costs
Securing ECSS or MIL-STD flight heritage can consume 40–60% of a new avionics program’s budget, putting state-of-the-art designs beyond the reach of many small launch startups. Component vendors must run total ionizing dose, single-event latch-up, and proton displacement tests that extend development by as much as two years. Because production runs often total fewer than 300 units, amortizing USD 30 million of qualification spending inflates per-board pricing well above commercial norms. Therefore, the launch vehicle avionics market sees a bifurcation: primes absorb costs to protect deep-space contracts, while cash-constrained entrants default to COTS parts and accept limited mission scope.
Supply-Chain Shortages of Rad-Hard Semiconductors
The CHIPS and Science Act directs USD 52 billion toward domestic fabs, yet rad-hard wafers still rely on a handful of foundries worldwide, yielding lead times that soared past 70 weeks in early 2025.[3]Source: U.S. Congress, “CHIPS and Science Act of 2022,” congress.gov Single-source dependencies elevate program risk; a missed delivery from Microchip or BAE can derail an entire vehicle qualification schedule. Emerging Asia-Pacific launch ventures remain particularly vulnerable because export controls often restrict Western rad-hard imports, forcing them to redesign for less-proven local alternatives. Such delays subtract up to 1.2 percentage points from the projected CAGR of the launch vehicle avionics market.
*Our forecasts treat driver/restraint impacts as directional, not additive. The impact forecasts reflect baseline growth, mix effects, and variable interactions.
Segment Analysis
By Subsystem: GNC Dominance Meets Telemetry Momentum
GNC systems held 35.80% of 2024 revenue, preserving its role as the cerebral hub of any launch vehicle. That dominance stems from stringent fault-tolerance mandates and the premium price points that triple-redundant inertial systems command within the launch vehicle avionics market. Yet telemetry, tracking, and command systems, aided by booming constellation operations, are growing at 15.20% CAGR, signaling that operators value real-time data links and separation-sequence orchestration as much as raw trajectory fidelity. The segment’s evolution toward software-defined radios and adaptive error-correction sets a brisk innovation tempo that forces legacy microwave transmitters toward obsolescence. Concurrently, flight computers and data-handling subsystems capitalize on autonomous range-safety requirements, integrating multi-core radiation-tolerant processors that support AI inference for anomaly detection. Electrical power systems adopt gallium-nitride converters to shave mass and improve efficiency across repeated flights, a shift that lessens thermal stress on adjacent avionics cards. Ancillary subsystems, from environmental control to structural health monitoring, claim increasing budget share as mission durations stretch and operators seek predictive maintenance insights.
Vendors that pair heritage navigation algorithms with open-architecture buses safeguard relevance in a landscape tilting toward modularity. Conversely, telemetry suppliers embracing optical downlink prototypes could leapfrog incumbents still refining S-band solutions. Regulatory oversight through RTCA DO-178C compels all subsystem builders to align on deterministic software architectures, nudging the ecosystem toward convergent interface standards that lower integration risk and shorten pad cycles.


By Launch-Vehicle Class: Small Vehicles Recast Value Hierarchy
Small launchers below 1,000 kg payload capacity captured 47.30% of revenue in 2024, propelled by single-orbit constellation drops and rapid rideshare missions that large boosters cannot economically service. Their 14.60% CAGR signals durable momentum that should lift the segment’s launch vehicle avionics market share past 50% before the decade’s end. Compact vehicles are standardized on standard avionics suites, enabling Electron, RS1, and SLV series manufacturers to procure lots of 1,000 units, thereby squeezing cost curves. Despite Falcon 9’s success, Medium rockets face a strategic squeeze: too hefty for dedicated CubeSat lifts yet undersized for emergent heavy-payload lunar logistics, they must differentiate via reliability and price per kilogram. Heavy launchers exceeding 20,000 kg payloads maintain relevance for deep-space and GEO missions; their avionics incorporate triple-mode star trackers and ultrahigh-precision IMUs that command prices 4–5 times higher than small-vehicle equivalents, keeping overall value significant despite launch frequency gaps.
Rocket Lab’s Neutron roadmap exemplifies a hybrid strategy, scaling avionics over common architectures to span multiple mass classes. Space Exploration Technologies Corp.'s (SpaceX’s) internal avionics production privileges vertical integration, but independent suppliers can still secure work by offering drop-in replacements certified for reusable cycles. Interviews with procurement managers suggest that after-sales support and spares availability increasingly influence selection more than unit cost, a nuance shaping the competitive canvas of the launch vehicle avionics market.
By End User: Commercial Hegemony, Educational Ascent
Commercial operators generated 64.35% of 2024 spending, their dominance underpinned by broadband constellations and Earth-observation fleets that require a relentless launch cadence. That leadership should persist as monetization models mature, yet research and educational institutes register the swiftest climb, pacing at 14.87% CAGR through 2030. Lower barriers to entry, such as NASA’s CubeSat Launch Initiative and ESA’s Fly Your Satellite program, let universities deploy vehicles or subsystems once affordable only to nation-states. These customers prioritize intuitive software, plug-and-play sensors, and rapid documentation over maximum radiation resistance, pushing suppliers toward user-friendly designs. While consistent buyers, defense agencies favor long-lived, classified payloads, creating a distinct specification tier—secure processors, tamper-proof enclosures, MIL-STD-1553 buses—that often diverges from commercial standards. The launch vehicle avionics market thus stratifies along mission duration and security needs, permitting niche players to thrive alongside primes.
The commercial segment is eclipsing the combined increment of defense and educational users. However, price sensitivity intensifies as launch costs fall, prompting operators to demand avionics warranties aligned to the entire service contract length, not just single-mission success.
Geography Analysis
North America retained 44.20% of 2024 revenue, powered by 96 Starlink flights, Vulcan Centaur certification, and record NASA procurement, actions that sustained a robust domestic supplier base. The region’s regulatory clarity, mature test ranges, and abundant venture capital reinforce a virtuous innovation cycle that shields market leadership. Launch pads in Florida, California, Virginia, and Alaska ran near a weekly cadence, propelling consistent demand across all avionics subsystems. At the same time, Canada’s small-satellite ambitions and Mexico’s nascent microsat programs added incremental volume.
Asia-Pacific recorded the fastest tempo at 14.85% CAGR, and it is on track to narrow the gap with North America before 2030. China’s Guowang constellation and reusable rocket family anchor massive procurement blocks, much of which are directed to local avionics stalwarts to minimize export-control exposure. India’s 2024 space policy liberalization opened avenues for more than 200 domestic startups, several of which are already booking rideshare contracts that embed Indian-built avionics suites. Japan’s Space One pad near the Kii Peninsula targets 20 missions annually, each specifying modular avionics optimized for short turnaround cycles, elevating regional orders. Collectively, these programs lift the launch vehicle avionics market footprint across Asia-Pacific and encourage supplier localization.
Europe commands a steady market presence through ESA’s Hera, ArianeGroup’s Ariane 6, and Thales’s Argonaut lander, all of which rely on stringent ECSS qualification that favors continental suppliers. Cross-border industrial policies funnel workshares to France, Germany, and Italy, sustaining economies of scale even as overall launch cadence trails North America. The Middle East and Africa represent an embryonic niche; Israel’s Shavit upgrades and South Africa’s micro-launcher concepts create pockets of demand that require export-compliant, ITAR-free avionics solutions, a differentiator for European vendors. In aggregate, geographic diversification lowers systemic risk for the launch vehicle avionics market and steadies supply-chain investment.

Competitive Landscape
The launch vehicle avionics market exhibits moderate concentration. Northrop Grumman Corporation, Thales Group, and L3Harris Technologies, Inc. lean on legacy contracts and vertically integrated manufacturing, anchoring high-reliability niches. Rocket Lab has demonstrated the viability of in-house avionics for small launchers, and its Electron heritage now feeds into Neutron, threatening incumbents in the medium-class segment. SpaceX continues to internalize key avionics, leveraging economies of learning from 20-plus reuses per booster to iterate on hardware every six months. This velocity compels external vendors to adopt concurrent-engineering workflows and digital-twin platforms to maintain relevance.
Strategically, the field is bifurcating. Volume-centric suppliers prioritize standardized boards to migrate across booster families, minimizing non-recurring engineering charges. Premium providers focus on radiation-hardened or deep-space-capable units where margins exceed 35%. Patent filings surged in 2024 for autonomous flight-termination logic and AI-derived sensor fusion, suggesting intellectual property will shape the next competitive battleground. M&A activity, typified by Lynx’s purchase of CoreAVI, underscores a race to integrate robust safety-critical graphics and processing IP under one roof.
Regionalization trends complicate the picture. Chinese manufacturers back-integrate avionics to avoid Western sanctions, while EU suppliers are ITAR-free partners for Middle Eastern and Asian clients. Supply-chain resiliency initiatives under the CHIPS Act encourage US primes to dual-source fabs domestically, potentially raising entry barriers. Yet the sheer diversity of payload requirements ensures that even niche houses, such as Aurora Avionics with digital-twin controllers, can capture a meaningful share if they meet schedule and cost targets. Overall, the competitive canvas remains dynamic, with incumbents and newcomers jockeying for design wins in a launch vehicle avionics market expanding at a double-digit pace.
Launch Vehicle Avionics Industry Leaders
Northrop Grumman Corporation
Safran SA
Space Exploration Technologies Corp.
L3Harris Technologies, Inc.
Moog Inc.
- *Disclaimer: Major Players sorted in no particular order

Recent Industry Developments
- March 2025: Rocket Lab secured a USD 5.6 billion National Security Space Launch Phase 3 contract from the US Space Force. This deal, involving its Neutron reusable rocket for classified missions, is expected to boost the market for launch avionics by driving advancements in reusable rocket technology and classified mission capabilities.
- March 2025: Aurora Avionics, an Edinburgh-based aerospace technology firm, secured GBP 500,000 (USD 682,320) from Kelvin Capital, Gabriel, and Scottish Enterprise. The funding will accelerate the development of advanced space launch guidance systems and support the company’s expansion at the Royal Observatory in Edinburgh.


Global Launch Vehicle Avionics Market Report Scope
| Guidance, Navigation, and Control (GNC) Systems |
| Flight Computers and Data Handling Systems |
| Telemetry, Tracking, and Command Systems |
| Electrical Power Systems |
| Others Systems |
| Small Launch Vehicles (Less than 1,000kg) |
| Medium Launch Vehicles (1,000–20,000 Kg) |
| Heavy Launch Vehicles (More than 20,000 Kg) |
| Commercial |
| Defense |
| Research and Educational Institutes |
| North America | United States | |
| Canada | ||
| Mexico | ||
| Europe | United Kingdom | |
| France | ||
| Germany | ||
| Italy | ||
| Russia | ||
| Rest of Europe | ||
| Asia-Pacific | China | |
| India | ||
| Japan | ||
| South Korea | ||
| Rest of Asia-Pacific | ||
| South America | Brazil | |
| Rest of South America | ||
| Middle East and Africa | Middle East | Saudi Arabia |
| Israel | ||
| Rest of Middle East | ||
| Africa | South Africa | |
| Rest of Africa | ||
| By Subsystem | Guidance, Navigation, and Control (GNC) Systems | ||
| Flight Computers and Data Handling Systems | |||
| Telemetry, Tracking, and Command Systems | |||
| Electrical Power Systems | |||
| Others Systems | |||
| By Launch-Vehicle Class | Small Launch Vehicles (Less than 1,000kg) | ||
| Medium Launch Vehicles (1,000–20,000 Kg) | |||
| Heavy Launch Vehicles (More than 20,000 Kg) | |||
| By End User | Commercial | ||
| Defense | |||
| Research and Educational Institutes | |||
| By Geography | North America | United States | |
| Canada | |||
| Mexico | |||
| Europe | United Kingdom | ||
| France | |||
| Germany | |||
| Italy | |||
| Russia | |||
| Rest of Europe | |||
| Asia-Pacific | China | ||
| India | |||
| Japan | |||
| South Korea | |||
| Rest of Asia-Pacific | |||
| South America | Brazil | ||
| Rest of South America | |||
| Middle East and Africa | Middle East | Saudi Arabia | |
| Israel | |||
| Rest of Middle East | |||
| Africa | South Africa | ||
| Rest of Africa | |||


Key Questions Answered in the Report
What was the launch vehicle avionics market size in 2025?
The sector generated USD 3.86 billion in 2025, setting the baseline for a strong forecast cycle.
Which subsystem leads spending today?
Guidance, Navigation, and Control (GNC) systems hold 35.80% of 2024 revenue, reflecting their critical function in vehicle safety and performance.
Why are small launchers so important to future growth?
Small vehicles (below 1,000 kg) payload combine high flight cadence with standardized avionics, driving a 14.60% CAGR that outpaces other classes.
Which region is expanding fastest?
Asia-Pacific is projected to grow at 14.85% CAGR through 2030 thanks to Chinese, Indian, and Japanese program momentum.
How does reusability influence avionics design?
Reusable rockets force avionics to withstand dozens of thermal and vibro-acoustic cycles, prompting upgrades in component durability and health-monitoring software.
What is limiting wider adoption of AI-driven avionics?
Extended cybersecurity certification under evolving DO-178C and FAA guidelines adds up to 18 months to
Page last updated on:


