Market Overview
| Study Period | 2019 - 2030 |
|---|---|
| Forecast Data Period | 2025 - 2030 |
| Historical Data Period | 2019 - 2023 |
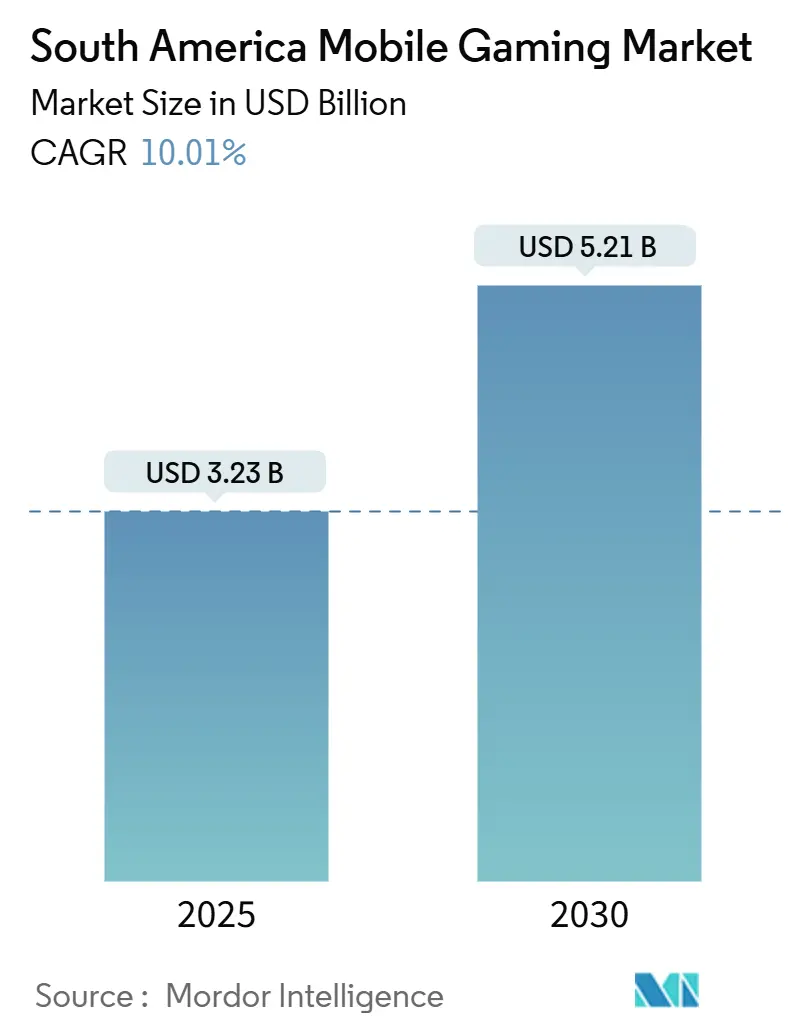
| Market Size (2025) | USD 3.23 Billion |
| Market Size (2030) | USD 5.21 Billion |
| Growth Rate (2025 - 2030) | 10.01% CAGR |
| Market Concentration | Medium |
Major Players *Disclaimer: Major Players sorted in no particular order Image © Mordor Intelligence. Reuse requires attribution under CC BY 4.0. | |
South America Mobile Gaming Market Analysis by Mordor Intelligence
The South America mobile gaming market reached USD 3.23 billion in 2025 and is expected to expand at a 10.01% CAGR to USD 5.21 billion by 2030, demonstrating a sturdy market size outlook and a robust compound growth trajectory. Mobile adoption, propelled by Android penetration above 84% and continuing 4G rollout, remains the single biggest growth catalyst, enabling easy game downloads and real-time play.[1]StatCounter, “Mobile Operating System Market Share South America,” gs.statcounter.com Cloud gaming bundles from telcos widen premium content access without demanding high-end hardware, reinforcing both casual and strategy genre momentum. [2]GSMA, “The Mobile Economy Latin America 2024,” gsma.com Meanwhile, progressive regulation is creating clearer, though more complex, operating rules that favour publishers able to meet tax and child-safety requirements.
Key Report Takeaways
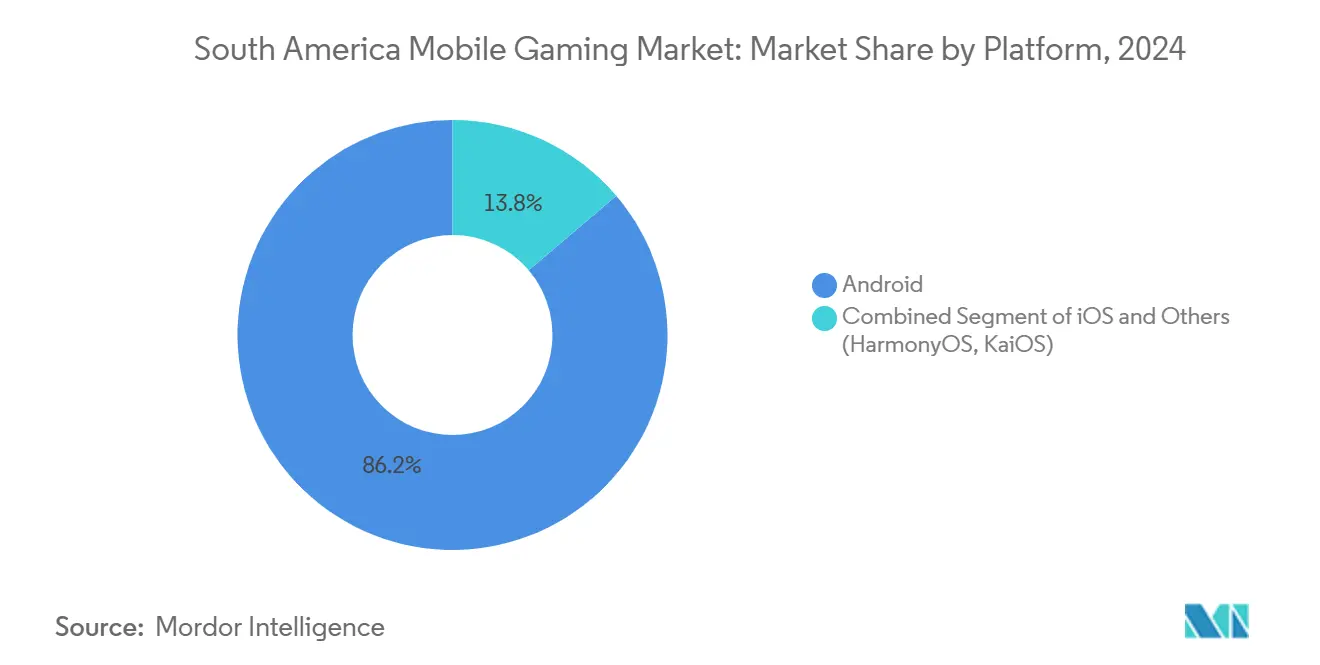
- By platform, Android commanded 86.22% of the South America mobile gaming market share in 2024; cloud gaming applications are projected to post a 14.04% CAGR to 2030.
- By genre, casual and hyper-casual titles captured 36.05% of the South America mobile gaming market size in 2024, whereas strategy games are advancing at a 13.50% CAGR through 2030.
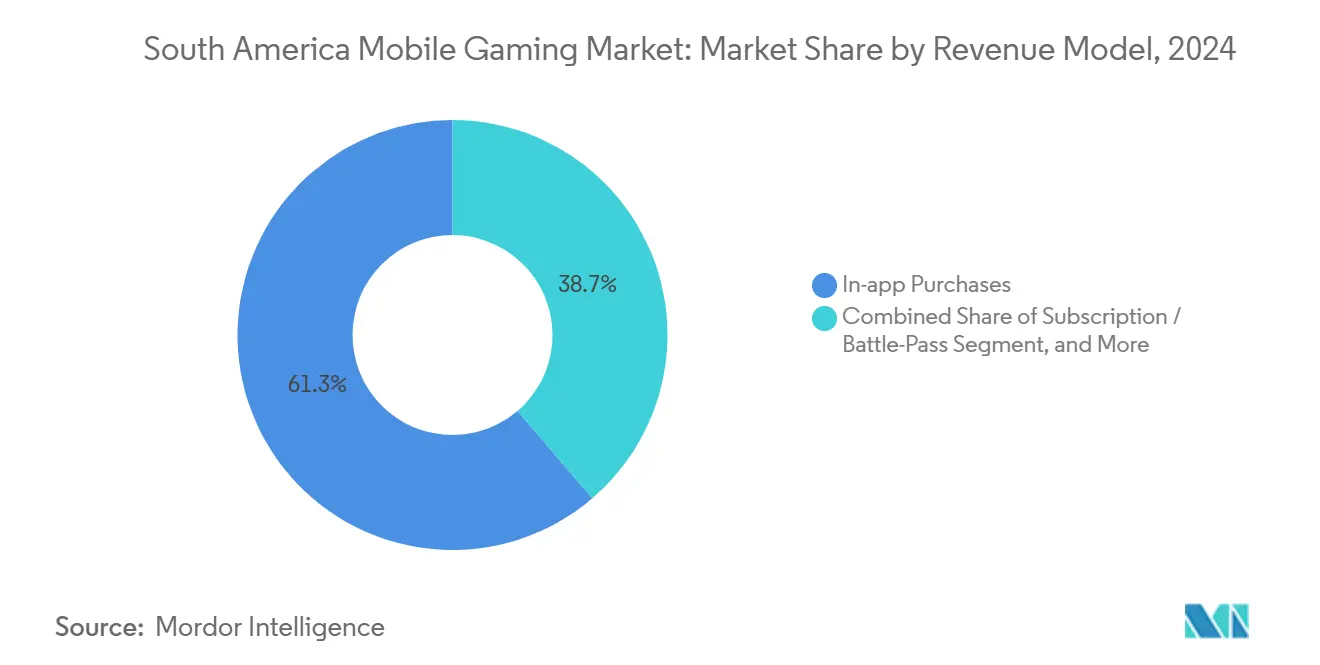
- By revenue model, in-app purchases generated 61.27% of 2024 revenue, while subscription and battle-pass formats are scaling fastest at a 13.89% CAGR.
- By age group, the 18-34 cohort held 42.44% of current users, yet the 45+ segment is expanding at 13.11% CAGR, the quickest of all cohorts.
- By geography, Brazil produced 28% of the total 2024 smartphone shipments and is forecast to double gaming revenue to USD 3.67 billion by 2028 on a 16.3% CAGR.
South America Mobile Gaming Market Trends and Insights
Drivers Impact Analysis*
| Driver | (~) % Impact on CAGR Forecast | Geographic Relevance | Impact Timeline |
|---|---|---|---|
| Explosive Android smartphone and affordable 4G roll-out | +2.80% | Global, strongest in Brazil, Colombia | Short term (≤ 2 years) |
| Rising disposable income lifts ARPU for in-game purchases | +2.10% | Brazil, Chile, urban centers across region | Medium term (2-4 years) |
| Hyper-localised content and IP collaboration (football clubs, telenovelas) | +1.70% | Brazil, Argentina, Colombia | Medium term (2-4 years) |
| Fin-tech rails (PIX, Mercado Pago, NuPay) slash micro-payment friction | +2.30% | Brazil core, expanding to Argentina, Chile | Short term (≤ 2 years) |
| Tier-2 city eSports cafés spawning grassroots gamer communities | +1.20% | Brazil, Colombia, Peru interior regions | Long term (≥ 4 years) |
| Telco–cloud-gaming bundles (Claro Gaming Pass, Movistar Gaming) | +1.40% | Regional, led by Brazil, Mexico expansion | Medium term (2-4 years) |
| Source: Mordor Intelligence | |||
Explosive Android smartphone and affordable 4G roll-out
Android accounts for 84.32% of all mobile handsets in South America, giving publishers a single dominant operating system to target. Operators added more than 40 million smartphones in Brazil during 2024, and 4G connections hit 455 million regionally in 2023, while 5G lines are forecast to exceed 425 million by 2030. Lower latency and higher bandwidth enable cloud gaming that was previously restricted to high-spec PCs, directly underpinning the 14.04% CAGR forecast for cloud apps. Government programs such as Brazil’s National Digital Inclusion Plan aim to connect the remaining 7% of unserved citizens, raising the total addressable user base. Cheaper data packs in Colombia and Peru keep recurring costs manageable, reinforcing daily playtime and stickiness for the South America mobile gaming market.
Rising disposable income lifts ARPU for in-game purchases
Macroeconomic stabilization and wage growth in Brazil, Chile, and Colombia have boosted discretionary spending on entertainment. Pesquisa Game Brazil 2025 recorded that 89.9% of players who encounter monetized games pay at least once, and 8.6% spend more than BRL 500 monthly.[3]TechTudo Editorial, “Brasil Joga Cada Vez Mais,” techtudo.com The Brazilian South America mobile gaming market size for in-app purchases is set to double by 2028, indicating material headroom. Colombia’s projected ARPU of USD 823 in 2025 sits 29% above the regional mean, signalling premium pricing tolerance. Higher household income supports battle passes and cosmetic packs that raise long-run monetization per user.
Hyper-localised content and IP collaboration
Collaborations between game studios and local football clubs or telenovela brands deliver culturally resonant skins and events that boost engagement. Free Fire’s partnerships with Brazilian teams drove daily active users to record regional highs and sparked live esports finals held in São Paulo arenas. Riot Games’ plan to merge the LCS, CBLOL, and LLA into a pan-American league in 2025 further elevates regional IP visibility.[4]Esports Insider Team, “Riot Games Unveils Pan-Americas League,” esportsinsider.com Brazil’s 1,042 game studios, with 93% producing original IP, supply authentic narratives that outperform generic reskins. Localization thus fuels retention and positions the South America mobile gaming market for sustainable user growth.
Fintech rails slash micro-payment friction
PIX processed USD 2.1 trillion of transactions in 2022, its instant-pay nature removing card-entry barriers. Argentina’s Depay and Brubank partnership now extends PIX to cross-border tourists, unlocking seamless spending for Argentine gamers while traveling. Digital wallets such as NuPay and Mercado Pago already dominate in-app checkout flows, and new SmartPix tokenization from dLocal permits one-tap repeat purchases. These rails have cut payment rejection rates and spurred higher conversion on small ticket items, reinforcing the 61.27% revenue share that in-app purchases occupy today.
Restraints Impact Analysis*
| Restraint | (~) % Impact on CAGR Forecast | Geographic Relevance | Impact Timeline |
|---|---|---|---|
| Currency volatility versus USD distorts IAP pricing tiers | -1.80% | Argentina, Brazil, regional cross-border | Short term (≤ 2 years) |
| Low penetration of high-end GPUs limits uptake of graphics-intensive titles | -1.20% | Regional, particularly rural areas | Medium term (2-4 years) |
| Cumbersome digital-goods taxation and varied VAT rules | -1.40% | Chile, Colombia, Peru regulatory complexity | Medium term (2-4 years) |
| Fragmented app-store compliance (local data-hosting, age ratings) | -0.90% | Brazil, Colombia compliance requirements | Long term (≥ 4 years) |
| Source: Mordor Intelligence | |||
Currency volatility versus USD distorts IAP pricing tiers
Persistent peso and real fluctuations complicate regional price matrices. Steam removed discounted regional pricing in Argentina, causing triple-digit price jumps that outpace. Brazilian developers frequently revise BRL tiers to match USD benchmarks, adding operational cost and irritating loyal spenders. Colombia’s temporary 19% VAT on gambling deposits amplifies effective price rises. Subscription models face particular stress, as flat fees become mismatched with changing local purchasing power. Short-term promotional pricing and local wallet cashback mitigate churn, yet volatility remains a headwind for the South America mobile gaming market.
Low penetration of high-end GPUs limits uptake of graphics-intensive titles
Forty-one percent of Brazilian smartphone shipments in 2024 were sub-USD 200 devices, lacking advanced GPUs. Heavy shooters and open-world RPGs, therefore, address a narrower base, capping revenue potential from premium visual content. Rural connectivity gaps in Bolivia and interior Peru also hinder cloud streaming performance, making quality downgrades unavoidable. While lightweight optimization like Free Fire’s core loop shows success, hardware constraints still delay monetization of high-fidelity titles. Medium-term 5G expansion may alleviate latency, yet device cost remains a structural issue until 2027 or later.
*Our forecasts treat driver/restraint impacts as directional, not additive. The impact forecasts reflect baseline growth, mix effects, and variable interactions.
Segment Analysis
By Platform: Android dominance drives cloud gaming innovation
Android retained an 86.22% share in 2024, underpinning nearly all ad impressions and billing integrations. Within this environment, cloud apps produced the highest growth, advancing at 14.04% CAGR on the back of carrier bundles that waive data caps. The South America mobile gaming market size for cloud gaming could reach USD 720 million by 2030, roughly 14% of the total value.
Android’s open ecosystem eases APK sideloading, letting publishers soft-launch localized builds before Play Store release. Meanwhile, iOS concentrates on a smaller but more lucrative segment in urban Chile and Brazil, with 56% of its users purchasing paid apps. HarmonyOS and KaiOS remain experimental, though Chinese OEMs in Manaus free-trade zones may push dual-boot handsets by 2027. Streaming-based access reduces GPU dependence and pulls high-end genres into the mainstream, strengthening user retention and the overall South America mobile gaming market.


By Game Genre: Casual leadership meets strategy renaissance
Casual and hyper-casual titles controlled 36.05% of 2024 revenue, thriving on low data requirements and short sessions. Strategy games, led by tower defense and auto-battlers, are scaling at 13.50% CAGR as latency improvements support synchronous multiplayer. The South America mobile gaming market share for strategy could climb near 18% by 2030.
Shooter games derive staying power from optimized battle-royale loops and local celebrity promotions. RPGs leverage cross-progression between console and mobile, securing whales who invest across platforms. Sports and racing genres tap into football fandom by including regional leagues and players, elevating engagement during Copa América seasons. As hardware and cloud capabilities rise, mid-core and hardcore conversions are set to accelerate, boosting overall monetization efficiency.
By Revenue Model: IAP dominance challenged by subscription growth
In-app purchases delivered 61.27% of spend in 2024, a cornerstone of the South America mobile gaming market. Battle passes deliver seasonal arcs and exclusive cosmetics, fuelling the 13.89% CAGR expected for subscriptions through 2030. The South America mobile gaming market size tied to subscriptions could exceed USD 690 million by the forecast horizon.
Rewarded video and playable ads supplement revenue in price-sensitive cohorts, while PIX tokenization has dropped average checkout time below six seconds, lifting conversion. Advertising-only titles still dominate Peru and Bolivia ,where card use is low, but hybrid models draw wider lifetime value. Cloud access fees create a fresh stream that bundles content libraries with data plans, further diversifying publisher income.
By Age Group: Youth dominance with senior surge
The 18-34 bracket comprises 42.44% of active players, spending the most time per session and leading social sharing virality. Teens follow closely but face tightening parental controls and impending digital content taxation, prompting stronger compliance features.
Notably, the 45+ group is rising fastest at 13.11% CAGR as puzzle and word games appeal to cognitive engagement desires. The South America mobile gaming market benefits from this demographic broadening because older users display higher ad-watch completion rates and growing comfort with PIX-enabled micro-payments. Meanwhile, the 35-44 segment maintains high disposable income and longer session length, underpinning steady premium content uptake.
Geography Analysis
Brazil retains the gravitational center of the South America mobile gaming market, generating 28% of regional smartphone shipments and hosting 175 million active devices. The country is predicted to deliver USD 3.67 billion in gaming revenue by 2028 at a 16.3% CAGR, powered by 5G densification and an advanced fintech stack that cut friction from checkout. New consumption-tax reforms unify IBS and CBS levies, simplifying compliance yet adding selective taxes on digital platforms. Regulators also require 20% local ownership for gambling operators, steering global publishers toward joint ventures.
Argentina blends 93% internet penetration with acute currency risk, nudging gamers toward free-to-play and Game Pass-type subscriptions. Import liberalization and larger duty-free allowances boost console and accessory availability, while PIX-for-tourists schemes highlight increasing cross-border payment fluidity.
Chile and Colombia stand out for high ARPU potential. Colombia’s projected USD 823 ARPU in 2025 immunizes publisher margins against currency swings, though a 19% VAT on deposits tightens compliance costs. Chile’s 5G rollout and mandatory digital-services VAT filings indicate a maturing landscape favouring licensed players with audit readiness.
Rest-of-South America markets such as Peru and Bolivia exhibit lower current penetration but sizeable upside. Peru’s new digital-services tax regime and spectrum investments support network build-out. As infrastructure evolves, these countries will shift from testing grounds into meaningful revenue contributors to the wider South America mobile gaming market.
Competitive Landscape
The competitive arena is moderately fragmented, with no single publisher exceeding 15% regional revenue share in 2025. Tencent, Garena, Supercell, and Activision Blizzard pursue differentiated plays. Tencent leverages Level Infinite to seed local eSports ecosystems and invests through its Venture Lab fund, while Supercell’s Squad Busters amassed 44 million downloads within months, with Brazil ranking top for installs.
Localization remains decisive. Garena’s Free Fire integrates Brazilian football branding, whereas Riot Games is streamlining its pro-league structure to showcase South American talent. Domestic studios like Wildlife and Aquiris scale original IP leveraging government incentives and proximity to fans, enabling faster content iterations.
Hybrid monetization, micro-community events, and fintech integrations distinguish winners. Publishers able to embed PIX and local digital wallets reduce drop-off and capture incremental spend. Legal sophistication is rising; operators must satisfy new child-content levies and local-ownership clauses, naturally favouring firms with compliance staff and capex reserves. These trends will intensify consolidation, yet grassroots studios anchored in cultural insight are poised to ride niche successes and ad-supported models, ensuring continued diversity inside the South America mobile gaming market.
South America Mobile Gaming Industry Leaders
KONAMI
Riot Games, Inc.
Tapps games
Epic Games, Inc.
Activision Publishing, Inc.
- *Disclaimer: Major Players sorted in no particular order

Recent Industry Developments
- April 2025: Brazil’s Congress weighed a 1% gross-revenue CIDE-Digital Detox tax on platforms targeting children, granting reduced rates for parental-control deployments.
- February 2025: Supercell posted record 2024 revenue of €2.8 billion and cited Brazil among its top early-monetizing markets.
- February 2025: Mercado Pago added PIX support for Argentine tourists, easing cross-border micro-payments.
- January 2025: Brazil enacted consumption-tax reforms tying digital gaming to unified IBS and CBS collection.


South America Mobile Gaming Market Report Scope
Mobile games are designed for mobile devices, such as smartphones, feature phones, pocket PCs, personal digital assistants (PDA), tablet PCs, and portable media players. The scope of the study focuses only on mobile gaming, specifically games that work on iOS and Android smartphones.
The South American mobile gaming market is proliferating due to the increasing trend of smartphone users in different countries. Moreover, WHO's (World Health Organization) global campaign #PlayApartTogether is encouraging people across various regions to play video games during this COVID-19 pandemic.
The South America mobile gaming market is segmented by geography (Brazil, Argentina, Chile, Columbia, Rest of South America).
The market sizes and forecasts are provided in terms of value (USD) for all the above segments.
By Platform (OS)
| Android |
| iOS |
| Others (HarmonyOS, KaiOS) |
By Game Genre
| Casual / Hyper-casual |
| Action / Shooter |
| Strategy |
| RPG |
| Sports / Racing |
By Revenue Model
| In-app Purchase (IAP) |
| Advertising-supported |
| Subscription / Battle-Pass |
| Cloud-gaming Access Fees |
By Age Group
| 13-17 yrs |
| 18-34 yrs |
| 35-44 yrs |
| 45+ yrs |
Country
| Brazil |
| Argentina |
| Chile |
| Colombia |
| Rest of South America (Peru, Bolivia, etc.) |
| By Platform (OS) | Android |
| iOS | |
| Others (HarmonyOS, KaiOS) | |
| By Game Genre | Casual / Hyper-casual |
| Action / Shooter | |
| Strategy | |
| RPG | |
| Sports / Racing | |
| By Revenue Model | In-app Purchase (IAP) |
| Advertising-supported | |
| Subscription / Battle-Pass | |
| Cloud-gaming Access Fees | |
| By Age Group | 13-17 yrs |
| 18-34 yrs | |
| 35-44 yrs | |
| 45+ yrs | |
| Country | Brazil |
| Argentina | |
| Chile | |
| Colombia | |
| Rest of South America (Peru, Bolivia, etc.) |


Key Questions Answered in the Report
How large is the South America mobile gaming market today?
The market reached USD 3.23 billion in 2025 and is expected to climb to USD 5.21 billion by 2030 on a 10.01% CAGR.
Which platform dominates mobile gaming usage in South America?
Android leads with 86.22% share of active devices, far ahead of iOS.
What is the fastest-growing game genre among South American players?
Strategy games are expanding at 13.50% CAGR, outpacing all other genres.
How do instant payment systems such as PIX influence gaming revenue?
PIX reduces checkout friction, raising conversion on micro-transactions and supporting the 61.27% revenue share held by in-app purchases.
Which country contributes most revenue to regional gaming?
Brazil supplies the largest contribution and is projected to double its gaming revenue to USD 3.67 billion by 2028.
What are the key regulatory issues publishers must monitor?
New digital taxes, local-ownership requirements in Brazil, and temporary VAT on gaming deposits in Colombia top the compliance list.
Page last updated on:


