Laminated Glass Market Size and Share
Market Overview
| Study Period | 2021 - 2031 |
|---|---|
| Market Size (2026) | USD 21.78 Billion |
| Market Size (2031) | USD 27.68 Billion |
| Growth Rate (2026 - 2031) | 4.91% CAGR |
| Fastest Growing Market | Asia Pacific |
| Largest Market | Asia Pacific |
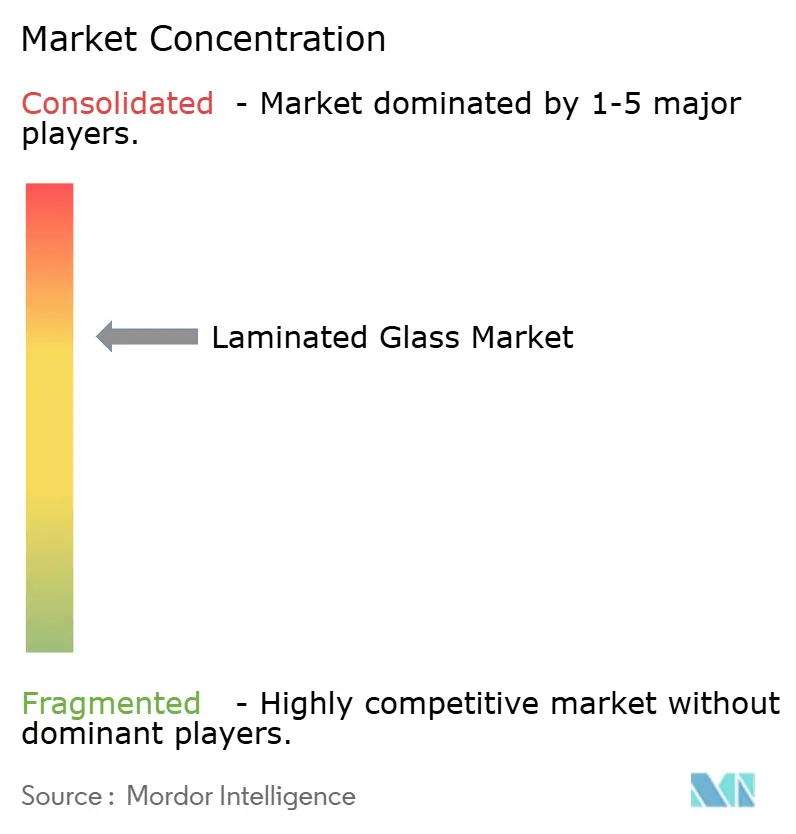
| Market Concentration | Medium |
Major Players *Disclaimer: Major Players sorted in no particular order Image © Mordor Intelligence. Reuse requires attribution under CC BY 4.0. | |

Laminated Glass Market Analysis by Mordor Intelligence
The Laminated Glass Market size is estimated at USD 21.78 billion in 2026, and is expected to reach USD 27.68 billion by 2031, at a CAGR of 4.91% during the forecast period (2026-2031). Strict safety rules, low-energy construction codes, and the rise of electric vehicles are boosting demand for interlayer-bonded glass in buildings, cars, and photovoltaic façades. Polyvinyl butyral (PVB) kept a 53.13% revenue lead in 2025, yet ionoplast grades are growing faster as cyclone-prone regions mandate hurricane-grade curtain walls. Solar and building-integrated PV (BIPV) panels now outpace traditional uses as China’s zero-energy codes take force. Competitive focus is shifting to high-margin interlayers, with top float-glass groups using vertical integration to shield margins while niche ionoplast firms carve out coastal and defense jobs.
Key Report Takeaways
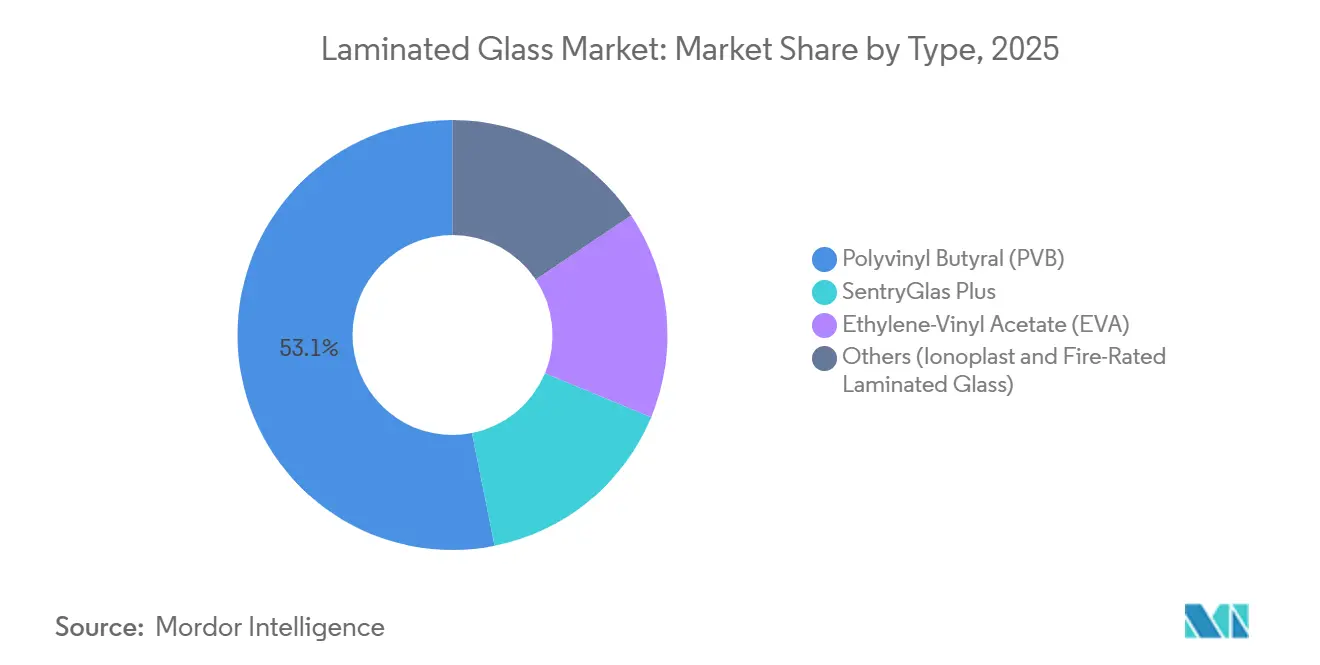
- By type, Polyvinyl Butyral retained 53.13% of the laminated glass market share in 2025, yet SentryGlas Plus is forecast to grow fastest at 5.92% CAGR to 2031.
- By application, architectural interiors led with 43.13% revenue share in 2025; solar/BIPV modules are projected to expand at an 8.18% CAGR through 2031.
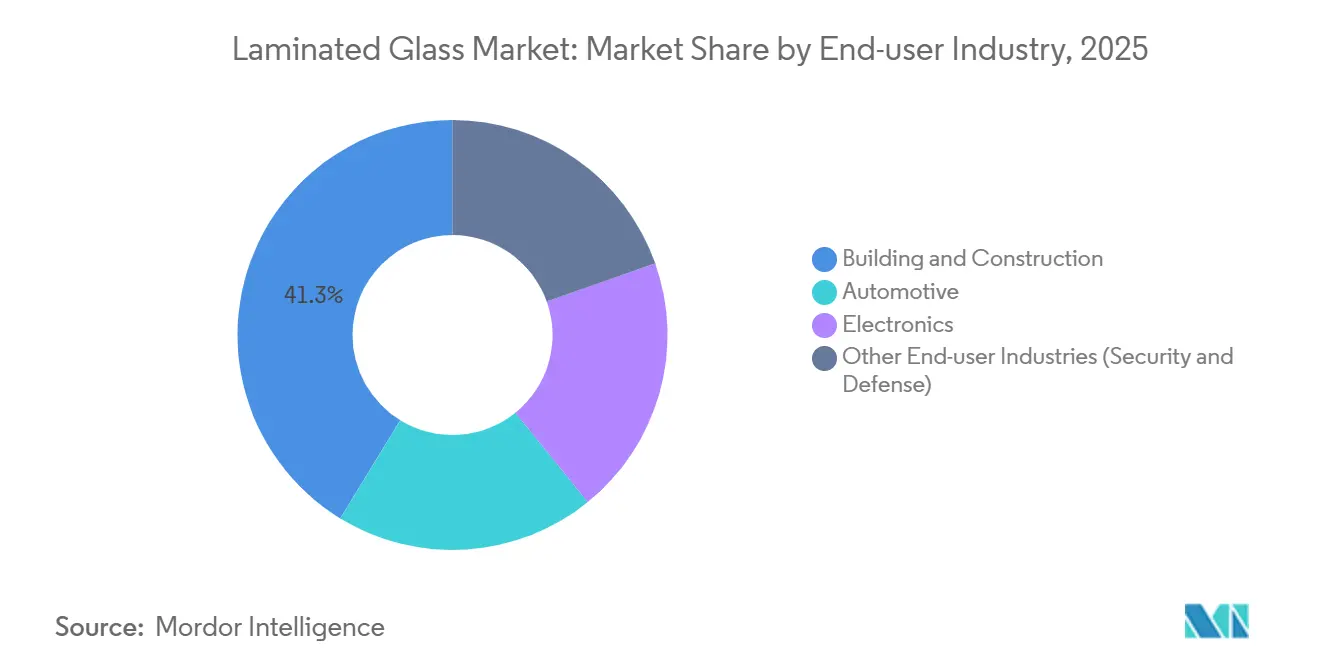
- By end-user industry, building and construction held 41.26% of the laminated glass market size in 2025, while automotive is on track for a 6.72% CAGR between 2026-2031.
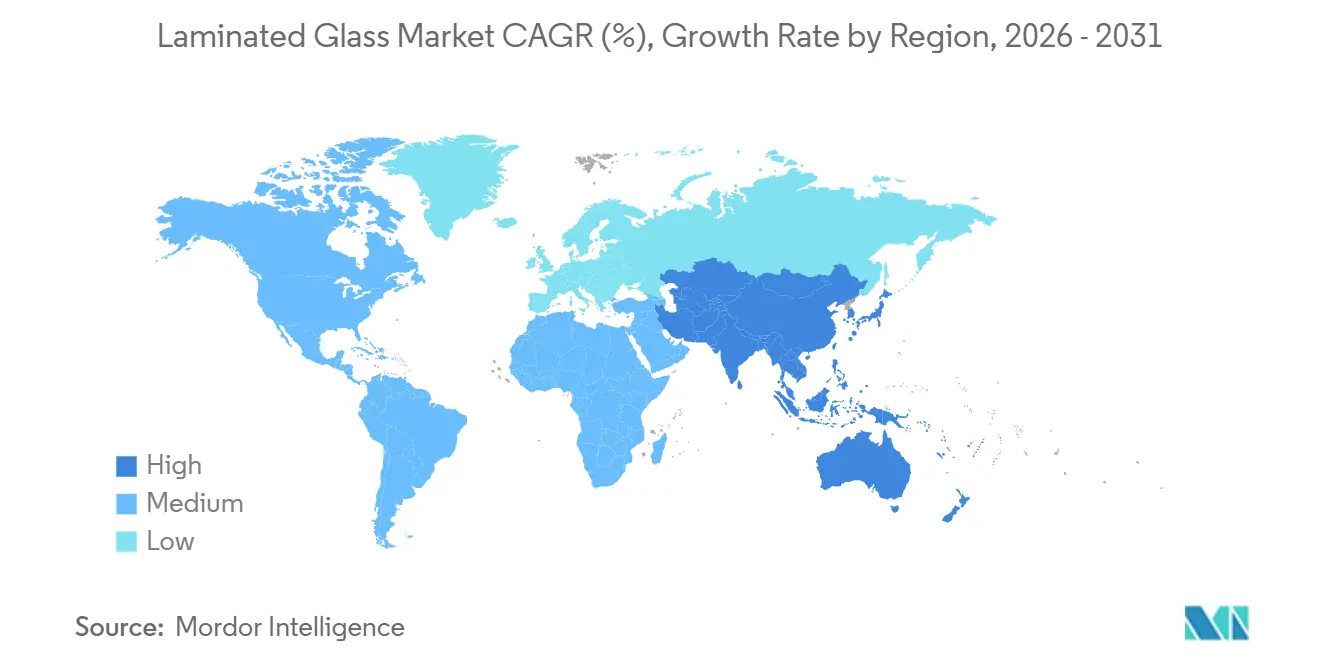
- By region, Asia Pacific dominated with 48.25% of sales in 2025 and is advancing at a 6.03% CAGR to 2031.
Note: Market size and forecast figures in this report are generated using Mordor Intelligence’s proprietary estimation framework, updated with the latest available data and insights as of January 2026.
Global Laminated Glass Market Trends and Insights
Driver Impact Analysis*
| Driver | (~) % Impact on CAGR Forecast | Geographic Relevance | Impact Timeline |
|---|---|---|---|
| Urban skyscraper boom in Asia Pacific demanding hurricane-grade façades | +1.2% | APAC core (China, India, Southeast Asia), spill-over to Middle East | Medium term (2-4 years) |
| Mandated HUD-ready laminated windshields in premium EVs | +0.9% | Global, with early gains in North America, Europe, China | Short term (≤ 2 years) |
| EU-27 compulsory safety-glazing in public infrastructure | +0.7% | Europe (Germany, France, Italy, Spain, Nordic countries) | Long term (≥ 4 years) |
| BIPV mandates in China's "Zero-Energy Building" codes | +1.1% | China national, provincial pilots in Jiangsu, Guangdong, Zhejiang | Medium term (2-4 years) |
| Rapid growth of ultra-quiet high-rise housing (acoustic laminates) | +0.6% | Global urban centers, concentrated in APAC and Middle East | Medium term (2-4 years) |
| Source: Mordor Intelligence | |||
Urban Skyscraper Boom in Asia-Pacific Demanding Hurricane-Grade Façades
Cyclone-exposed coastal cities from Shenzhen to Manila now specify impact-resistant laminates in towers above 50 m to cut glass fallout risks. Ionoplast interlayers supply five-fold tear strength versus standard PVB, which lets designers trim pane thickness and reduce façade dead load by up to 15%. India’s 2024 building code revision extended similar rules to buildings taller than 15 stories along its eastern and western coastlines, adding more than 40,000 new residential units yearly[1]Bureau of Indian Standards, “National Building Code 2024,” bis.gov.in. Dubai mirrored the shift in its 2025 Fire and Life Safety Code that obliges laminated balustrades for balconies in sand-storm zones. Thailand and Vietnam still lack local ionoplast extrusion, driving 10-12 week import lead times that inflate costs by 20–30%. As a result, regional capacity additions from Kuraray and AGC remain likely through 2028.
Mandated HUD-Ready Laminated Windshields in Premium EVs
Head-up-display (HUD) functions in luxury electric cars need wedge-shaped interlayers with refractive tolerances tighter than 0.0005 to avoid double images. Eastman combined acoustic damping and optical precision in its 0.76 mm Saflex DG film, commercialized in 2024[2]Eastman Chemical Company, “Saflex Acoustic DG Product Sheet,” eastman.com. EU rule ECE R43 amendment 05, effective 2025, obliges laminated windshields in all passenger vehicles, abolishing the toughened-glass option in low-cost models. General Motors adopted HUD-compatible glass across its Ultium EV range during 2025, shaving warranty claims on stress cracks by about 30%. Tier-2 fabricators without precision calendaring now face steep capital hurdles, consolidating supply around AGC, NSG Pilkington, and Fuyao.
EU-27 Compulsory Safety Glazing in Public Infrastructure
Eurocode 10 updates mandate laminated or wired glass in atriums, stairwells, and overhead glazing to curb injury from spontaneous breakage. Fire-rated products must meet EN 13501-2 EI 60 at a minimum, yet certification takes 18–24 months due to full-scale furnace tests. Saint-Gobain and Schott invested over EUR 25 million apiece in in-house labs, letting them cycle products faster and dominate tenders. The UK’s 2024 Building Safety Act extended similar rules to residential towers taller than 18 m, lifting demand by over 1 million m² annually. Higher interlayer costs, however, mean budget projects often delay upgrades until subsidies improve.
BIPV Mandates in China’s Zero-Energy Codes
China’s 2024 amendment to GB/T 51350 requires new public buildings in Tier-1 cities to self-generate 20% of annual electricity by 2027. Laminated glass with EVA encapsulants protects crystalline cells while meeting national safety glazing norms. Jiangsu launched 30% BIPV subsidies in 2025, triggering 15 GW of façade-mounted capacity additions. CSG Holding and Xinyi Glass responded by adding EVA lines that cut module costs by 25% versus imports. UV-induced EVA aging above 85°C remains a hurdle, pushing developers to shaded orientations or pricier ionomer films.
Restraint Impact Analysis*
| Restraint | (~) % Impact on CAGR Forecast | Geographic Relevance | Impact Timeline |
|---|---|---|---|
| Volatile soda-ash and PVB feedstock prices | -0.8% | Global, acute in Asia Pacific and Europe | Short term (≤ 2 years) |
| Lengthy European Union fire-rated certification cycles | -0.5% | Europe, indirect impact on global product roadmaps | Long term (≥ 4 years) |
| End-of-life laminated glass recycling bottlenecks | -0.3% | Europe and North America (regulatory pressure), limited Asia Pacific impact | Medium term (2-4 years) |
| Source: Mordor Intelligence | |||
Volatile Soda-Ash and PVB Feedstock Prices
Spot soda-ash jumped from USD 220/t in late 2024 to USD 260/t in early 2025 after environmental shutdowns idled 1.5 million t of Chinese capacity. PVB resin cost followed suit when butyraldehyde feedstock climbed 12% year on year, forcing Kuraray and Eastman to raise list prices by up to 10% in January 2025. Laminators on fixed building contracts see 200-bp margin hits during the pass-through lag. Currency shifts add pain; a weaker rupee and baht increased imported PVB bills 5% in 2025 for Indian and Thai processors.
Lengthy European Union Fire-Rated Certification Cycles
EN 1363-1 furnace tests take 90-120 minutes per pane and cost EUR 15,000-20,000, creating 14-month queues at labs running near full capacity. Each new interlayer or thickness calls for fresh trials, so smaller entrants cannot fund multi-SKU pipelines. Saint-Gobain, Schott, and AGC hold in-house furnaces, cementing a 70% share of certified EI-90 capacity in 2025. Proposed CPR reforms might cut duplication after 2028, yet timing remains uncertain.
*Our forecasts treat driver/restraint impacts as directional, not additive. The impact forecasts reflect baseline growth, mix effects, and variable interactions.
Segment Analysis
By Type: Ionoplast Gains as Coastal Codes Tighten
Polyvinyl butyral maintained 53.13% of 2025 revenue, anchoring the laminated glass market thanks to entrenched use in cars and office partitions. SentryGlas Plus, however, is forecast to post a 5.92% CAGR and seize share as coastal regions impose hurricane standards. The laminated glass market size for ionoplast could top USD 5 billion by 2031 if current code trajectories hold. Ionoplast’s 30 MPa tear strength lets façades slim down while meeting impact tests, saving up to 15% structural steel. Pricing premia of 12-15% narrowed in 2025 as new extrusion lines in Guangdong and Dubai improved supply.
Adoption spreads fastest in Southeast Asia and the Gulf, where cyclone and sandstorm loads converge. Developers also favor ionoplast for blast resistance that satisfies insurer guidelines for assets within 500 m of shorelines. Fire-rated gels stay niche, constrained to European public infrastructure, while EVA owns BIPV modules by lowering lamination temperature to protect cells. Other interlayers, such as TPU and polycarbonate, address sunroofs, while security glazing will stay specialized through 2031.


By Application: Solar Modules Outpace Traditional Segments
Architectural interiors commanded 43.13% of 2025 revenue as frameless glass grew in offices and hotels, but solar and BIPV modules are projected to rise at an 8.18% CAGR. The laminated glass market size tied to BIPV may approach USD 7 billion by 2031, buoyed by China’s 20-25% on-site energy targets. Visible-light transmission losses from embedded cells dropped to 30-32% in 2025, easing aesthetic objections in retail façades.
International WELL rules cap sound levels, so acoustic partitions retain a strong base in offices. Automotive windshields account for nearly 30% of volume and are climbing as HUD becomes standard on premium EVs, adding USD 10 per pane. Exterior curtain walls hold 18-20% share but migrate toward high-spec ionoplast to satisfy cyclone maps in India and Florida. Security glazing sits below 5% yet commands margins triple those of commodity interiors, helping offset rising energy costs at integrated plants.
By End-User Industry: Automotive Electrification Accelerates Glass Demand
Building and construction led with 41.26% of 2025 demand, yet the automotive sector is the growth engine with a 6.72% CAGR to 2031. Panoramic EV roofs now exceed 1.5 m² and must be laminated to meet rollover rules, driving square-meter uptake. Mercedes EQS and BMW iX models added more than 12 kg of laminated glass per vehicle in 2025.
Electronics makers use laminates in foldable phones to fight crease propagation, but they hold just a 6-8% share. Defense, marine, and aerospace markets remain sub-5% due to weight needs that favor polycarbonate. Overall, the laminated glass market will rely on construction and automotive for roughly 75% of revenue by 2030, concentrating power with Tier-1 suppliers that can serve both channels.
Geography Analysis
Asia Pacific held 48.25% of 2025 revenue and is growing at a 6.03% CAGR, making it the clear volume and growth leader in the laminated glass market. China consumed about 440 million m² in 2025, helped by Jiangsu and Guangdong subsidies that cover 30% of BIPV capital costs. India’s USD 1.4 trillion infrastructure plan adds 25 million m² of curtain walls per year, yet local laminating capacity lags demand by 20%.
In North America, FMVSS 205 already requires laminated windshields, but HUD adoption lifts PVB unit value by USD 8-12. Canada’s 2025 code now calls for overhead safety glass in public spaces, adding close to 1 million m² of annual need. Mexico’s Vitro and Guardian plants ship 20 million windshields yearly to US assembly lines, anchoring regional exports.
In Europe, Eurocode 10 drove 2 million m² extra demand for public-building atriums, yet long certification waits restrain smaller suppliers. Nordic nations top per-capita consumption due to triple-glazed units with laminated outer panes that fight ice shedding. South America and the Middle East share the remaining 9%, with Saudi megaprojects specifying ionoplast façades able to withstand 100 km/h sand storms.

Competitive Landscape
The Laminated Glass market is moderately consolidated. Integrated producers save up to USD 12 per m² by melting float glass and calendaring PVB in-house, a gap that protects margins when a soda-ash spike occurs. Technology leadership centers on HUD-ready wedge interlayers that need ±0.02 mm thickness precision. Only AGC, Kuraray, and Eastman run such lines at scale. Fuyao opened a USD 250 million plant in Ohio during 2025 to supply Detroit EV platforms, trimming logistics costs by USD 15 per windshield versus Asian imports.
Laminated Glass Industry Leaders
Saint-Gobain
AGC Inc.
Guardian Industries
Nippon Sheet Glass Co., Ltd
Xinyi Glass Holdings Limited
- *Disclaimer: Major Players sorted in no particular order

Recent Industry Developments
- October 2025: Khalifa Economic Zones Abu Dhabi revealed that China Southern Glass (CSG) is set to launch its inaugural overseas intelligent manufacturing facility in the United Arab Emirates. The facility aims to produce over 5 million square metres of coated, laminated, and insulating glass each year.
- March 2025: AGC Glass Europe unveiled its latest offering, the Stratobel Mirox laminated mirror, tailored for interior applications. This product's design merges the typical functional and optical attributes of standard mirrors with the enhanced safety features of laminated glass.


Research Methodology Framework and Report Scope
Market Definitions and Key Coverage
Our study treats the laminated glass market as the total value of newly manufactured safety glass sheets in which two or more panes are permanently bonded by an interlayer such as polyvinyl butyral, ethylene-vinyl acetate, or ionoplast, whether supplied to building façades, interior partitions, vehicle glazing, solar modules, or niche security uses. We count factory-built panels only at the first point of sale; repair glazing, tempered-only products, and aftermarket films are omitted.
Scope exclusion: thin tempered phone cover glass is intentionally left outside this sizing.
Segmentation Overview
- By Type
- Polyvinyl Butyral (PVB)
- SentryGlas Plus
- Ethylene-Vinyl Acetate (EVA)
- Others (Ionoplast, Fire-Rated Laminated Glass)
- By Application
- Architectural Exteriors (Curtain Walls and Facades)
- Architectural Interiors (Partitions and Balustrades)
- Automotive Windshields
- Automotive Sunroofs and Body Glazing
- Solar / BIPV Modules
- Electronics and Smart Devices
- Security and Defense Glazing
- By End-user Industry
- Building and Construction
- Automotive
- Electronics
- Other End-user Industries (Security and Defense)
- By Geography
- Asia-Pacific
- China
- India
- Japan
- South Korea
- Thailand
- Malaysia
- Indonesia
- Vietnam
- Rest of Asia-Pacific
- North America
- United States
- Canada
- Mexico
- Europe
- Germany
- United Kingdom
- France
- Italy
- Spain
- Turkey
- Russia
- Nordic Countries
- Rest of Europe
- South America
- Brazil
- Argentina
- Colombia
- Rest of South America
- Middle-East and Africa
- Saudi Arabia
- United Arab Emirates
- Qatar
- South Africa
- Nigeria
- Egypt
- Rest of Middle-East and Africa
- Asia-Pacific
Detailed Research Methodology and Data Validation
Primary Research
Interviews with glass fabricators, interlayer resin suppliers, automotive glazing engineers, and façade consultants across Asia-Pacific, North America, and Europe helped us validate average panel prices, penetration rates, and upcoming code changes that had limited public data. These interactions guided the fine-tuning of regional assumptions and stress-tested early model outputs.
Desk Research
We began with trade and production datasets from UN Comtrade, Eurostat PRODCOM, and the US Geological Survey, then drew on construction-permit series from the US Census and building completions from China's National Bureau of Statistics. Vehicle output figures from OICA and safety regulation updates published by the Safety Glazing Certification Council enriched the demand picture. Financial ratios and capacity details were cross-checked through D&B Hoovers, news archives on Dow Jones Factiva, and selected listed-company 10-Ks. The sources named illustrate our evidence base; several other reputable public repositories were also reviewed for consistency checks.
Market-Sizing & Forecasting
A top-down build starts with flat-glass production and net trade, which are then converted to laminated-grade volume using historical penetration ratios derived from the interviews. Results are corroborated through selective bottom-up roll-ups of leading fabricator shipments and sampled ASP × volume checks before final adjustments. Key variables include new floor-area completions, light-vehicle production, interlayer resin capacity utilization, building safety-code adoption index, and laminated share of auto sunroofs. A multivariate regression links these drivers to demand, with scenario analysis capturing cyclic construction swings. Forecasts run to 2030 and update automatically when any driver deviates materially from consensus.
Data Validation & Update Cycle
Analysts review model anomalies against third-party indicators every quarter, reconfirm unusual shifts with respondents, and obtain senior sign-off before release. Each published report is refreshed annually, and we push interim updates when policy changes or force-majeure events alter market trajectories.
Why Mordor's Laminated Glass Baseline commands reliability
Published estimates vary because firms choose different product scopes, driver sets, and refresh cadences.
We disclose our scope up front and, by combining regulations, capacity data, and price checks, we limit blind spots that inflate or deflate totals elsewhere.
Benchmark comparison
| Market Size | Anonymized source | Primary gap driver |
|---|---|---|
| USD 20.15 B (2024) | Mordor Intelligence | - |
| USD 22.20 B (2023) | Global Consultancy A | Includes tempered-laminated hybrids inside scope |
| USD 27.80 B (2024) | Industry Journal B | Uses list prices without regional ASP discounts |
| USD 20.37 B (2024) | Research Boutique C | Excludes solar and specialty security panels |
The comparison shows that divergences stem mainly from scope creep or pricing shortcuts; by contrast, Mordor analysts align volumes with verified production capacity and real transaction prices, offering decision-makers a balanced, transparent baseline they can readily trace back to openly stated drivers and repeatable steps.


Key Questions Answered in the Report
What is the current value of the laminated glass market?
The laminated glass market size reached USD 21.78 billion in 2026 and is forecast to climb to USD 27.68 billion by 2031.
Which interlayer type is growing fastest?
SentryGlas Plus interlayers post the quickest rise with a 5.92% CAGR through 2031, driven by hurricane-grade and blast-resistant façade codes.
Why are solar and BIPV panels important for laminated glass demand?
China’s zero-energy mandates and provincial subsidies push builders toward façade-integrated PV, lifting solar and BIPV laminates at an 8.18% CAGR.
How will electric vehicles influence laminated-glass volumes?
Premium EV models need HUD-ready windshields and large panoramic roofs, fueling a 6.72% CAGR for automotive glazing through 2031.
Which region leads growth in laminated glass consumption?
Asia Pacific both leads in share at 48.25% and shows the fastest growth at a 6.03% CAGR thanks to construction booms and BIPV rules.
Page last updated on:


