United States Flat Glass Market Size and Share
Market Overview
| Study Period | 2021 - 2031 |
|---|---|
| Forecast Data Period | 2026 - 2031 |
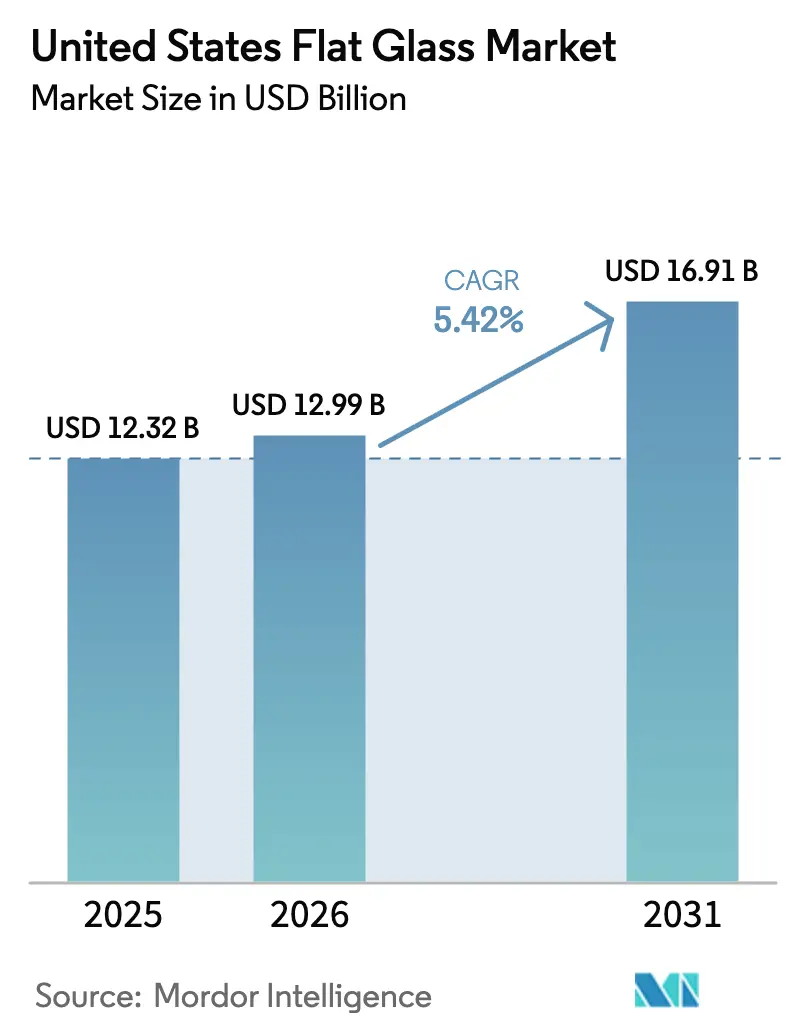
| Base Year Market Size (2025) | USD 12.32 Billion |
| Market Size (2026) | USD 12.99 Billion |
| Market Size (2031) | USD 16.91 Billion |
| Growth Rate (2026 - 2031) | 5.42% CAGR |
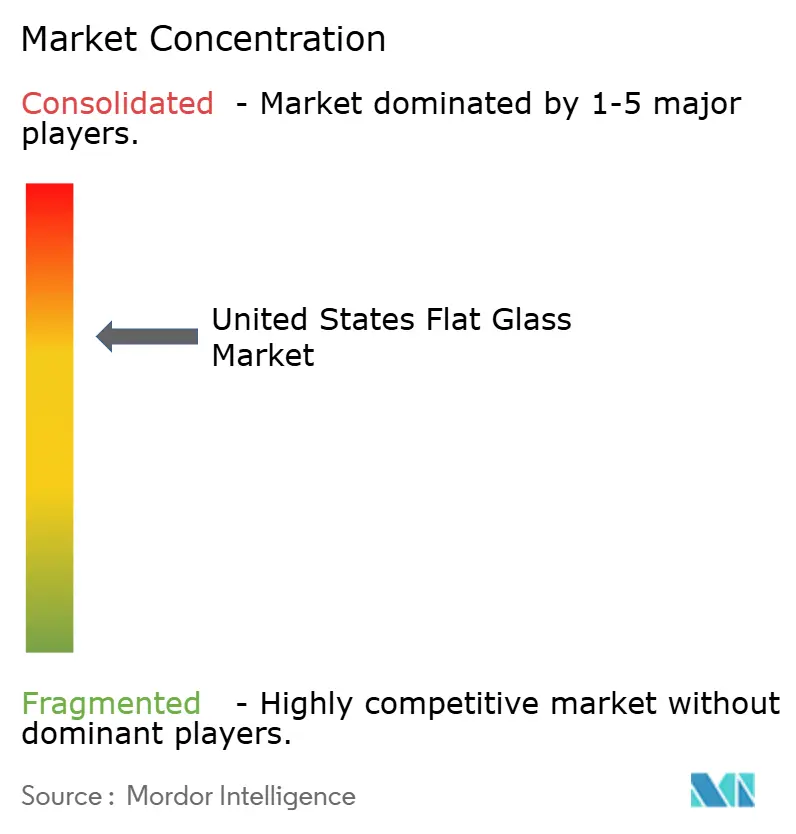
| Market Concentration | Medium |
Major Players *Disclaimer: Major Players sorted in no particular order Image © Mordor Intelligence. Reuse requires attribution under CC BY 4.0. | |
United States Flat Glass Market Analysis by Mordor Intelligence
The United States Flat Glass Market size is expected to grow from USD 12.32 billion in 2025 to USD 12.99 billion in 2026 and is forecast to reach USD 16.91 billion by 2031 at a 5.42% CAGR over 2026-2031. Demand is pivoting from commodity float toward higher-margin coated and processed products as solar-manufacturing incentives, energy-efficient retrofit mandates, and electric-vehicle glazing needs reshape procurement strategies. The United States flat glass market is also contending with skilled-labor shortages and tightening carbon rules that raise operating costs, nudging producers toward value-added segments where pricing power offsets compliance outlays. Vertically integrated solar-glass producers are already securing sustainable margins, while traditional architectural suppliers face intensified import competition even after recent anti-dumping actions. Consolidation among the seven domestic float operators co-exists with a vibrant downstream fabricator base, so customer leverage varies sharply along the chain. Overall, the United States flat glass market now rewards firms that can deliver multi-layer lamination, dynamic tinting, or ultra-low-emissivity sputtering rather than raw tonnage alone.
Key Report Takeaways
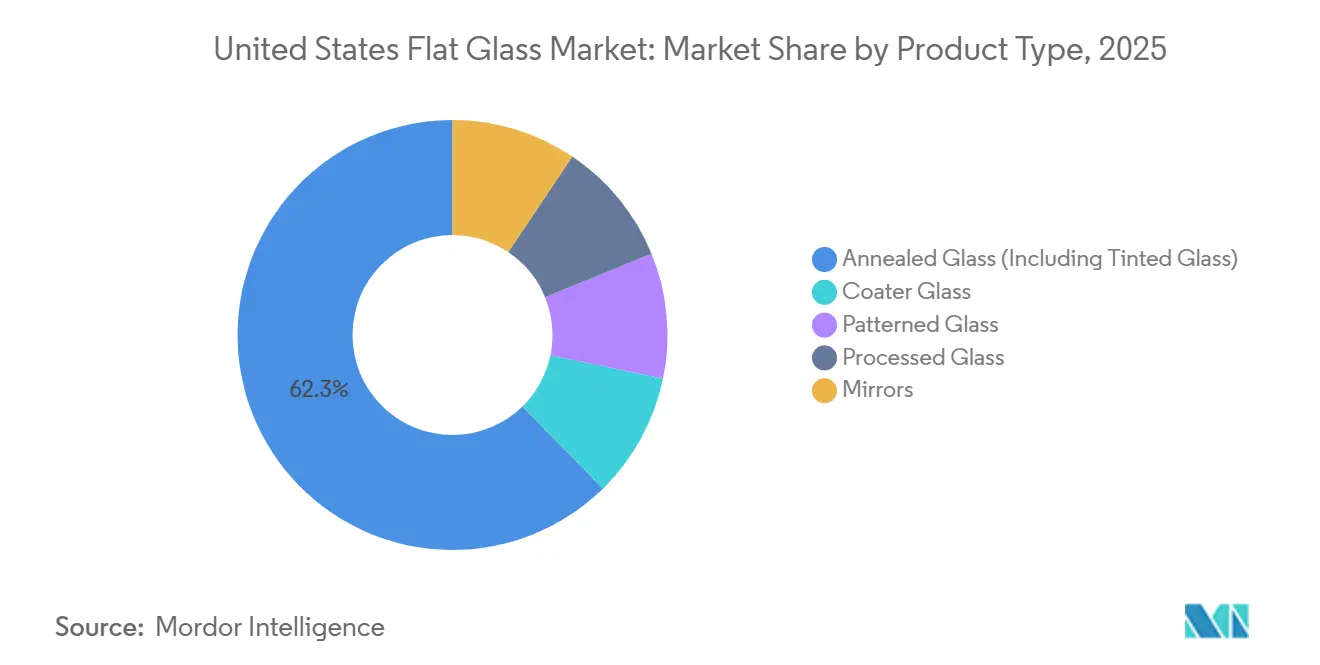
- By product type, annealed glass held 62.33% of the United States Flat Glass market share in 2025, whereas processed glass is projected to outpace with a 6.78% CAGR during the forecast period (2026-2031).
- By coating type, low-E (hard-coat) captured 41.11% revenue in 2025, while solar-control (soft-coat) is forecast to expand at a 7.29% CAGR during the forecast period (2026-2031).
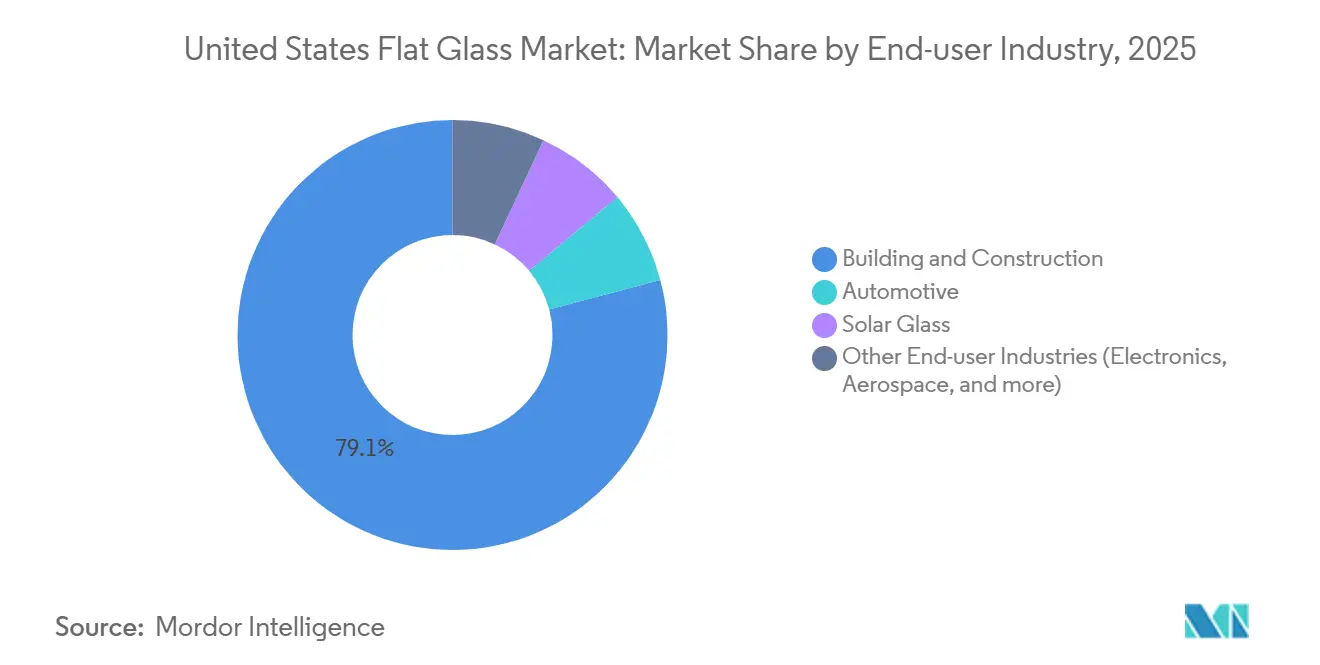
- By end-user industry, building and construction accounted for 79.12% of the United States Flat Glass market size in 2025, and solar applications are advancing at a 7.44% CAGR during the forecast period (2026-2031).
Note: Market size and forecast figures in this report are generated using Mordor Intelligence’s proprietary estimation framework, updated with the latest available data and insights as of January 2026.
United States Flat Glass Market Trends and Insights
Drivers Impact Analysis*
| Driver | (~) % Impact on CAGR Forecast | Geographic Relevance | Impact Timeline |
|---|---|---|---|
| Growing demand for electronic displays | +0.8% | National, concentrated in display-glass hubs (Kentucky, New York) | Medium term (2-4 years) |
| Rising construction-retrofit activity for energy-efficient buildings | +1.2% | National, with accelerated uptake in California, Northeast, Pacific Northwest | Long term (≥ 4 years) |
| Expansion of domestic solar-panel manufacturing under IRA incentives | +1.5% | National, anchored in Ohio, Alabama, Louisiana solar corridors | Medium term (2-4 years) |
| Automotive lightweighting and safety-glazing mandates | +0.9% | National, centered in Michigan, Ohio, South Carolina automotive clusters | Medium term (2-4 years) |
| Emergence of dynamic/smart glass in commercial real estate | +0.6% | National, early adoption in LEED-certified office towers (New York, San Francisco, Seattle) | Long term (≥ 4 years) |
| Source: Mordor Intelligence | |||
Expansion of Domestic Solar-Panel Manufacturing Under IRA Incentives
Federal Section 45X credits pay USD 12 per m² of solar glass, underpinning multi-billion-dollar greenfield projects that insulate vertically integrated lines from merchant-float volatility. First Solar added 3.5 GW lines in Louisiana and Alabama in 2025, bringing the United States' capacity to 14 GW. Pilkington converted its Rossford, Ohio float into a transparent-conductive-oxide supply, illustrating how the United States flat glass market is birthing a parallel solar substrate chain with distinct cost drivers. Loan Programs Office guidance further lowers financing barriers, encouraging new entrants to target solar rather than architectural float.
Rising Construction-Retrofit Activity for Energy-Efficient Buildings
IRA-funded General Services Administration procurement now specifies low-embodied-carbon limits of 1,331 kg CO₂e (carbon dioxide-equivalent)/ton for top-tier flat glass, shifting demand toward furnaces with high cullet ratios or electric boosting. Berkeley Lab finds Low-E coatings already cover 80% of United States homes, yet triple-pane units with U-factors below 0.20 are emerging as the next retrofit standard. That dynamic elevates the United States flat glass market as fabricators are able to automate spacer-bar and edge-seal lines, capturing rising per-square-foot values.
Automotive Lightweighting and Safety-Glazing Mandates
Fuyao’s USD 300 million Ohio plant, opened in July 2025, targets head-up-display substrates and smart glass tailored for electric vehicles. Federal Motor Vehicle Safety Standard 205, plus ADAS (advanced driver assistance systems) camera integration, is turning windshields into multifunction sensor platforms. Corning’s Fusion5 glass achieves 12% weight reduction and quadruple impact resistance, showing where differentiation now lies.
Growing Demand for Electronic Displays
Although Corning’s Q4 2025 display revenue fell 5%, coordinated price increases and a mix-shift to larger Gen 10.5 substrates lifted global display-glass revenues to a record JPY 270 billion. Concentrated facilities in Kentucky and New York ensure that the United States flat glass market benefits from specialized output even as volume growth slows.
Restraints Impact Analysis*
| Restraint | (~) % Impact on CAGR Forecast | Geographic Relevance | Impact Timeline |
|---|---|---|---|
| Tightening US carbon-emission rules on float furnaces | -0.7% | National, acute in California and Northeast states with cap-and-trade programs | Medium term (2-4 years) |
| Skilled-labor shortages in advanced glass processing | -0.5% | National, most severe in Midwest and Southeast fabrication hubs | Long term (≥ 4 years) |
| Competition from imported low-cost processed glass | -0.4% | National, concentrated in architectural and residential segments | Short term (≤ 2 years) |
| Source: Mordor Intelligence | |||
Tightening US Carbon-Emission Rules on Float Furnaces
EPA Subpart N reporting plus particulate and SOx limits under Subpart CC compel costly abatement retrofits; Guardian’s 2024 closure of its Kingsburg, California float underscores vulnerability to regional energy and carbon policies[1]Environmental Protection Agency, “GHG Reporting Program Subpart N,” epa.gov. Producers must decide whether to invest in electric boosting, relocate, or exit commodity float, pushing the United States flat glass market toward high-value coatings where margins can absorb compliance premiums.
Skilled-Labor Shortages in Advanced Glass Processing
BLS counted 84,200 glass-product workers in 2024; only 10,000-15,000 are in flat glass. Fuyao’s expansions need 1,200 hires by 2027, yet community colleges lack tailored programs, elongating ramp-up timelines, and favoring incumbents with in-house academies.
*Our forecasts treat driver/restraint impacts as directional, not additive. The impact forecasts reflect baseline growth, mix effects, and variable interactions.
Segment Analysis
By Product Type: Processed Glass Gains as Safety Codes Tighten
Annealed Glass retained 62.33% of 2025 revenue, yet its share is slipping as hurricanes, blasts, and overhead codes move more applications to tempered or laminated forms. Processed Glass expanded at a 6.78% CAGR during the forecast period (2026-2031), outstripping the overall United States Flat Glass market. The United States flat glass market size for processed offerings rose in tandem with code adoption, rewarding integrated shops able to move quickly from cutting to tempering to edge-sealing.
Fabricators that consolidate tempering, laminating, gas filling, and quality inspection on one line earn roughly 30-40% higher revenue per square foot than peers selling stand-alone annealed sheets[2]LiSEC, “Integrated Float-to-IGU Production Lines,” lisec.com. New installs from Glaston and Fenzi’s E-Coat printing platform validate the capital shift toward downstream automation, reinforcing the momentum behind processed product leadership inside the United States Flat Glass market.


By Coating Type: Soft-Coat Solar-Control Products Accelerate
Low-E (Hard-Coat) commanded 41.11% in 2025, yet Soft-Coat Solar-Control products are growing with a CAGR of 7.29% during the forecast period (2026-2031), lifted by bifacial solar modules and building-integrated photovoltaics. Against that backdrop, the United States Flat Glass market share for soft coats is poised to widen as silver-stack sputtering unlocks emissivity below 0.04 and visible transmittance above 70%.
Innovation is reinforcing this trajectory. Rice University’s 2025 carbon-doped boron-nitride coating eliminates silver while preserving durability, and hydrophobic self-cleaning anti-reflective layers from European labs couple maintenance savings with energy-yield gains. Because each magnetron coater costs USD 20-40 million, scale operators are best positioned, accelerating a consolidation dynamic in the United States Flat Glass market.
By End-User Industry: Solar Applications Outpace Construction
Building and construction still provided 79.12% of 2025 demand, but solar applications are advancing at a 7.44% CAGR during the forecast period (2026-2031) as First Solar’s 14 GW output and Section 45X credits underpin capacity. Automotive glazing is transforming as head-up displays and electrochromic roofs migrate from luxury to mass segments, carving out premium niches inside the United States flat glass market size for OEM (original equipment manufacturer) supply chains.
The investment cadence contrasts across users. Solar lines are front-loaded for credit capture, commercial retrofit spending rises post-2028 alongside state energy-code ratchets, while automotive volumes depend on EV (electric vehicle) adoption curves and multi-year price agreements. Suppliers serving two or three verticals can balance these cycles, creating a diversification premium that now permeates the United States Flat Glass market.
Geography Analysis
Float capacity is concentrated in the Midwest and South, regions that host six of the nation’s active float lines and account for most of the 10.5 billion lb annual output. The Midwest benefits from proximity to automotive clusters in Michigan and Ohio, where Fuyao, Pilkington, and Carlex run integrated float-to-laminate campuses that shorten OEM logistics windows. In contrast, California’s stringent cap-and-trade regime forced Guardian to shutter its Kingsburg furnace, illustrating how geography shapes asset viability in the United States flat glass market.
Southern states leverage low natural-gas prices and right-to-work laws, attracting solar-glass investment under the Inflation Reduction Act corridor stretching from Alabama through Louisiana. First Solar selected Louisiana for its 3.5 GW line, and Stewart Glass will spend USD 9.6 million in Ohio on a USDA (United States Department of Agriculture)-backed float rebuild that also targets solar fabs up the river valley. These moves cement the South’s role as the fastest-growing regional consumer and producer inside the United States flat glass market.
The Northeast remains retrofit-heavy. Dense building stock in New York and Boston drives above-average demand for triple-pane IGUs (insulating glass units) with soft-coat Low-E layers. State incentives for low-embodied-carbon materials increase the pull for cullet-rich float, but older furnace fleets struggle to meet Scope 1 limits. Consequently, import penetration into ports such as Newark and Philadelphia remains high, keeping pricing disciplined and underscoring the geographic duality that defines the United States flat glass market.
Competitive Landscape
The United States Flat Glass market is moderately consolidated. Downstream, hundreds of regional fabricators battle on two-week lead times and custom IGU sizes, so bargaining power shifts downstream despite the upstream oligopoly. Partnerships are emerging as an alternate model. Pilkington’s long-term supply agreement with First Solar exchanges volume security for pricing concessions. As circularity pressures mount, recyclers may become critical partners, adding another dimension of advantage in the United States Flat Glass market.
United States Flat Glass Industry Leaders
Saint-Gobain
AGC Inc.
Guardian Industries
CARDINAL GLASS INDUSTRIES, INC
Vitro
- *Disclaimer: Major Players sorted in no particular order

Recent Industry Developments
- March 2026: Corning Incorporated unveiled its latest innovation, the Corning Gorilla Glass Ceramic 3. Touted as the toughest Gorilla Glass Ceramic to date, this new offering aims to bolster device durability throughout its lifespan.
- February 2026: Stewart Glass announced plans to invest over USD 9.6 million in a new flat glass production facility in Logan, Ohio. This move comes on the heels of a USD 16.4 million loan from the US Department of Agriculture (USDA) Rural Development, aimed at expanding and modernising the existing flat glass facility.


United States Flat Glass Market Report Scope
Flat glass, often called sheet or plate glass, is frequently used to create solar panels, windows, mirrors, and doors. Sand, silica, limestone, and soda ash are melted to create the liquid, which is then cooled to create the product of the required thickness.
The United States Flat Glass market report is segmented by product type, coating type, and end-user industry. By product type, the market is segmented into annealed glass (including tinted glass), coater glass, patterned glass, processed glass, and mirrors. By coating type, the market is segmented into low-E (hard-coat), solar-control (soft-coat), self-cleaning, anti-reflective, and others. By End-user Industry, the market is segmented into building and construction, automotive, solar glass, and other end-user industries (electronics, aerospace, and more). The report also offers the market size and forecasts in value (USD).
| Annealed Glass (Including Tinted Glass) |
| Coater Glass |
| Patterned Glass |
| Processed Glass |
| Mirrors |
| Low-E (Hard-Coat) |
| Solar-Control (Soft-Coat) |
| Self-Cleaning |
| Anti-Reflective |
| Others |
| Building and Construction |
| Automotive |
| Solar Glass |
| Other End-user Industries (Electronics, Aerospace, and more) |
| By Product Type | Annealed Glass (Including Tinted Glass) |
| Coater Glass | |
| Patterned Glass | |
| Processed Glass | |
| Mirrors | |
| By Coating Type | Low-E (Hard-Coat) |
| Solar-Control (Soft-Coat) | |
| Self-Cleaning | |
| Anti-Reflective | |
| Others | |
| By End-User Industry | Building and Construction |
| Automotive | |
| Solar Glass | |
| Other End-user Industries (Electronics, Aerospace, and more) |


Key Questions Answered in the Report
What is the projected value of the United States Flat Glass market in 2031?
United States Flat Glass Market is forecast to reach USD 16.91 billion by 2031.
How fast is solar-application demand growing?
Solar Applications are expanding at a 7.44% CAGR between 2026-2031.
Which product segment is gaining share the quickest?
Processed Glass is advancing at a 6.78% CAGR as safety codes tighten.
What recent trade measures affect domestic pricing?
February 2026 anti-dumping and countervailing duties on Chinese and Malaysian float glass have stabilized upstream prices.
Why are soft-coat Low-E products outpacing hard-coat alternatives?
Soft-coat variants deliver superior emissivity and are in high demand for bifacial solar modules and high-performance façades.
Page last updated on:


