Fluorspar Market Size and Share
Market Overview
| Study Period | 2021 - 2031 |
|---|---|
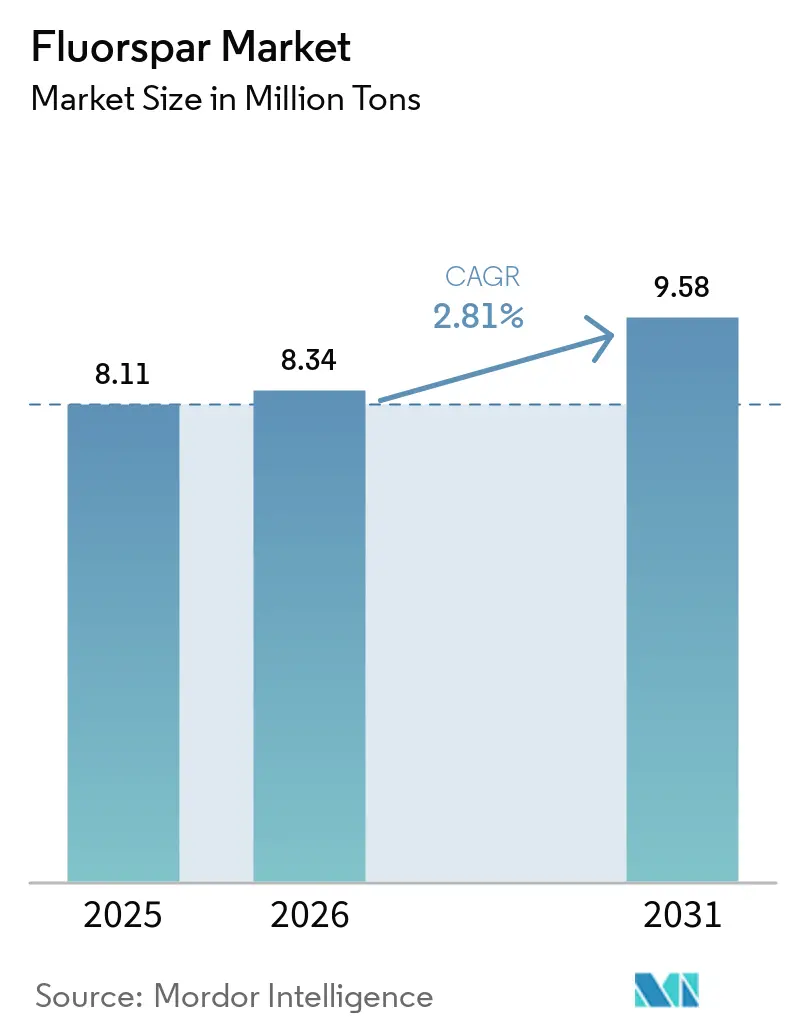
| Market Volume (2026) | 8.34 Million tons |
| Market Volume (2031) | 9.58 Million tons |
| Growth Rate (2026 - 2031) | 2.81% CAGR |
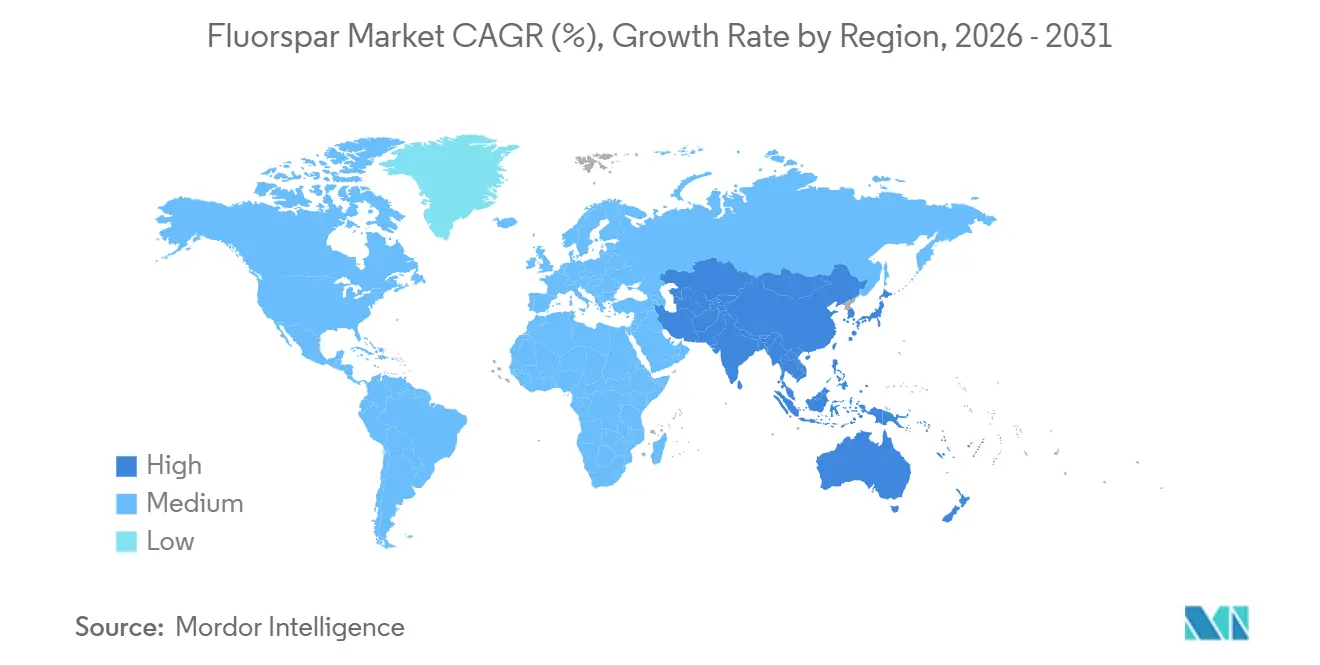
| Fastest Growing Market | Asia Pacific |
| Largest Market | Asia Pacific |
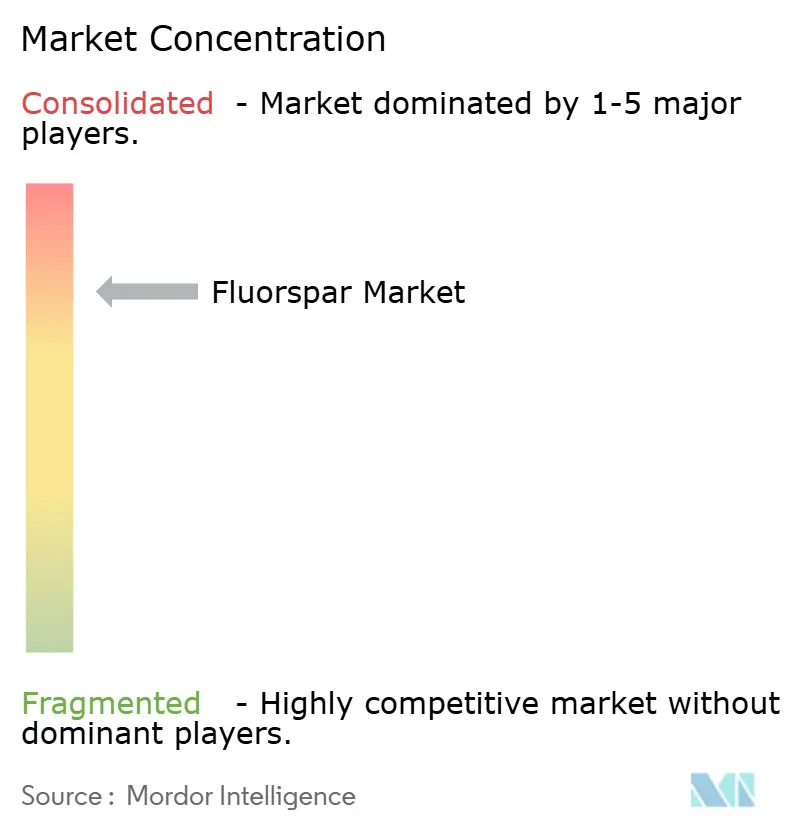
| Market Concentration | High |
Major Players *Disclaimer: Major Players sorted in no particular order Image © Mordor Intelligence. Reuse requires attribution under CC BY 4.0. | |
Fluorspar Market Analysis by Mordor Intelligence
The Fluorspar Market size was valued at 8.11 million tons in 2025 and is estimated to grow from 8.34 million tons in 2026 to reach 9.58 million tons by 2031, at a CAGR of 2.81% during the forecast period (2026-2031). Battery-grade aluminum fluoride and lithium hexafluorophosphate are now incorporating premium acidspar into their electrochemical processes, reaping margins two to three times higher than those of commodity met-spar. While overcapacity in the steel sector hampers Met-Spar growth, demand remains robust, buoyed by expanding aluminum smelters in the Gulf and the rise of new electric-arc furnaces in the Asia-Pacific region. Beginning January 2026, China's new export-license regime will curtail spot cargo availability. At the same time, U.S. production credits, along with a Department of Defense award to a mining company, are spurring a significant wave of on-shoring in North America. Meanwhile, lapidary-grade fluorite, though niche, is attracting attention from collectors and specialty-optics orders, marking a steady growth path through the forecast period of 2026–2031.
Key Report Takeaways
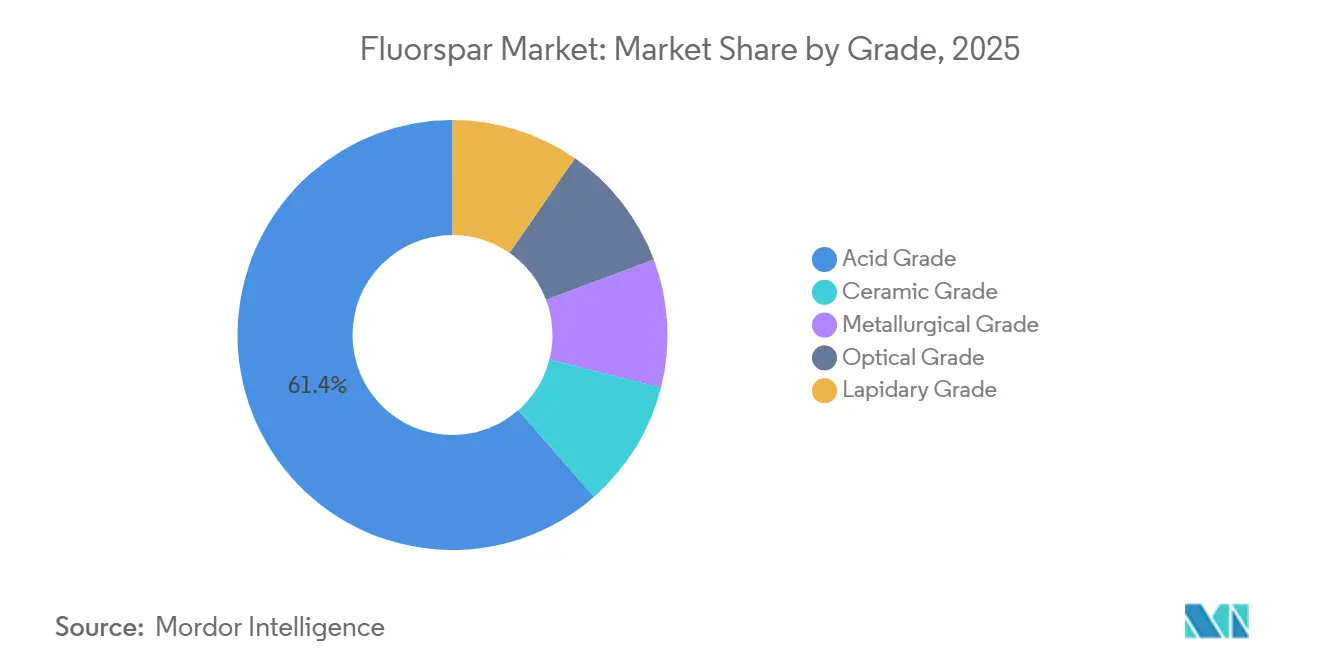
- By grade, acid-grade material captured 61.44% of the fluorspar market share in 2025, while lapidary grade is forecast to expand at a 4.33% CAGR in the forecast period (2026-2031).
- By variety, antozonite led with 27.15% volume in 2025, whereas yttrocerite is projected to post the fastest 2.96% CAGR in the forecast period (2026-2031).
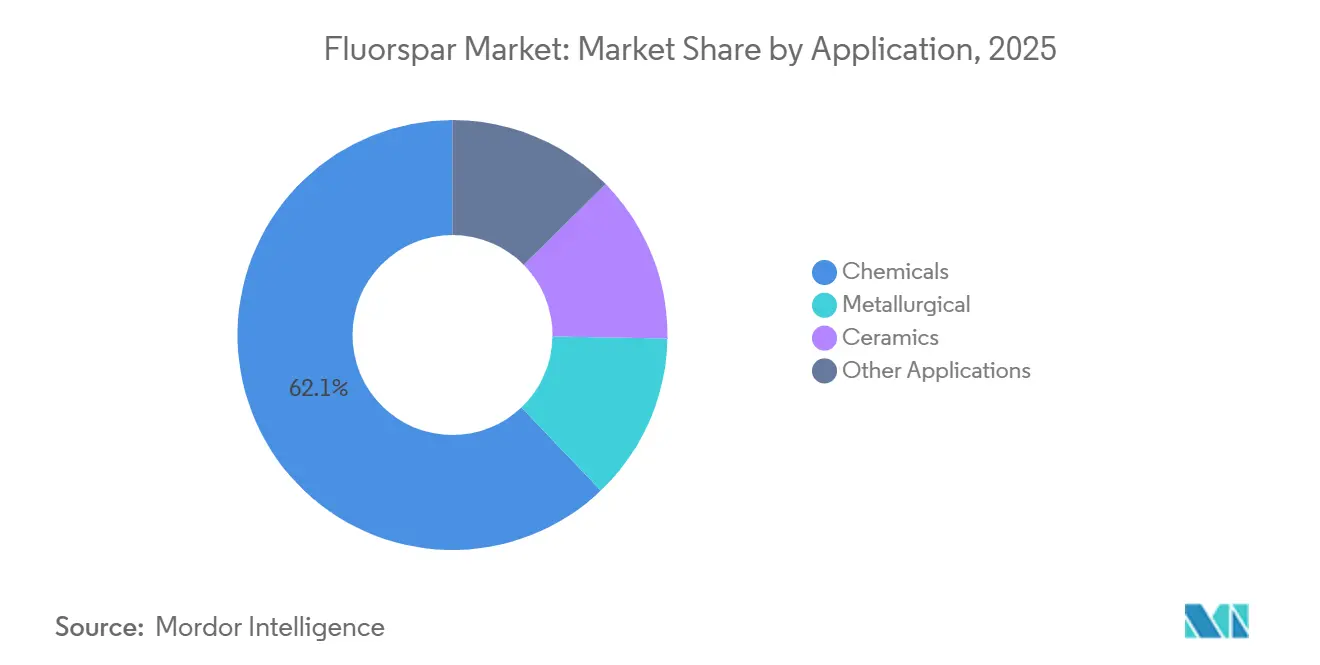
- By application, chemicals commanded 62.12% of the 2025 base year, supporting the overall fluorspar market size with metallurgical uses advancing at a 3.25% CAGR in the forecast period (2026-2031).
- By geography, Asia-Pacific accounted for 74.22% of 2025 consumption and is set to grow at the highest 3.04% CAGR during the forecast period (2026-2031).
Note: Market size and forecast figures in this report are generated using Mordor Intelligence’s proprietary estimation framework, updated with the latest available data and insights as of 2026.
Global Fluorspar Market Trends and Insights
Drivers Impact Analysis*
| Drivers | (~) % Impact on CAGR Forecast | Geographic Relevance | Impact Timeline |
|---|---|---|---|
| Rising steel and aluminum output in Asia and MENA | +0.6% | Asia-Pacific core, MENA secondary | Medium term (2-4 years) |
| Battery-grade AlF₃ demand from Li-ion gigafactories | +0.9% | Global, concentrated in China, South Korea, India | Long term (≥ 4 years) |
| Growth in LiPF₆ electrolyte salts for Electric Vehicles | +0.7% | Global, led by Asia-Pacific and North America | Long term (≥ 4 years) |
| Semiconductor-etching gases need ultra-pure acidspar | +0.4% | North America, East Asia (Taiwan, South Korea) | Medium term (2-4 years) |
| Western "critical-mineral" on-shoring incentives | +0.5% | North America and EU | Short term (≤ 2 years) |
| Source: Mordor Intelligence | |||
Rising Steel and Aluminum Output in Asia and MENA
From 2025 to 2027, steel mills plan significant annual capacity boosts, predominantly in China and India. This expansion highlights the ongoing significance of met-spar, even as steel demand experiences only modest growth. In the Gulf, aluminum smelters' consumption of aluminum fluoride for each ton of metal produced is driving up the use of acid-grade fluorspar. This trend is notably enhancing regional consumption. In Baotou, China, Baotou Steel processed a considerable amount of concentrate in the initial three quarters of 2025. The company also fine-tuned its operations, achieving a more efficient hydrofluoric acid conversion ratio. Concurrently, Middle-Eastern smelters are leveraging low-cost gas, solidifying a consistent demand for flux. Together, these factors are fostering modest volume growth in the fluorspar market, with prices remaining stable.
Battery-Grade AlF₃ Demand from Li-Ion Gigafactories
Electric-vehicle gigafactories are increasingly utilizing fluorine compounds sourced from fluorspar for each vehicle. The International Finance Corporation has supported GFCL's electrolyte-salt facility in India, ensuring a local source for acidspar feed[1]International Finance Corporation, “GFCL EV India Electrolyte-Salt Facility Financing,” IFC, ifc.org. In recent years, Zhejiang Jianli and Jiangxi Fuli have expanded their LiPF₆ capacities, and Tianci Materials plans to introduce additional capacity by 2027. The demand for battery-grade AlF₃, known for its stringent purity requirements, is predominantly concentrated on the top tier of acid-grade output, often commanding a premium over standard commodity grades. Looking ahead to the forecast period of 2026–2031, FluoRok's pilot recycling initiative may contribute to the supply chain.
Growth in LiPF₆ Electrolyte Salts for EVs
Do-Fluoride has inaugurated a new LiPF₆ plant in Henan, China, sourcing HF from its proprietary fluorspar concentrators. In 2025, Orbia expanded its electrolyte facility in Madison, Wisconsin, tripling its capacity and ensuring four-week delivery times for clients in the energy-storage and aerospace industries. The electrolyte segment is projected to grow significantly during the forecast period of 2026–2031. Producing one ton of LiPF₆ requires HF, which is derived from approximately 97% acidspar. This back integration is causing fragmentation of merchant tonnage within the fluorspar market.
Semiconductor-Etching Gases Need Ultra-Pure Acidspar
As TSMC and Samsung ramp up their sub-5 nm fabs, the demand for electronic-grade HF has surged. To provide perspective, a single 300 mm fab's annual HF consumption is equivalent to a significant amount of premium acidspar. Additionally, the U.S. CHIPS Act, with grants valid until 2026, has increased domestic demand. In China, Luoyang Fengrui is now distilling high-purity HF specifically for foundries. Only Inner Mongolia and South Africa possess the ore required for cost-effective electronic-grade upgrading, creating regional chokepoints. As a result, price premiums have risen significantly during shortages.
Restraints Impact Analysis*
| Restraints | (~) % Impact on CAGR Forecast | Geographic Relevance | Impact Timeline |
|---|---|---|---|
| Natural-grade resource depletion in China and Mexico | -0.4% | China, Mexico, spillover to North America | Long term (≥ 4 years) |
| China export-quota volatility and freight bottlenecks | -0.5% | Global, acute in Asia-Pacific and North America | Short term (≤ 2 years) |
| Substitution by FSA-derived HF | -0.3% | North America, Europe | Medium term (2-4 years) |
| Source: Mordor Intelligence | |||
Natural-Grade Resource Depletion in China and Mexico
In Hunan and Zhejiang, average head grades continue to decline, while stripping ratios are on the rise. This trend is nudging unit costs higher, despite some efficiency gains. Stricter approvals for exploration are dampening operating rates, and the need to purchase external ore introduces quality assurance risks. Mexico, with a significant reserve base, caters to a substantial portion of U.S. fluorspar needs. However, since 2020, new mine investments have hit a standstill, limiting exports even as demand in the U.S. fluorspar market strengthens. Consequently, marginal supplies are now being sourced from Mongolia and Kenya, incurring a delivered cost that is higher for North America and Europe.
China Export-Quota Volatility and Substitution by FSA-Derived HF
Spot buyers faced disruptions due to paperwork delays and unpredictable quota volumes from export licenses under Announcements 88-89. The congestion at Qingdao and Shanghai ports in Q1 2025 extended lead times by several weeks, escalating both safety stock levels and associated costs. In 2024, HF, sourced from fluorosilicic acid, emerged as a cost-effective option for non-electronic applications. This pricing advantage prompted a pivot toward HF as a preferred substitute in aluminum fluoride and water treatment products. As a result, the fluorspar market fragmented into regional silos, which forced end-users to adopt dual-source strategies.
*Our forecasts treat driver/restraint impacts as directional, not additive. The impact forecasts reflect baseline growth, mix effects, and variable interactions.
Segment Analysis
By Grade: Premium Acidspar Captures Battery Margin
In 2025, acid-grade, which accounted for 61.44% of the of the fluorspar market share by volume, served as the backbone for hydrofluoric acid chains. These chains subsequently supplied refrigerants, aluminum fluoride, and battery electrolytes. Meanwhile, lapidary-grade, on a growth trajectory with a 4.33% CAGR, has begun absorbing high-purity crystals once reserved for ceramics. A price dip in South Africa during Q2 2025 triggered a notable volume rebound, as European smelters seized the opportunity to restock. This event highlights the fluorspar market's acute sensitivity to price shifts[2]Department of Mineral Resources and Energy, “Mineral Production Q2 2025,” DMRE.GOV.ZA, dmre.gov.za.
Process control plays a pivotal role in margin differentiation. Jinshi Resources’ Baotou complex reported a concentrate-to-HF ratio below the industry standard, showcasing a reduction in raw-material intensity. Orbia, with its sights set on the synthetic met-spar market, anticipates a boost in EBITDA by 2027, signaling intensifying competition in specialty fluxes, extending beyond traditional mining boundaries. The forecast period for this analysis is 2026–2031.


By Variety: Antozonite Dominates, Yttrocerite Niche Expands
In 2025, Antozonite accounted for a significant 27.15% share of the volume, primarily attracting the attention of collectors and researchers studying radiation damage. Yttrocerite, on the other hand, is experiencing the fastest growth at a 2.96% CAGR during the forecast period of 2026–2031, driven by its integration as a rare-earth-doped optical material in LED and display supply chains. Although Blue John and chlorophane contribute only a small tonnage, their decorative appeal ensures they command price premiums. Industrial buyers prioritize grade and purity, meaning that the variety of the material only influences pricing when it possesses collectible or optical attributes. Strong demand for specialty applications is diverting high-purity tonnage from the broader fluorspar market, tightening availability for lower-margin uses.
By Application: Chemicals Lead, Metallurgical Uses Rebound
In 2025, chemicals accounted for 62.12% of applications, with lithium-ion salts and semiconductor etchants leading the charge into value-added chains. Demand for metallurgical flux is set to grow at a top 3.25% CAGR until 2031, driven by capacity additions in Asia and the Gulf, overshadowing global overcapacity concerns.
The chemicals sector is undergoing a transformation: while commodity HF used in refrigerants is facing substitution by FSA, battery and semiconductor grades continue to be both price-sensitive and lucrative. Tianci's expansion in LiPF₆ could lead to additional demand for acid-grade concentrate by 2027. This trend is likely to shift fluorspar market share from met-spar to the more premium acidspar.
Geography Analysis
Asia-Pacific, accounting for 74.22% of the 2025 tonnage, is projected to grow at a 3.04% CAGR through the forecast period of 2026–2031. The growth is supported by China's reserves and its integrated beneficiation-to-HF complexes, reinforcing the region's position in the fluorspar market. While safety rectifications in China maintain low utilization rates, thus supporting prices, new complexes in Inner Mongolia ensure a consistent supply for battery-grade chains. Mongolia, with its significant output, predominantly ships its production to China and Russia via rail. In 2022, Vietnam's production, along with the planned capacity at Nui Phao, guarantees the region's self-sufficiency in ceramics and chemicals.
North America, despite its reliance on imports, is experiencing growth fueled by proactive policy initiatives in the fluorspar market. The United States 45X tax credit, combined with funding from the Department of Defense (DoD), has paved the way for Lost Sheep to emerge as the first domestic acidspar mine in decades, targeting production by late 2026. Although Mexico holds substantial reserves, its aging infrastructure hampers exports. Nonetheless, freight to the United States HF plants remains crucial. Furthermore, semiconductor fabs, energized by the CHIPS Act, are poised to heighten demand for premium acidspar, amplifying North America's appetite.
Europe predominantly sources materials from China, South Africa, and Mongolia in the fluorspar market. However, the Critical Raw Materials Act is steering the continent towards diversification. Consequently, smelters are increasingly turning to African supplies and European prospects, such as France's Montroc deposit. In 2025, a price dip catalyzed a notable surge in South Africa's sales. On another front, Kenya's Kimwarer project, now with secured financing, is gearing up for a restart and aims to produce significant volumes by 2027, targeting Indian HF plants.

Competitive Landscape
The global fluorspar market is consolidated. Producers outside China are focusing on regional markets. Mongolrostsvetmet and MongolCzech Metal are directing their shipments to China and Russia. Key strategies include backward integration and niche positioning. Orbia is investing in synthetic met-spar as a strategic move to address feedstock shortages. Companies are acquiring mines to enhance their production of LiPF₆ and fluoropolymers, effectively shielding their profit margins from market volatility. Additionally, innovations such as FluoRok’s closed-loop AlF₃ process in ultra-pure acidspar and recycling underscore a rising competitive advantage.
Fluorspar Industry Leaders
China Kings Resources Group Co., Ltd.
Sinochem Group Co., Ltd.
Fluorsid
MINERSA GROUP
Masan High-Tech Materials Corporation
- *Disclaimer: Major Players sorted in no particular order

Recent Industry Developments
- June 2025: Ares Strategic Mining secured USD 11 million from the Utah State Legislature to accelerate acidspar and gallium output at Lost Sheep, the largest U.S. state-level fluorspar investment since the 1990s.
- December 2024: Masan High-Tech Materials signed an MoU with Fluorine Korea to supply up to 70,000 tons of acid-grade fluorspar annually for a South Korean AHF plant slated for 2026 start-up.


Global Fluorspar Market Report Scope
Fluorspar, or fluorite, is the mineral form of calcium fluoride. CaF2 is a chemical, calcium fluoride, a type of halide mineral. Although isometric cubic crystallization is prevalent, octahedral and more complicated isometric forms are also common in the material.
The fluorite market is segmented by grade, variety, application, and geography. By grade, the market is segmented into acid grade, ceramic grade, metallurgical grade, optical grade, and lapidary grade. By variety, the market is segmented into antozonite, blue john, chlorophane, yttrocerite, yttrofluorite, and other varieties. By application, the market is segmented into metallurgical, ceramics, chemicals, and other applications (optical, glass, cement, and coatings). The report also covers the market size and forecasts for the market in 28 countries across major regions. For each segment, the market sizing and forecasts are done based on volume (Tons).
| Acid Grade |
| Ceramic Grade |
| Metallurgical Grade |
| Optical Grade |
| Lapidary Grade |
| Antozonite |
| Blue John |
| Chlorophane |
| Yttrocerite |
| Yttrofluorite |
| Other Varieties |
| Metallurgical |
| Ceramics |
| Chemicals |
| Other Applications (Optical, Glass, Cement, and Coatings) |
| Asia-Pacific | China |
| India | |
| Japan | |
| South Korea | |
| Malaysia | |
| Thailand | |
| Indonesia | |
| Vietnam | |
| Rest of Asia-Pacific | |
| North America | United States |
| Canada | |
| Mexico | |
| Europe | Germany |
| United Kingdom | |
| France | |
| Italy | |
| Spain | |
| Nordic Countries | |
| Turkey | |
| Russia | |
| Rest of Europe | |
| South America | Brazil |
| Argentina | |
| Colombia | |
| Rest of South America | |
| Middle-East and Africa | Saudi Arabia |
| United Arab Emirates | |
| Qatar | |
| Nigeria | |
| Egypt | |
| South Africa | |
| Rest of Middle-East and Africa |
| By Grade | Acid Grade | |
| Ceramic Grade | ||
| Metallurgical Grade | ||
| Optical Grade | ||
| Lapidary Grade | ||
| By Variety | Antozonite | |
| Blue John | ||
| Chlorophane | ||
| Yttrocerite | ||
| Yttrofluorite | ||
| Other Varieties | ||
| By Application | Metallurgical | |
| Ceramics | ||
| Chemicals | ||
| Other Applications (Optical, Glass, Cement, and Coatings) | ||
| By Geography | Asia-Pacific | China |
| India | ||
| Japan | ||
| South Korea | ||
| Malaysia | ||
| Thailand | ||
| Indonesia | ||
| Vietnam | ||
| Rest of Asia-Pacific | ||
| North America | United States | |
| Canada | ||
| Mexico | ||
| Europe | Germany | |
| United Kingdom | ||
| France | ||
| Italy | ||
| Spain | ||
| Nordic Countries | ||
| Turkey | ||
| Russia | ||
| Rest of Europe | ||
| South America | Brazil | |
| Argentina | ||
| Colombia | ||
| Rest of South America | ||
| Middle-East and Africa | Saudi Arabia | |
| United Arab Emirates | ||
| Qatar | ||
| Nigeria | ||
| Egypt | ||
| South Africa | ||
| Rest of Middle-East and Africa | ||


Key Questions Answered in the Report
What volume growth is projected for global demand for fluorspar to 2031?
Demand is forecast to rise from 8.34 million tons in 2026 to 9.58 million tons by 2031, reflecting a 2.81% CAGR.
How will China’s new export-license rules affect North American buyers?
License requirements add administrative delays and tighter allocations, pushing North American companies to secure domestic or Mexican supply under 45X incentives.
Which fluorspar grade shows the highest growth rate?
Lapidary-grade fluorite leads at a 4.33% CAGR through 2031 on specialty optics and collector demand.
Why is acid-grade fluorspar in higher demand than metallurgical grade?
Battery electrolytes, semiconductor etchants, and aluminum fluoride need high-purity acidspar, driving stronger margins and pulling premium concentrates from the supply chain.
Page last updated on:


