
Market Overview
| Study Period | 2020 - 2031 |
|---|---|
| Forecast Data Period | 2026 - 2031 |
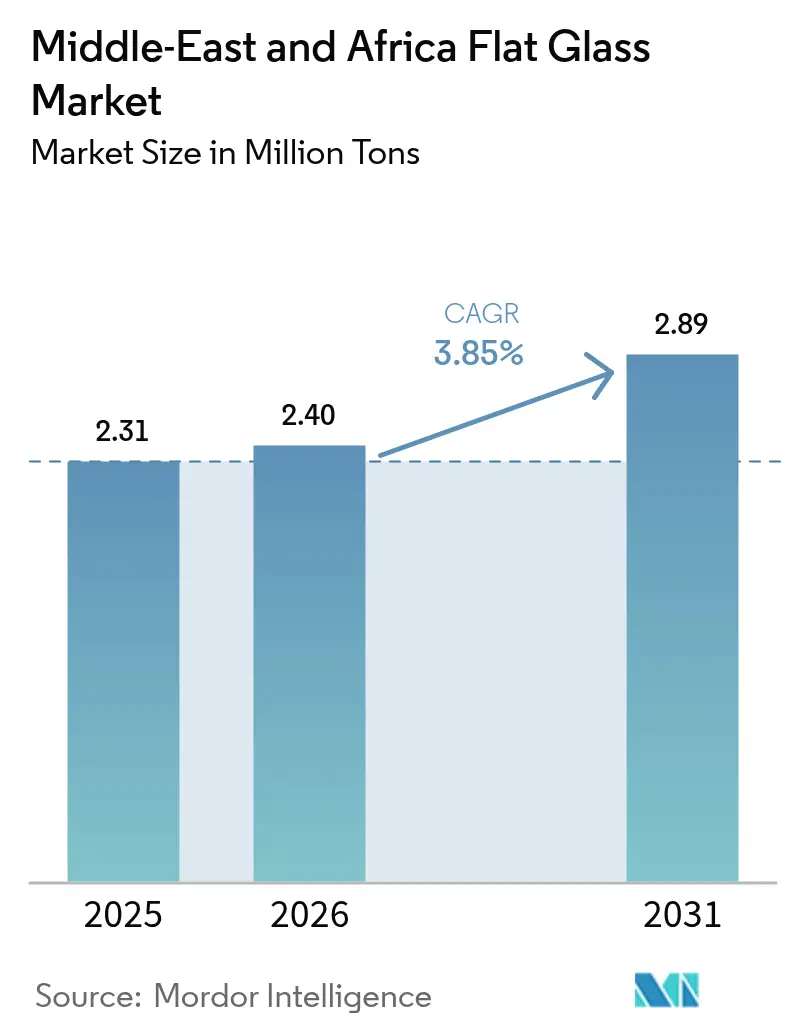
| Base Year Market Size (2025) | 2.31 Million tons |
| Market Volume (2026) | 2.4 Million tons |
| Market Volume (2031) | 2.89 Million tons |
| Growth Rate (2026 - 2031) | 3.85 % |
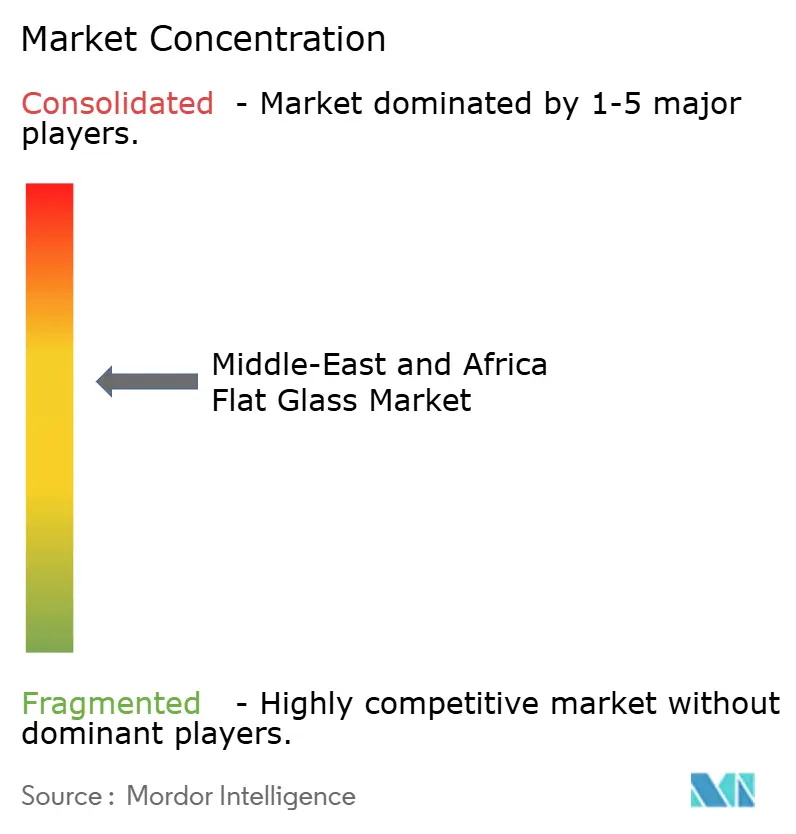
| Market Concentration | Medium |
Major Players *Disclaimer: Major Players sorted in no particular order Image © Mordor Intelligence. Reuse requires attribution under CC BY 4.0. | |
Middle-East And Africa Flat Glass Market Analysis by Mordor Intelligence
The Middle East and Africa Flat Glass Market size was valued at 2.31 million tons in 2025 and estimated to grow from 2.4 million tons in 2026 to reach 2.89 million tons by 2031, at a CAGR of 3.85% during the forecast period (2026-2031). Robust capital spending on mixed-use urban districts, renewable-energy clusters, and automotive localization programs sustains this expansion. Large-scale construction programs in Saudi Arabia, the United Arab Emirates, and Egypt are translating directly into higher float-line utilization rates, tighter regional supply, and rising demand for value-added processing. The rapid adoption of building-integrated photovoltaics and electrochromic glazing is encouraging producers to shift their product mixes toward low-iron, low-E, and smart-glass variants, which carry stronger margins. At the same time, strategic investments in furnace capacity across Saudi Arabia and Egypt are enhancing self-sufficiency, shielding buyers from import price fluctuations, and facilitating shorter lead times for complex orders. Nevertheless, the industry’s cost position remains vulnerable to natural-gas volatility and soda-ash price shocks, reinforcing the importance of energy-efficiency retrofits and vertically integrated raw-material sourcing.
Key Report Takeaways
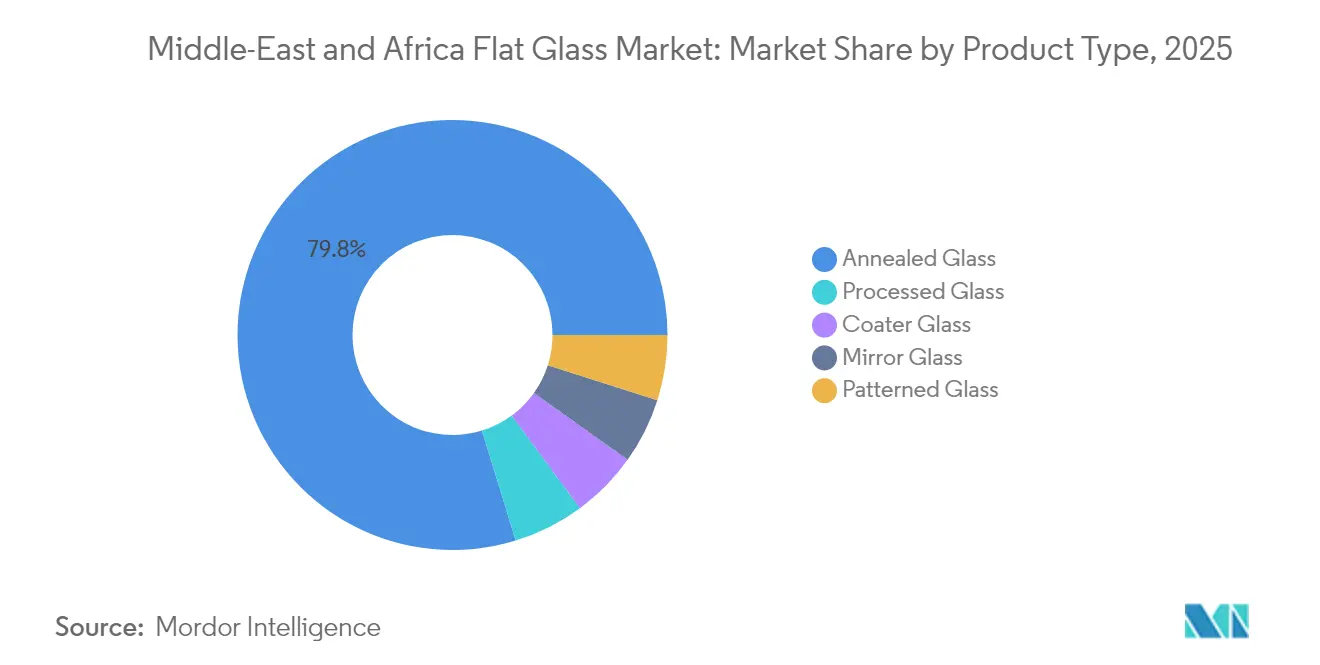
- By product type, annealed glass led with 79.75% of the Middle East and Africa flat glass market share in 2025, while processed glass is projected to expand at a 4.62% CAGR through 2031.
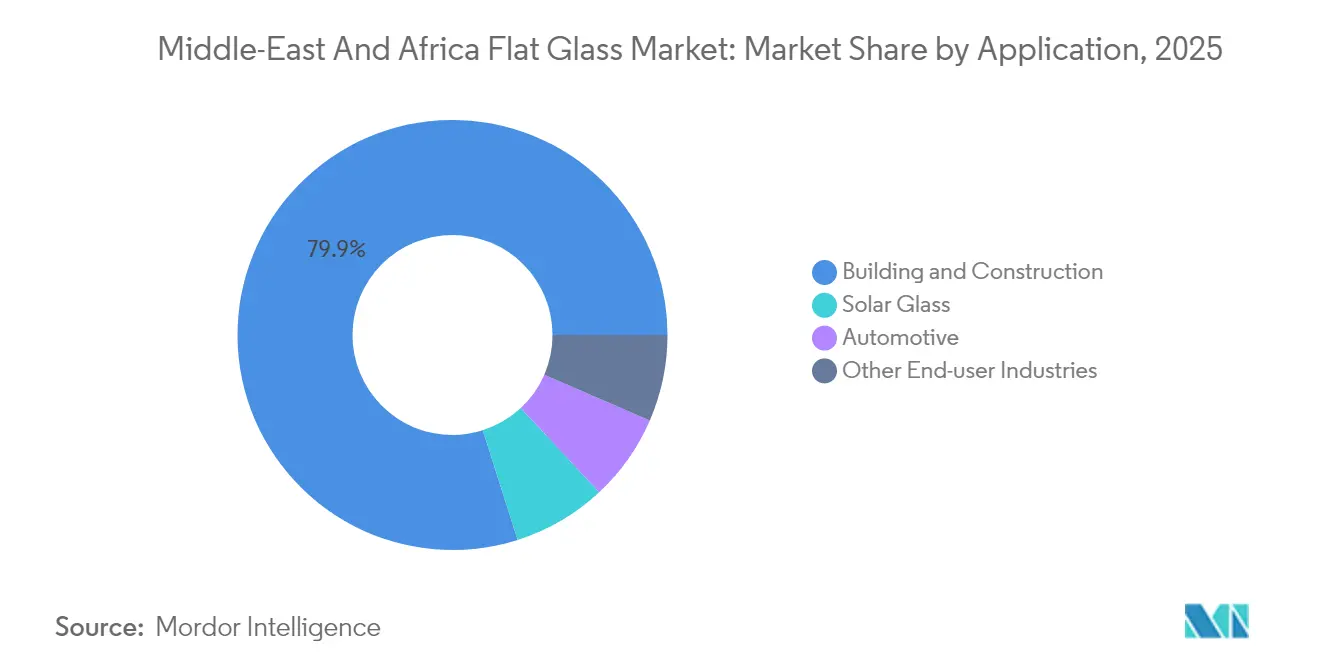
- By application, building and construction accounted for 79.90% of the Middle East and Africa flat glass market size in 2025; solar glass is projected to advance at a 6.41% CAGR through 2031.
- By geography, Saudi Arabia held a 56.70% revenue share of the Middle East and Africa flat glass market in 2025 and is forecast to post the highest CAGR of 4.55% during 2026-2031.
Note: Market size and forecast figures in this report are generated using Mordor Intelligence’s proprietary estimation framework, updated with the latest available data and insights as of 2026.
Market Trends and Insights
Drivers Impact Analysis of Middle-East And Africa Flat Glass Market*
| Driver | (~) % Impact on CAGR Forecast | Geographic Relevance | Impact Timeline |
|---|---|---|---|
| Construction mega-projects pipeline (GCC and North Africa) | + 1.2% | GCC core, spillover to North Africa | Medium term (2-4 years) |
| Expanding regional automotive production clusters | + 0.8% | Saudi Arabia, UAE, Egypt | Long term (≥ 4 years) |
| Utility-scale solar and BIPV build-outs | + 0.6% | Global MEA, concentrated in GCC and Egypt | Medium term (2-4 years) |
| Green-building mandates for low-E / smart glazing | + 0.5% | UAE, Saudi Arabia, Qatar | Short term (≤ 2 years) |
| Signature tourism and giga-projects driving specialty curved glass | + 0.4% | Saudi Arabia, UAE | Long term (≥ 4 years) |
| Source: Mordor Intelligence | |||
Construction Mega-Projects Pipeline
Massive mixed-use cities, tourism enclaves, and industrial corridors across the Gulf Cooperation Council and North Africa are locking in multi-year visibility for glass offtake. Saudi Arabia’s Red Sea Project alone secured USD 6.1 billion in contracts covering 50 resorts and 8,000 hotel rooms, including 3,700 square meters of curved façade units. Comparable flagship sites such as NEOM’s Sindalah Island and Egypt’s New Administrative Capital are specifying laminated, low-E, and oversized panels that deliver both aesthetic value and thermal performance. High order density within defined economic zones allows producers to consolidate deliveries, cut logistics costs, and optimize furnace campaigns for specific thickness targets. The International Finance Corporation’s USD 100 million debt package for Egyptian glass expansion underscores financial institutions’ confidence in the region’s construction backlog. Taken together, these mega-projects anchor baseline demand and justify continued capital expenditure on new float lines and coating chambers.
Expanding Regional Automotive Production Clusters
Vehicle-manufacturing incentives in Saudi Arabia, the United Arab Emirates, and Egypt are reshaping the demand for automotive glass. Riyadh’s Automotive Investment Development Program aims for 300,000-500,000 units per year by 2030, with electric-vehicle newcomers such as Ceer and Lucid emphasizing panoramic roofs and HUD-ready windshields. Egypt’s localization roadmap echoes this strategy, catalyzing requirements for laminated windscreens, tempered sidelites, and sunroofs with solar-control films. As OEMs source closer to assembly plants, regional flat-glass converters gain the opportunity to deepen technical partnerships, introduce online quality inspection systems, and roll out just-in-time delivery models. Higher glazing surface area in battery-electric platforms further boosts tonnage per vehicle. Collectively, these automotive clusters diversify sales channels, reduce reliance on imports, and increase overall melting capacity utilization.
Utility-Scale Solar and BIPV Build-Outs
National renewable-energy targets are driving demand for low-iron solar glass. Glass Technology Industries has commissioned a AED 350 million UAE plant capable of supplying 5.5 million modules annually, ensuring regional access to photovoltaic covering sheets. Laboratory trials in Saudi Arabia demonstrate that building-integrated photovoltaics (BIPV) achieve 698 kWh per square meter per year and a 16% utilization factor, solidifying the economic case for BIPV façades. China Glass Holdings aligned its USD 310 million Egyptian complex toward 800 TPD of PV glass, signaling confidence in Gulf solar auctions and African off-grid projects. Producers specializing in anti-reflective coatings, laser-patterned surfaces, and high-transmittance compositions capture premium mark-ups while leveraging float-line synergies for thin ultra-clear substrates. The solar-segment pull-through thus widens product-mix spreads and underpins furnace investment cases.
Green-Building Mandates for Low-E / Smart Glazing
Energy-conservation codes across the GCC mandate superior U-values and visible-light transmittance parameters, pivoting demand toward low-E, electrochromic, and vacuum-insulated glass. Dubai’s green-building regulations and Abu Dhabi’s Estidama framework require envelope compliance that typically favors double silver coatings or dynamic tinting systems[1]. Smart-glass deals, such as the ClearVue-Alutec five-year distribution agreement, illustrate market readiness to deploy electricity-generating windows in both commercial and institutional settings. Standardization through the Gulf Standards Organization facilitates cross-border certification, enabling streamlined consolidations and shorter product development cycles. Subsequent retrofits in existing skyscrapers broaden addressable volumes beyond new starts, while performance-linked lease agreements make high-performance glazing a cost-neutral upgrade for building owners.
Restraints Impact Analysis of Middle-East And Africa Flat Glass Market*
| Restraint | (~) % Impact on CAGR Forecast | Geographic Relevance | Impact Timeline |
|---|---|---|---|
| Volatile energy and soda-ash input prices | -0.70% | Global MEA, concentrated in energy-intensive production | Short term (≤ 2 years) |
| Low-priced Asian imports squeezing local margins | -0.50% | All MEA markets, particularly commodity segments | Medium term (2-4 years) |
| Scarce cullet-recycling infrastructure raises costs | -0.30% | Regional, with acute impact in GCC and North Africa | Long term (≥ 4 years) |
| Source: Mordor Intelligence | |||
Volatile Energy and Soda-Ash Input Prices
Soda-ash quotations jumped EUR 20 per tonne in South Africa during 2024, while European benchmark offers fluctuated between EUR 175 and EUR 195, directly influencing batch costs[2]. Because energy outlays represent 15-20% of furnace operating expense, spikes in spot natural gas immediately compress contribution margins for float producers. Dependence on imported Turkish or Chinese soda ash further exposes regional plants to fluctuations in freight rates and currency mismatches. Although Saudi Arabia has announced the region’s first synthetic soda-ash complex, initial volumes will not fully displace imports, leaving price risk elevated in the near term. To stabilize costs, manufacturers are accelerating cullet recycling, signing fixed-price LNG supply contracts, and piloting solar-assisted melting technologies.
Low-Priced Asian Imports Squeezing Local Margins
Chinese exporters consistently quote dumping margins of 91-344% in third-country markets, a figure mirrored by the Egypt-origin supply that faces provisional duties of 29-38% in South Africa. Egypt imported USD 6.30 million worth of Chinese flat glass in 2024, despite having sizable domestic capacity, underscoring the ongoing price-based competition. As regional lines ramp up, the risk of oversupply persists in commodity 2-4 millimeter clear glass, pressuring free-on-board prices. Gulf producers are responding by segmenting their portfolios, prioritizing jumbo sizes, implementing quick-ship programs, and offering application engineering services, rather than engaging in volume-driven price wars. Nevertheless, margins in basic float remain thin until concerted trade-defense actions or capacity rationalization alleviate regional oversupply.
*Our forecasts treat driver/restraint impacts as directional, not additive. The impact forecasts reflect baseline growth, mix effects, and variable interactions.
Middle-East And Africa Flat Glass Market Segment Analysis
By Product Type:
Annealed Glass Dominance Faces Processing InnovationAnnealed glass retained 79.75% of the Middle East and Africa flat glass market share in 2025 due to its cost advantage in standard façades and entry-level automotive windows. However, processed variants—tempered, laminated, and coated—are projected to log a 4.62% CAGR, fueled by design mandates in giga-projects and stringent energy codes. The Middle East and Africa flat glass market size for processed grades is expected to expand as projects, such as NEOM’s Sindalah, require multi-layer curved panels that meet high safety loads. Producers are therefore installing offline hard-coat magnetron sputtering units and digital printing lines to capture incremental value. Investments like Saint-Gobain’s EUR 300 million Egypt upgrade and Obeikan’s SAR 520 million second float line mark a strategic pivot toward higher-margin SKUs.
Simultaneously, mirror and patterned glass niches are gaining traction in luxury residential towers and high-traffic retail centers, where textured finishes and privacy features command premium prices. Continuous advances in roller-wave control and optical distortion measurement allow local processors to match European quality benchmarks, reducing the historic reliance on imports of polished-edge specialty sheets. As architectural preferences favor oversized panels, regional annealing lehr configurations are being lengthened to handle up to 12-meter glass, reinforcing the relevance of domestic melt capacity in supporting project timelines. Overall, the product-mix shift signals a gradual migration away from commoditized clear float to differentiated offerings embedded with coatings, interlayers, or conductive traces.

By Application:
Solar Glass Acceleration Challenges Construction DominanceBuilding and construction accounted for 79.90% of the Middle East and Africa flat glass market in 2025, driven by skyscraper clusters, hospitality venues, and infrastructure corridors. Despite this scale, solar glass is poised for the fastest 6.41% CAGR, propelled by gigawatt-scale tender pipelines and rooftop feed-in incentives. The Middle East and Africa flat glass market size for solar-specific low-iron substrates is therefore set to climb disproportionately, eroding construction’s share of incremental tonnage over the forecast horizon. Utility-scale farms in the UAE’s Al Dhafra and Egypt’s Benban zones, alongside BIPV façades in Dubai and Riyadh, are specifying high-transmittance, anti-reflective plates that local plants are now gearing up to produce.
Automotive glazing demand follows closely, driven by the localization of assembly lines and the increasing penetration of electric vehicles. Laminated windshield volumes gain from mandatory safety standards, while tempered sidelites and sunroofs incorporate solar-control layers to mitigate cabin heat load. Other industrial uses—such as household appliances, electronics, and interior décor—remain comparatively steady but benefit from broader industrial diversification ambitions across the Gulf. As application portfolios skew toward higher value-added solar, automotive, and smart-building niches, producers can unlock margin headroom and offset pricing pressure in commodity façade glass.
Geography Analysis
Saudi Arabia Flat Glass Market
Saudi Arabia commanded 56.70% of the Middle East and Africa flat glass market in 2025 and is forecast to grow at a 4.55% CAGR through 2031, buoyed by Vision 2030 megaprojects and aggressive renewable-energy targets. Gulf Guard’s USD 215 million 750-TPD float line and the planned synthetic soda-ash complex underscore Riyadh’s intent to localize key inputs and shorten supply chains. Continuous demand from NEOM, Qiddiya, and Red Sea developments ensures furnace baseload and spurs investments in online coating units. The surge in electric-vehicle assembly plants further diversifies domestic offtake beyond the traditional construction channel.
MEA Flat Glass Market
The United Arab Emirates and Qatar together represent a robust secondary cluster. Dubai’s smart-city initiatives and Abu Dhabi’s commercial retrofit programs are expanding the adoption of electrochromic façades and BIPV curtain walls. Emirates Float Glass leverages its proximity to Jebel Ali Port for export shipments, although the impending Saudi capacity may reshape competitive dynamics. Qatar’s post-World-Cup urban regeneration keeps institutional projects in the pipeline, sustaining demand for safety and acoustic glazing. North African and sub-Saharan leaders—Egypt, Nigeria, and South Africa—add depth to the regional picture. China Glass Holdings’ USD 310 million investment positions Egypt as a hub supplying both float and PV glass into Mediterranean trade lanes, with 2024 exports totaling USD 92 million. Nigeria’s focus remains container glass, yet Beta Glass’s N15.3 billion capacity upgrades illustrate broader investor appetite for glass manufacturing. South Africa, home to PFG’s 260,000-tonne float line, confronts periodic anti-dumping reviews but continues to serve Southern African Customs Union partners with architectural sheet and mirror stock. Across all geographies, proximity to high-spec project sites and evolving trade policies will determine plant load factors and profit resilience.
Regulatory Landscape
Across the GCC, flat-glass market access increasingly depends on harmonized technical standards and building-performance compliance. The Gulf Standardization Organization (GSO) standards used in the region include GSO EN 12150-1:2021 for thermally toughened safety glass and GSO ASTM C1172:2021 for laminated glass, while Saudi Standards, Metrology and Quality Organization (SASO) technical regulations for building materials reference ISO/EN test and performance requirements for basic, coated, and safety glass used in façades and interiors.
In the UAE, municipal green-building frameworks such as Dubai's Al Safat and Ras Al Khaimah's Barjeel translate energy-efficiency policy into glazing specifications, supporting the uptake of low-E and solar-control configurations in permitted projects. In Southern Africa, regulatory and trade instruments also shape competitive dynamics. South Africa enforces safety glazing requirements through the NRCS under SANS 1263, and the International Trade Administration Commission (ITAC) has run anti-dumping actions and reviews affecting clear float glass import economics, influencing regional pricing and supplier selection across the Southern African Customs Union.
Value Chain Analysis
The value chain starts with silica sand, soda ash, limestone/dolomite, and cullet, supported by energy given the continuous furnace operation of float lines. Soda ash and fuel exposure is the most acute input-cost risk, which pushes producers toward supply-security measures (longer-term energy arrangements where available) and higher cullet utilization where collection and sorting infrastructure exists.
Primary manufacturing is concentrated in GCC and North Africa, where float producers supply domestic construction demand and export flows into adjacent MEA markets, supported by port-linked logistics corridors (for example, UAE industrial and logistics zones) that reduce lead times for regional projects. Downstream value accrues in processing (tempering, lamination, coating, insulating glass units, and digital printing) and project-channel distribution to façade contractors, OEM automotive supply chains, and solar module manufacturers. A visible structural shift in the chain is the pairing of regional float capacity with higher-value coating capability, such as AGC Obeikan Glass operating a coating facility in Yanbu through a technical partnership with AGC Interpane, alongside technology sourcing from suppliers such as Liaoning Zhongyuan for float-line build and upgrades.
Competitive Landscape
The Middle East and Africa flat glass market is moderately consolidated, anchored by global majors such as Saint-Gobain, Guardian Industries, and SCHOTT, complemented by agile regional champions like Obeikan Glass, Emirates Float Glass, and Sphinx Glass. Top companies combine economies of scale in commodity float with localized coating and lamination capabilities, tailoring products to stringent project specifications. Recent strategic actions include Gulf Capital’s profitable divestment of its Middle East Glass stake, following a threefold increase in revenues and a doubling of operating margins, which highlights private-equity interest in value creation through process optimization and product mix upgrades.
Middle-East And Africa Flat Glass Industry Leaders
-
Saint-Gobain
-
Obeikan Glass Company
-
Mediterranean Float Glass (MFG SPA)
-
Sahand Jam Tabriz Company
-
Kaveh Glass Industrial Group
- *Disclaimer: Major Players sorted in no particular order
Middle-East And Africa Flat Glass Market Companies Covered in this Report
- Ardakan Glass Corporation
- Emirates Float Glass LLC
- Guardian Industries
- Kaveh Glass Industrial Group
- Mediterranean Float Glass (MFG SPA)
- Obeikan Glass Company
- Sahand Jam Tabriz Company
- Saint-Gobain
- Sphinx Glass
- The National Company for Glass Industries (Zoujaj)
- United Float Glass
- Qazvin Glass Co.
- Azar Mina Jam Glass Industries
- SCHOTT AG
Read Analysis of Middle-East And Africa Flat Glass Companies
Market Opportunities and Future Outlook
A clear opportunity is the substitution of imported high-performance architectural glass with locally coated low-E and solar-control products that align with UAE municipal frameworks (Dubai Al Safat and Ras Al Khaimah Barjeel) and GCC-harmonized safety standards. This is supported by announced manufacturing and coating investments in major industrial zones: China Southern Glass (CSG) announced an AED 300 million intelligent energy-saving glass facility in KEZAD (UAE) in October 2025, and Guardian Glass has disclosed plans to roll out energy-saving coating technology in Egypt (2026). Together, these actions expand local access to coated SKUs used in energy-code-compliant envelopes and retrofit programs.
A second whitespace area is solar and automotive-grade flat glass, where investors are adding dedicated capacity and product breadth (ultra-clear substrates, tighter thickness tolerances, and functional coatings). In January 2026, Xinyi Glass signed a project agreement with MODON for a USD 386 million manufacturing base in Saudi Arabia to produce float, automotive, and high-performance low-E glass, aligning with localization and export corridors. Sub-Saharan supply diversification is also emerging, as Keda Industrial Group started work in February 2026 on a USD 250 million float glass facility in Shama, Ghana (phase-one 600 tonnes/day), creating a new West Africa production node and giving regional processors shorter sourcing routes versus cross-region imports.
Recent Industry Developments in Middle-East And Africa Flat Glass Market
- May 2026: South Africa's ITAC maintained anti-dumping duties of 10% to 45% on clear float glass from Saudi Arabia and the United Arab Emirates after a sunset review. The decision reshapes cross-border price dynamics into the Southern African Customs Union and could redirect trade flows toward alternative origins or higher value-added processed glass.
- October 2025: China Southern Glass announced an AED 300 million intelligent energy-saving glass facility in KEZAD (UAE). The project expands local access to coated SKUs used in energy-code compliant envelopes and retrofit programs, strengthening regional supply for energy-efficient glazing.
- March 2024: Saint-Gobain launched a flat glass factory in Sokhna, Egypt, strengthening local float and processing availability for construction and industrial customers. The added capacity supports shorter lead times for large projects and provides a regional platform for value-added upgrades such as coatings and laminated products.
Middle-East And Africa Flat Glass Market Report Scope and Research Methodology
Market Definition and Coverage
This market covers flat glass supplied and consumed across the Middle East and Africa for use in buildings, vehicles, and industrial uses, tracked as finished flat-glass output and downstream processing volumes where they are part of the flat-glass supply chain.
Scope exclusions: We exclude glass containers and fiberglass products, along with unrelated glazing accessories that do not represent flat-glass volume.
Segments Covered in This Report
- By Product Type
- Annealed Glass
- Coater Glass
- Processed Glass
- Mirror Glass
- Patterned Glass
- By Application
- Building and Construction
- Automotive
- Solar Glass
- Other End-user Industries
- By Geography
- Saudi Arabia
- Qatar
- United Arab Emirates
- Nigeria
- Egypt
- South Africa
- Rest of Middle East and Africa
Data Sources, Market Sizing, and Validation
Desk Research
Desk work started with public production and trade signals that can explain how flat-glass supply moves across the region. We reviewed materials such as national statistics offices and ministries of industry for manufacturing indicators, UN Comtrade for HS-level import and export direction, and customs authority releases where available.
To keep assumptions grounded, we also used sources such as the World Bank and IMF for macro and construction cycle context, along with building and construction permit trackers and transport infrastructure announcements published by governments. Company annual reports, investor decks, and plant press releases helped us map capacity changes and furnace restarts, and then a paid subscription for company financials and a shipment-level trade database was used selectively to cross-check the direction of volumes and price ranges. These sources are illustrative, and many additional public documents and datasets were also used to collect data, validate it, and clarify open questions.
Primary Interviews and Surveys
Primary work focused on interviews and structured surveys with manufacturers, processors, distributors, and large buying groups in construction and automotive value chains. Since we are dealing with a multi-country market, views were balanced across the Gulf, North Africa, and Sub-Saharan Africa, and then checked again when trade flows or project pipelines suggested a mismatch.
Distribution of primary research fieldwork respondents
| Company type | Respondent position |
|---|---|
| Top tier: 37% | CXOs: 14% |
| Mid tier: 44% | Functional/Unit leaders: 39% |
| Smaller Players: 19% | Managers: 47% |
Market-Sizing & Forecasting
Market size was built using a top-down method where production, capacity additions, and net trade are used to reconstruct the available flat-glass pool for Middle East and Africa, which is then aligned to end-use pull. Once the regional total was formed, selective bottom-up checks were run using sampled supplier volumes, channel checks by country, and typical ASP-by-product ranges to see if the volume picture still held.
Inputs that mattered most included furnace capacity and utilization direction, import dependence by country, construction starts and large project awards, vehicle production and assembly signals, and the mix shift toward coated and processed glass (which changes value per ton even when volume is stable). Forecasts were developed mainly using scenario analysis around construction pipeline timing, energy cost pressure, and planned capacity changes, and then adjusted using expert feedback so extreme swings were avoided. Where company or country data was thin, gaps were handled by using peer-country ratios and trade proxies, and then re-tested against interview feedback before finalizing the series.
Data Validation & Update Cycle
Outputs were checked against independent signals such as import trends, known capacity events, and country-level construction momentum, and then reviewed for variances that did not match what respondents described. If an anomaly appeared, the model was revisited and targeted re-contacts were done to confirm whether it was a one-off event or a real shift.
Before sign-off, the work goes through a multi-step review so assumptions, units, and conversions are consistent across countries and years. The report is refreshed annually, with interim updates when major events occur such as new float lines, furnace shutdowns, trade restrictions, or sharp currency moves. Right before delivery, we do a final pass to ensure the latest public releases and market signals are reflected.
Mordor Intelligence's Middle East and Africa Flat Glass Market Size Measured Against Other Published Estimates
Published market sizes for MEA flat glass can look far apart because firms use different units, time windows, and product coverage, and they also choose different pricing logic when reporting in USD. Some sources lean more on revenue proxies, while others anchor more tightly to production and trade volumes.
The main gap comes from unit choice and scope mixing, where Mordor Intelligence keeps the regional total in tons and avoids folding in downstream fabricated products as separate revenue layers when the same glass volume is already counted once.
Benchmark comparison
| Source | Market Size | Gaps in Research Methodology |
|---|---|---|
| Mordor Intelligence | USD 2.31 M (2025) | |
| Regional Consultancy A | USD 8.55 B (2022) | Reported in revenue terms and likely blends flat glass with value-added processing and coatings, which can double count value when mapped to the same underlying tonnage. |
| Industry Publisher B | USD 9.30 B (2024) | Uses a value framing with limited visibility on price build-up and currency timing, and the scope appears to include broader product types beyond primary flat-glass volume. |
The table shows that the spread is mostly explained by unit and scope differences rather than a single demand swing. When volume-led checks like capacity moves and net imports are kept consistent, and then pricing is applied only where needed, the final numbers stay traceable and easier to reproduce across countries and years.
Key Questions Answered in the Report
How large is the Middle East and Africa flat glass market in 2026?
The market totals 2.4 million tons in 2026 and is projected to reach 2.89 million tons by 2031.
What is the expected CAGR for flat-glass demand in the region?
Aggregate demand is forecast to increase at a 3.85% CAGR between 2026 and 2031.
Which country leads regional consumption?
Saudi Arabia commands 56.70% of demand and is also the fastest-growing geography through 2031.
Which application is expanding fastest?
Solar-dedicated low-iron glass is the quickest-growing application segment at a 6.41% CAGR.
Why are energy-efficient glazing products gaining traction?
GCC building codes mandate lower U-values, driving uptake of low-E, electrochromic, and BIPV glazing.