Refractories Market Size and Share
Market Overview
| Study Period | 2020 - 2031 |
|---|---|
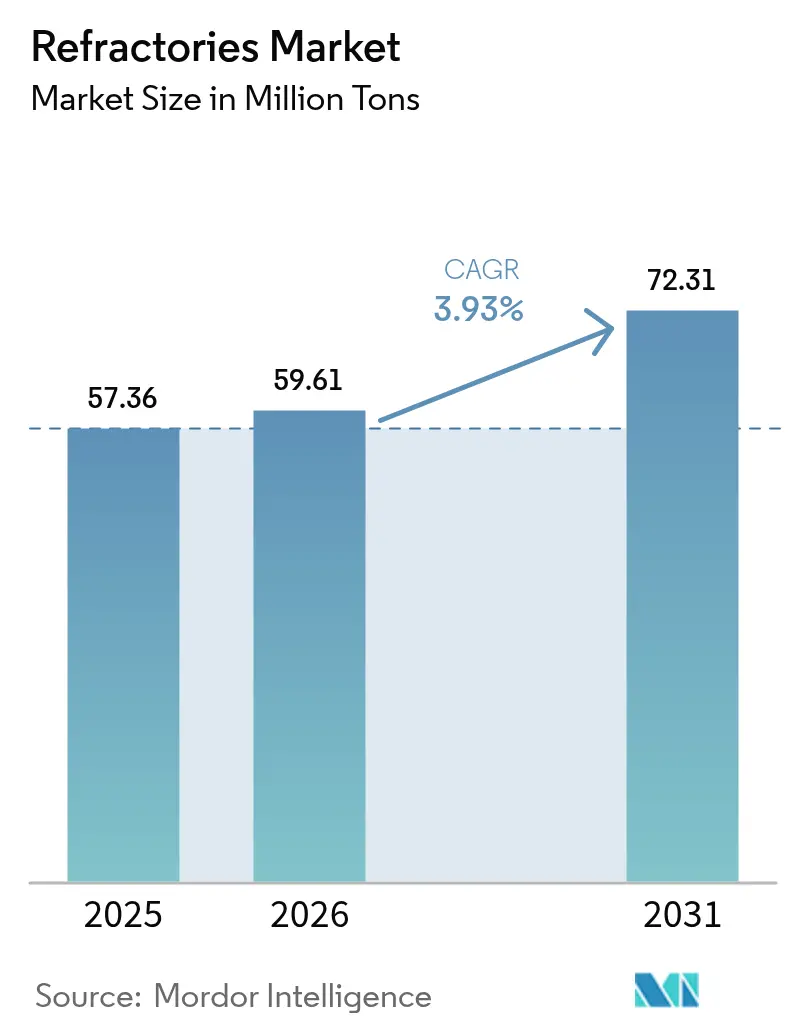
| Market Volume (2026) | 59.61 Million tons |
| Market Volume (2031) | 72.31 Million tons |
| Growth Rate (2026 - 2031) | 3.93% CAGR |
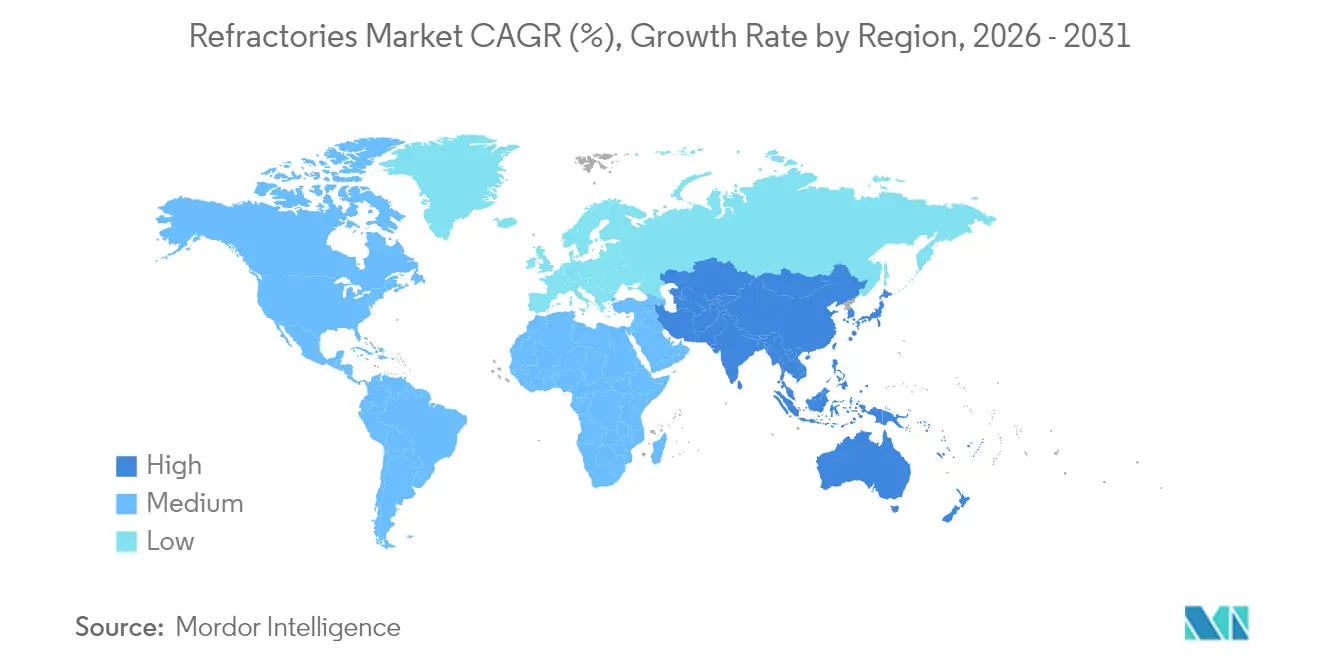
| Fastest Growing Market | Asia Pacific |
| Largest Market | Asia Pacific |
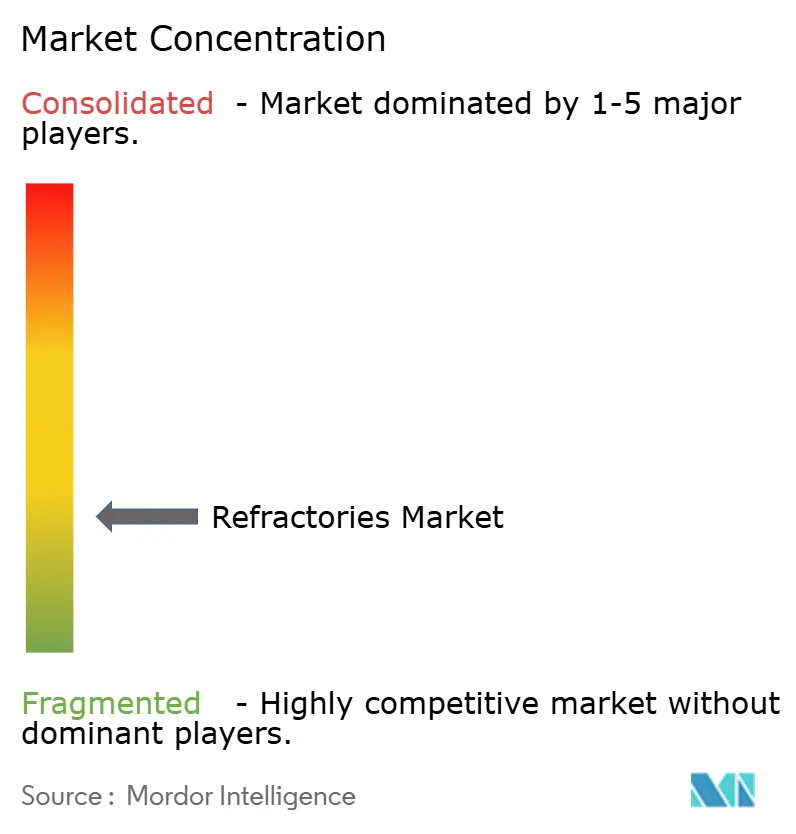
| Market Concentration | Low |
Major Players *Disclaimer: Major Players sorted in no particular order Image © Mordor Intelligence. Reuse requires attribution under CC BY 4.0. | |
Refractories Market Analysis by Mordor Intelligence
The Refractories Market size is expected to grow from 57.36 Million tons in 2025 to 59.61 Million tons in 2026 and is forecast to reach 72.31 Million tons by 2031 at 3.93% CAGR over 2026-2031. This forward momentum reflects the ability of the refractories market to adapt to shifting steelmaking technologies, expanding energy-intensive industries, and rising regulatory expectations. Capacity expansions across Asian steel plants, the pivot toward hydrogen-based direct-reduced-iron (DRI) furnaces, and the scale-up of next-generation battery, cement, and waste-to-energy facilities all reinforce near-term demand. At the same time, tighter silica-dust limits and carbon–border tariffs are accelerating materials innovation and spurring strategic consolidation among leading suppliers. RHI Magnesita, for example, delivered 7% growth in 2023 Adjusted EBITA to EUR 409 million despite softer volumes, underscoring how disciplined pricing and targeted acquisitions can buffer cyclical swings.
Key Report Takeaways
- By product type, clay refractories led with 54.88% of refractories market share in 2025; non-clay refractories are forecast to expand at a 4.57% CAGR through 2031.
- By end-user industry, iron and steel captured 62.95% share of the refractories market size in 2025 and is advancing at a 4.29% CAGR through 2031.
- By geography, Asia-Pacific commanded 73.20% of the refractories market share in 2025 while growing at a 4.12% CAGR to 2031.
Note: Market size and forecast figures in this report are generated using Mordor Intelligence’s proprietary estimation framework, updated with the latest available data and insights as of 2026.
Global Refractories Market Trends and Insights
Drivers Impact Analysis*
| Driver | (~) % Impact on CAGR Forecast | Geographic Relevance | Impact Timeline |
|---|---|---|---|
| Rapid Capacity Expansions in Asian Iron and Steel Plants | +1.2% | Asia-Pacific core, spill-over to MEA | Medium term (2-4 years) |
| Shift Toward Hydrogen-Based Direct-Reduced-Iron Furnaces | +0.8% | Global, with early adoption in EU and Japan | Long term (≥ 4 years) |
| Cement Kilns Switching to Alternative Fuels | +0.5% | Global, concentrated in North America and EU | Short term (≤ 2 years) |
| Growth of Large Utility-Scale Energy-Storage Batteries Using High-Temperature Ceramics | +0.3% | Global, led by China and North America | Medium term (2-4 years) |
| Novel Ultra-Low-Porosity Bricks for Waste-To-Energy Incinerators | +0.2% | EU and North America primarily | Long term (≥ 4 years) |
| Source: Mordor Intelligence | |||
Rapid Capacity Expansions in Asian Iron and Steel Plants
Steel capacity additions across Asia are driving unprecedented refractory demand, with China commissioning 12 new blast furnaces totaling 18.97 million tons in H1 2024[1]Shanghai Metal Market, “China Adds New Blast Furnaces in H1 2024,” metal.com. Replacing aging units with high-efficiency furnaces lengthens campaign life expectations and raises thermal loads, prompting the refractories market to innovate higher-grade magnesia-carbon and monolithic solutions. India’s surge is equally pivotal; RHI Magnesita India posted INR 3,781 crore (USD 453 million) FY 2023-24 revenue while serving more than 700 customers across nine sites, highlighting the depth of domestic pull. Regional concentration benefits local producers through shorter lead times yet challenges Western suppliers to sustain share. Meanwhile, Korean production fell 5.7% in 2024, underscoring uneven growth within the broader refractories market.
Shift Toward Hydrogen-Based Direct-Reduced-Iron Furnaces
Hydrogen-based DRI alters temperature profiles and atmospheres, demanding refractories with superior thermal-shock resistance and hydrogen embrittlement resilienceMagnesita research confirms that electric melting furnaces intended for “green steel” require novel refractory chemistries capable of withstanding hydrogen-rich gases. Although the process can slash steelmaking CO₂ emissions to 0.1 tons per ton of steel, capex and energy-price hurdles persist; ArcelorMittal’s 2025 withdrawal from a German project and return of EUR 1.3 billion in subsidies highlights the economic uncertainties. Nevertheless, the Institute for Energy Economics forecasts a ten-fold rise in DR-grade iron ore demand by 2050, signaling long-run opportunities for specialized DRI refractories,
Cement Kilns Switching to Alternative Fuels
Higher alkali, sulphate, and chloride contents in waste-derived fuels hasten refractory degradation inside cement kilns. HarbisonWalker International’s studies document intensified thermal shock, spalling, and chemical attack, pushing producers toward premium alumina-rich compositions and proactive lining audits. Stricter EU emissions directives accelerate this switch, compelling the refractories industry to supply longer-life linings even as volume growth stays muted. Installation practices are evolving, with frequent maintenance windows and hybrid lining designs countering alternative-fuel stresses. Refratechnik’s expanded Asian presence via the WCA mirrors the global nature of this demand shift.
Growth of Large Utility-Scale Energy-Storage Batteries Using High-Temperature Ceramics
Cathode-active-material firing for lithium-ion batteries is emerging as a sizeable niche within the refractories market. Saint-Gobain’s PowerCeram™ saggers lift CAM throughput by 10% and curb energy loss by 50%, underpinning cost advantages for gigafactories. Ni-rich chemistries heighten corrosive lithium exposure; research shows cordierite-mullite refractories react strongly with Li₂O, whereas SiC-based products form protective lithium-silicate layers. Similar purity, dimensional-stability, and contamination-control needs differentiate battery-sector refractories from traditional steel or cement linings, offering diversification for suppliers.
Restraints Impact Analysis*
| Restraint | (~) % Impact on CAGR Forecast | Geographic Relevance | Impact Timeline |
|---|---|---|---|
| Carbon-Emission Penalties on Mag-Carbon Bricks | -0.4% | EU and North America primarily | Medium term (2-4 years) |
| Volatility in Metallurgical-Grade Bauxite and Magnesite Supply | -0.3% | Global, acute in import-dependent regions | Short term (≤ 2 years) |
| Occupational Silica-Dust Regulations Tightening in OECD Nations | -0.2% | OECD countries | Long term (≥ 4 years) |
| Source: Mordor Intelligence | |||
Carbon-Emission Penalties on Mag-Carbon Bricks
EU carbon-border tariffs and North American decarbonization policies are curbing demand for traditional magnesia-carbon bricks. Life-cycle assessments show that carbonless magnesia alternatives deliver lower environmental impacts but still need broader industrial validation. US antidumping duties on certain Chinese and Mexican mag-carbon bricks—reaching 236% for some producers—add cost pressure and push the refractories market toward lower-carbon solutions. RHI Magnesita’s high-recycling mag-carbon series offers an interim path, yet long-term trajectories favor carbon-free bonds and ceramic-matrix composites.
Volatility in Metallurgical-Grade Bauxite and Magnesite Supply
Refractory-grade bauxite consumption in the United States fell 17% in 2023 to 1.8 million tons, with 78% channelled into alumina refining, exposing supply fragility. Australia’s omission of bauxite from its Critical Minerals List curtails investment incentives despite being a leading producer. Geopolitical tension, particularly around Chinese magnesite exports, intensifies sourcing risk. Firms with vertically integrated or multi-continent raw-material footprints are better sheltered from price spikes and shortages.
*Our forecasts treat driver/restraint impacts as directional, not additive. The impact forecasts reflect baseline growth, mix effects, and variable interactions.
Segment Analysis
By Product Type: Non-Clay Refractories Drive Innovation
Non-clay refractories grew at a 4.57% CAGR during the review period and continue to outpace clay grades through 2031. They thrive on superior corrosion and thermal-shock resistance critical in hydrogen-based steelmaking, advanced batteries, and waste-to-energy incinerators. Magnesite bricks dominate basic steelmaking for their resistance to slag chemistry, while zirconia bricks excel in severe cycling and extremely high temperature zones. Silica bricks remain indispensable for coke-oven checker walls, yet usage is moderated by rising crystalline-silica exposure rules capping dust at 50 µg/m³. Chromite bricks maintain a foothold in non-ferrous smelting thanks to strong metal-penetration resistance. Together, these non-clay categories underpin value growth even as clay refractories retain volume leadership.
Clay refractories, topped by high-alumina variants, captured 54.88% of refractories market share in 2025, reflecting their cost-effectiveness across multiple furnace linings. Fireclay bricks serve moderate-temperature ladles and boilers, while insulating refractories unlock energy savings across industries. Researchers have achieved 84 MPa compressive strength in fly-ash geopolymer bricks after 1,100 °C exposure, hinting at circular-economy pathways for clay refractories. Saint-Gobain’s ultra-high-temperature ceramics, particularly SiC and zirconia, stretch performance ceilings above 1,400 °C and illustrate how hybrid formulations blur the traditional clay/non-clay divide.


By End-User Industry: Steel Sector Dominance Intensifies
The iron and steel sector accounted for 62.95% of the refractories market size in 2025 and retains the highest 4.29% CAGR to 2031 as electric-arc-furnace (EAF) build-outs accelerate. Berry Metal’s recent EAF upgrades underscore rising demand for spout, slag-door, and delta roof refractories tuned to rapid-melting cycles. The cement industry ranks second by volume, fueled by global infrastructure programs and alternative-fuel adoption that shortens lining life, thereby lifting value. Energy and chemical complexes bolster demand through refinery turnarounds and petrochemical additions, especially in Asia-Pacific and the Middle East. Non-ferrous metallurgical hubs necessitate premium chromite-rich linings to resist metal infiltration. Glass manufacturing revolves around ultra-pure alumina-zirconia-silica linings, a niche but value-dense segment. Emerging waste-to-energy plants and battery cathode production diversify revenue streams, with Saint-Gobain’s T-Clip PRO having covered more than 16,000 m² of vertical boiler tubes in these plants. Persistent though declining demand from pulp and paper kilns in developing economies adds stability.

Geography Analysis
Asia-Pacific owned 73.20% of the refractories market in 2025 and is slated to grow at a 4.12% CAGR through 2031. China continues modernizing blast furnaces while shutting obsolete capacity, driving sustained uptake of higher-grade bricks and castables. India outpaces all peers; RHI Magnesita’s CEO forecasts 6–13% annual domestic refractory growth, reflecting large-scale steel and cement expansions. Japan’s shift toward EAF technology, supported by JFE Holdings’ USD 2.26 billion investment, redirects lining specifications toward EAF-optimized basic mixes. South Korea encountered a 5.7% production dip in 2024 but aims to pivot toward higher-value steel products that still require premium refractories. Accelerating lithium-ion battery gigafactory construction across China and Southeast Asia cements the region’s role as the growth nucleus of the refractories market.
North America remains a mature yet strategically vital arena. HarbisonWalker International’s USD 13.9 million expansion in Fulton, Missouri, will lift lightweight monolithic output by 60% and embodies the region’s commitment to high-value applications. Heightened OSHA silica-dust limits incentivize investment in sealed handling and low-dust materials, reshaping product portfolios. Canada eyes leadership in green-iron exports, which could stimulate specialized DRI refractory demand. Mexico’s competitiveness, however, is tempered by US antidumping duties that inflate costs for mag-carbon bricks.
Europe sets the pace on environmental policy. The EU Carbon Border Adjustment Mechanism raises the cost of high-carbon refractories, propelling adoption of carbon-free bonds and recycling solutions. ArcelorMittal’s decision to return EUR 1.3 billion in subsidies for a German hydrogen-steel project illustrates the economic strain in the green transition. Yet R&D pipelines stay robust; Saint-Gobain’s planned USD 40 million NorPro plant in Wheatfield, New York, although US-based, will serve European catalysts and emphasizes trans-Atlantic supply-chain integration. The Middle East and Africa offer emergent promise through Saudi industrial diversification and South African mining ventures, although political certainty and infrastructure gaps influence project pacing.

Regulatory Landscape
Refractory producers operate under tightening air-emissions and hazardous-substance regimes that affect plant design, product formulations, and cross-border shipments. In the United States, the EPA National Emission Standards for Hazardous Air Pollutants for Refractory Products Manufacturing (40 CFR Part 63, Subpart SSSSS) anchors compliance for hazardous air pollutants, while facilities above the reporting threshold also come under greenhouse gas reporting rules for ceramics manufacturing (40 CFR Part 98, Subpart ZZ). In China, provincial requirements are becoming more explicit for this industry, including Hebei Province standard DB13/6186-2025 for air pollutant emission limits, reinforcing the need for monitoring and control equipment upgrades at refractory-material plants.
In Europe, chemicals compliance and carbon-accounting are increasingly linked to market access. Under the EU REACH framework, the Commission advanced work on restrictions in 2026 and updated Annex XVII through Regulation (EU) 2026/1168, increasing the burden on suppliers to validate substance composition and documentation for exports into the EU. In parallel, the EU Carbon Border Adjustment Mechanism is raising carbon-footprint reporting expectations for energy-intensive supply chains, which is pushing refractory manufacturers to improve traceability for raw materials and production emissions to support customer and customs reporting requirements.
Value Chain Analysis
The refractories value chain starts with mining and processing key minerals (magnesite, bauxite/alumina, zircon, chromite, silica, and carbon sources), followed by high-temperature conversion into dead-burned/fused intermediates, shaping or monolithic preparation, firing/curing, and distribution to steel, cement, non-ferrous, glass, and energy and chemicals customers. Raw-material concentration remains a structural feature, with China accounting for almost 60% of global magnesite production in 2024, which increases exposure to logistics and export frictions. On the alumina side, government data indicate US alumina production fell 5% in 2024 versus 2023, highlighting vulnerability where local availability is limited and imports or longer supply chains become necessary.
Midstream manufacturing is energy intensive and sensitive to electricity and fuel costs, while downstream delivery is constrained by bulky freight, site-specific installation requirements, and shutdown-driven buying cycles. Consolidation and vertical integration continue to reshape the chain, exemplified by RHI Magnesita's USD 430 million acquisition of Resco in 2024, which expanded its production footprint in the United States and Canada and strengthened service coverage near major steel and industrial clusters. Recycling and secondary raw materials are increasingly integrated into procurement and processing to manage raw-material volatility and landfill costs, with larger suppliers scaling closed-loop collection, sorting, and grog processing alongside digital monitoring and lining-management services to deepen customer lock-in.
Competitive Landscape
Innovation and Integration Drive Future Success
The refractories market is highly fragmented with active horizontal and vertical integration. RHI Magnesita executed six acquisitions in 2023 and a further USD 430 million purchase of alumina producer Resco in 2024, fortifying its North American footprint. Vesuvius, investing £37.4 million in 2023 R&D and launching 21 new products, leverages its 1,570-strong patent portfolio to sustain technological differentiation[2]Vesuvius, “2024 Annual Report & Accounts,” vesuvius.com. Such moves tighten barriers to entry, especially in high-specification niches like hydrogen-steel refractories and battery ceramics.
Technology investment is pivotal. Vesuvius’s XMAT sensor suite enables real-time molten-steel flow monitoring, while its VISO™ isostatic pressing delivers near-net-shape slag-runner inserts, shortening installation downtime. RHI Magnesita’s Digital Furnace Monitoring platform applies AI to predict lining wear and optimize maintenance windows, further elevating switching costs for customers. The refractories market therefore rewards firms that pair materials science with digital services.
Niche specialists still carve space. Companies focused on SiC-based ultra-high-temperature ceramics, or those offering turnkey waste-to-energy linings, exploit white-space gaps less attractive to multinationals that prioritize scale. Local producers in India and Vietnam benefit from proximity, agile logistics, and cost structures that larger incumbents cannot easily replicate. However, ongoing consolidation pressures indicate that many smaller entities may eventually align with global groups or form regional alliances to keep pace.
Refractories Industry Leaders
Krosaki Harima Corporation
RHI Magnesita
Vesuvius
Saint-Gobain
HarbisonWalker International
- *Disclaimer: Major Players sorted in no particular order

Market Opportunities and Future Outlook
Decarbonization and compliance reporting are creating whitespace for refractory suppliers that can document and reduce cradle-to-gate emissions while maintaining performance in aggressive operating environments. Industry-wide standardization efforts support this shift, including the World Refractories Association framework for Product Carbon Footprint calculations aligned to ISO 14067, which helps suppliers and end users align specifications, bids, and procurement requirements around comparable carbon metrics. On the manufacturing side, efficiency investments are moving from pilots to practical reference cases, such as IFB Refractories deploying kiln heat-recovery systems that reduced gas consumption by 60% and cut CO2 emissions per ton of bricks by more than 50%, offering a replicable pathway for producers facing rising energy costs and carbon scrutiny.
Capacity and localization programs in major consuming regions open additional opportunities for suppliers of unshaped products, lightweight monolithics, and value-added installation and maintenance services. In 2026, multiple expansions signaled this shift toward proximity to steel and industrial hubs, including Monolithisch India commencing commercial operations for expanded capacity at its Purulia facility (250,000 tonnes per annum), Calderys inaugurating its CAPES plant in Khurda, Odisha for domestic supply and Asia-Pacific exports, and HarbisonWalker International opening a new lightweight monolithics facility in Fulton, Missouri with automated packaging and dedicated GREENLITE aggregate capability. These moves point to demand for faster-turnaround refractory supply, qualified local technical service, and product portfolios optimized for EAF-intensive steelmaking, alternative-fuel cement kilns, and adjacent high-temperature industrial applications.
Recent Industry Developments
- May 2026: Vesuvius issued a trading statement confirming its full-year 2026 guidance and reported trading profit over the first four months of 2026 slightly ahead of the same period in 2025 on a constant-currency basis. The update highlighted the impact of cost savings and pricing discipline, supporting investment continuity in refractory and molten metal flow solutions amid uneven steel volumes.
- October 2025: Saint-Gobain Ceramics and Eurodia Industrie announced a strategic partnership to deliver integrated material and process solutions for direct lithium extraction (DLE). The collaboration combines lithium-selective adsorbents with process engineering, expanding addressable demand for high-performance ceramics that sit adjacent to refractory-grade high-temperature materials and supply chains.
- February 2025: Saint-Gobain Ceramics announced plans to build a new NorPro manufacturing facility in Wheatfield, New York, with an investment exceeding USD 40 million to expand catalyst carrier production for energy, biofuel, and chemical industries. The project strengthens North American capacity in advanced ceramic materials that share production know-how and customer overlap with refractories in energy and chemical processing environments.


Research Methodology Framework and Report Scope
Market Definition and Coverage
For this study, the refractories market covers shaped and unshaped heat-resistant materials that are installed inside high-temperature equipment to protect it from heat, wear, and chemical attack. The market is sized in terms of volume consumed (tons).
Scope exclusions: We exclude insulation-only materials that do not function as working linings, and we do not count downstream services such as installation labor and maintenance contracts.
Segmentation Overview
- By Product Type
- Non-clay Refractories
- Magnesite Brick
- Zirconia Brick
- Silica Brick
- Chromite Brick
- Other (Carbides, Silicates)
- Clay Refractories
- High-Alumina
- Fireclay
- Insulating
- Non-clay Refractories
- By End-User Industry
- Iron and Steel
- Cement
- Energy and Chemicals
- Non-Ferrous Metals
- Glass
- Ceramic
- Other End-user Industries (Pulp and Paper, Waste-to-Energy)
- By Geography
- Asia-Pacific
- China
- India
- Japan
- South Korea
- Rest of Asia-Pacific
- North America
- United States
- Canada
- Mexico
- Europe
- Germany
- United Kingdom
- France
- Italy
- Russia
- Rest of Europe
- South America
- Brazil
- Argentina
- Rest of South America
- Middle East and Africa
- Saudi Arabia
- South Africa
- Rest of Middle East and Africa
- Asia-Pacific
Data Sources, Market Sizing, and Validation
Desk Research
Desk research sets the industrial context and helps anchor the demand pools that typically draw refractory volumes. We review public production and capacity indicators from sources such as the World Steel Association, USGS, the International Energy Agency, the US Energy Information Administration, and national statistics offices, since these series help explain furnace activity and rebuild cycles.
To keep assumptions realistic, we also use company filings and investor presentations, industry association websites, customs releases where available, and reputed press coverage to track plant additions, shutdowns, and regulatory moves that can change refractory intensity. Where needed, we selectively use paid subscriptions focused on company financials and intelligence, patent databases, and shipment-level import and export records to cross-check product mix and trade flows. The desk sources listed here are illustrative only, and additional public and subscription sources were also reviewed for data collection, validation, and clarification.
Primary Interviews and Surveys
Primary work is used to pressure-test the model inputs that are hard to read from public data, especially consumption intensity, relining frequency, and how volumes shift between bricks and monolithics by end use. We speak with manufacturers, distributors, procurement teams at major end-use plants, and independent technical experts across APAC, EMEA, and the Americas. The respondent input helps close gaps from desk research and supports triangulation of assumptions.
Distribution of primary research fieldwork respondents
| Company type | Respondent position | Region |
|---|---|---|
| Top tier: 32% | CXOs: 20% | APAC: 45% |
| Mid tier: 46% | Functional/Unit leaders: 23% | EMEA: 34% |
| Smaller Players: 22% | Managers: 57% | Americas: 21% |
Market-Sizing & Forecasting
The core sizing logic follows a top-down build that reconstructs refractory demand from end-use activity, then converts that activity into tons consumed using intensity and replacement patterns. For example, crude steel output by route (such as BOF versus EAF), cement clinker output, non-ferrous smelting volumes, and glass melt capacity are mapped to typical refractory consumption per unit of output, then adjusted for relining intervals and operating rates.
Selective bottom-up approximations are used to check the totals before finalizing the market. These checks include supplier roll-ups from sampled public disclosures, channel feedback on shipment direction, and sanity tests based on typical average selling price ranges paired with estimated tonnage. This helps flag cases where product mix assumptions drift.
When a country or end-use data gap is present, we fill it using proxy indicators such as capacity utilization, import dependence, or production share splits confirmed in interviews. We keep those assumptions visible so they can be revisited.
For forecasting, scenario analysis is applied around the key drivers that most often move refractory volumes, including steel and cement output trends, kiln and furnace capacity additions, refractory life improvements, shifts from shaped to monolithics, and energy-cost driven operating rates. The forward view is aligned to expert expectations gathered in interviews, particularly on rebuild timing and technology adoption that can change consumption intensity.
Data Validation & Update Cycle
Validation is done in layers so major errors are caught early and smaller inconsistencies do not pass through to the final numbers. Model outputs are compared against independent signals such as steel and cement production, trade movement for refractory products, and publicly discussed plant operating rates, followed by variance checks at region and end-use levels.
Before sign-off, anomalies are reviewed by another analyst. Any large swings trigger re-checks of the input series, and when needed, a quick re-contact with industry participants to confirm whether the change is real or driven by an assumption. Reports are refreshed annually, and interim updates are made when material events occur, such as major capacity closures, new furnace builds, or sudden regulatory changes. Right before delivery, a final review pass is completed so the released view reflects the latest available information.
Mordor Intelligence's Refractories Market Size Measured Against Other Published Estimates
It is normal to see different market sizes for refractories because the boundary can shift between volume versus value, shipped versus consumed material, and whether adjacent thermal materials or services are counted. Timing differences also matter, since some estimates lock assumptions earlier while others adjust for recent production cycles.
By tracking end-use output indicators and refreshing relining and intensity assumptions through primary checks, Mordor Intelligence keeps the refractories estimate tied to tons consumed in operating plants. This reduces mixing of price-driven inflation with true volume change.
Benchmark comparison
| Source | Market Size | Gaps in Research Methodology |
|---|---|---|
| Mordor Intelligence | USD 59.61 M (2026) | |
| Global Consultancy A | USD 33.82 B (2024) | This estimate is value-based, so price levels, currency timing, and product mix shifts can move the total even when underlying tonnage is stable, and it may include a broader set of refractory-related categories. |
| Industry Publisher B | USD 28.00 B (2024) | The scope appears value-led with a longer horizon, and differences often come from how bricks versus monolithics are priced, how regional average prices are converted to USD, and whether consumption is inferred from production or from sales. |
The comparison mainly reflects a unit mismatch plus scope and pricing choices, so a volume-based number for a later year will not line up with USD value totals for 2024. When the model is anchored to clear end-use activity and checked with practical channel and expert inputs, the steps stay repeatable, and the market view remains easier to interpret year to year.


Key Questions Answered in the Report
What is the current size of the refractories market?
The refractories market size reached 59.61 million tons in 2026 and is forecast to hit 72.31 million tons by 2031.
Which end-user industry consumes the most refractories?
Iron and steel account for 62.95% of demand and are also the fastest-growing segment with a 4.29% CAGR through 2031.
Why is Asia-Pacific so dominant in the refractories market?
The region holds 73.20% market share thanks to continuous steel capacity additions, rapid infrastructure build-out, and large-scale battery and cement projects.
How are environmental regulations affecting refractory materials?
Carbon-border tariffs and tighter silica-dust limits are steering producers toward carbon-free bonds, recycled mag-carbon bricks, and low-dust installation practices.
What role do non-clay refractories play in new technologies?
Non-clay grades such as magnesia, zirconia, and SiC are critical for hydrogen-steel, energy-storage batteries, and waste-to-energy lines because they tolerate aggressive chemistries and extreme temperatures.
Page last updated on:


