Label-Free Detection (LFD) Market Size and Share
Market Overview
| Study Period | 2020 - 2031 |
|---|---|
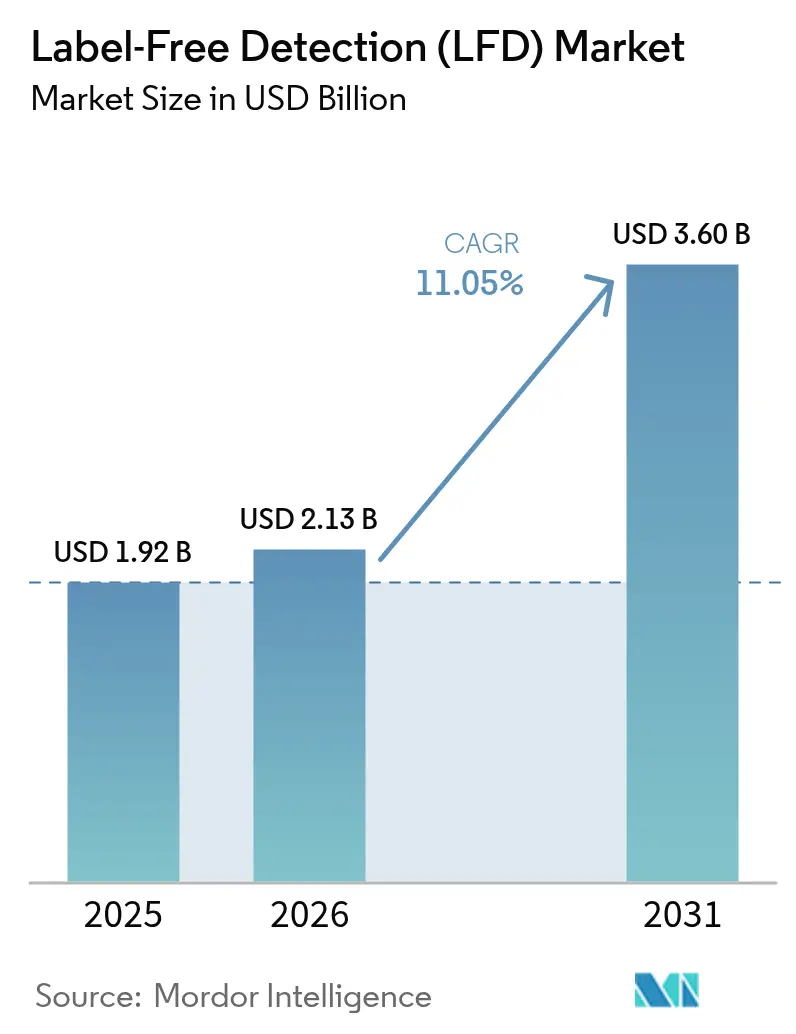
| Market Size (2026) | USD 2.13 Billion |
| Market Size (2031) | USD 3.60 Billion |
| Growth Rate (2026 - 2031) | 11.05% CAGR |
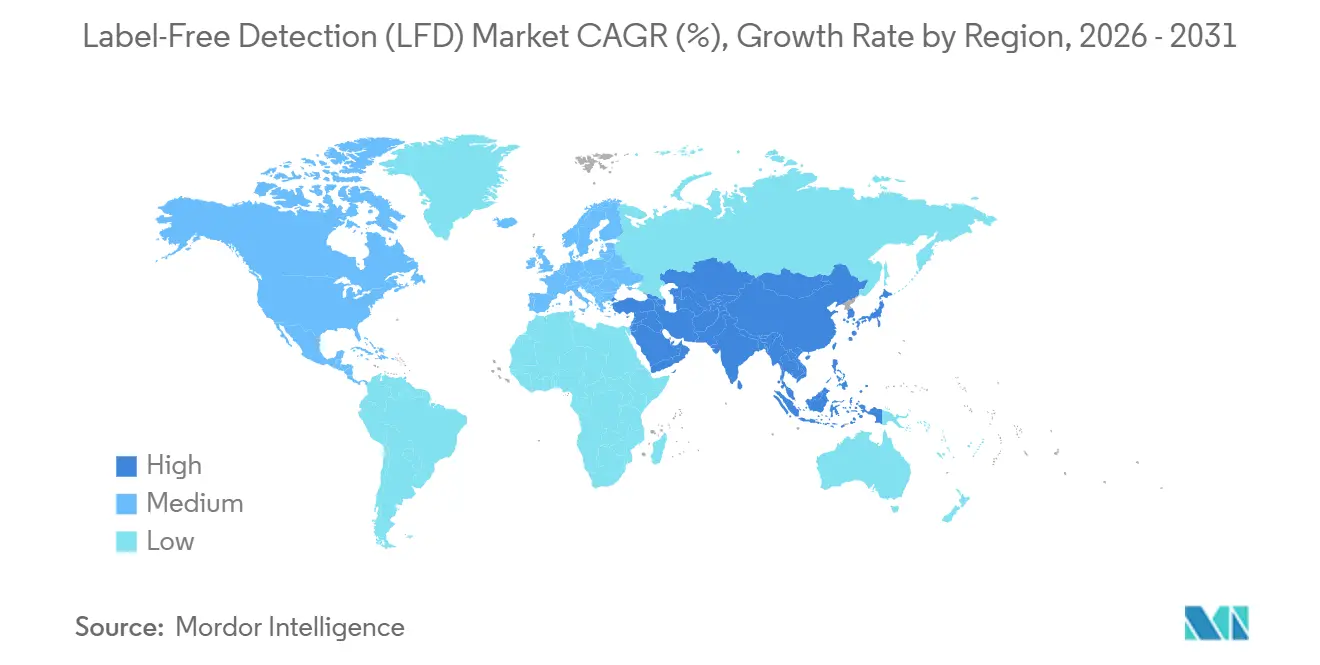
| Fastest Growing Market | Asia Pacific |
| Largest Market | North America |
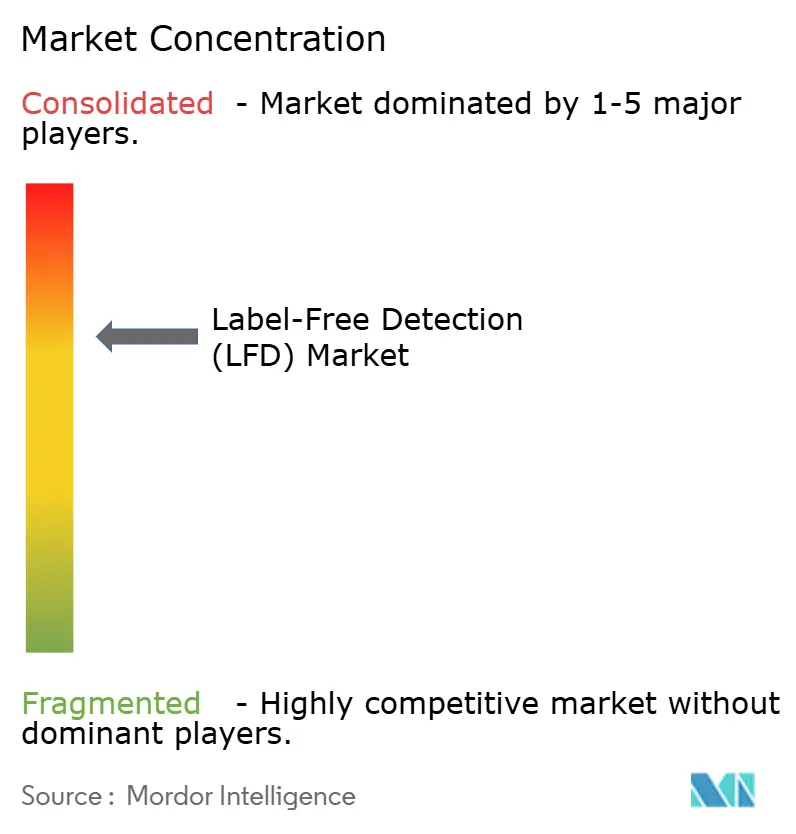
| Market Concentration | Medium |
Major Players *Disclaimer: Major Players sorted in no particular order Image © Mordor Intelligence. Reuse requires attribution under CC BY 4.0. | |
Label-Free Detection (LFD) Market Analysis by Mordor Intelligence
The Label-Free Detection Market size is expected to grow from USD 1.92 billion in 2025 to USD 2.13 billion in 2026 and is forecast to reach USD 3.60 billion by 2031 at 11.05% CAGR over 2026-2031.
Pharmaceutical sponsors are increasingly standardizing surface plasmon resonance (SPR) and bio-layer interferometry to obtain real-time kinetic and affinity data, which are critical for advancing hit-to-lead processes. This approach ensures the label-free detection market remains aligned with accelerated timelines in discovery and comparability studies. Regulatory focus is driving the adoption of these methods. Additionally, the label-free detection market is gaining momentum through chip and probe subscription models, which lower upfront costs and expand accessibility for mid-sized contract research organizations offering biophysics services. Regional growth trends remain varied, with North America maintaining a significant installed base, while the Asia-Pacific region is experiencing faster growth. This expansion is supported by policies in China and India that prioritize label-free analytical characterization in protein interaction research and biosimilar development.
Key Report Takeaways
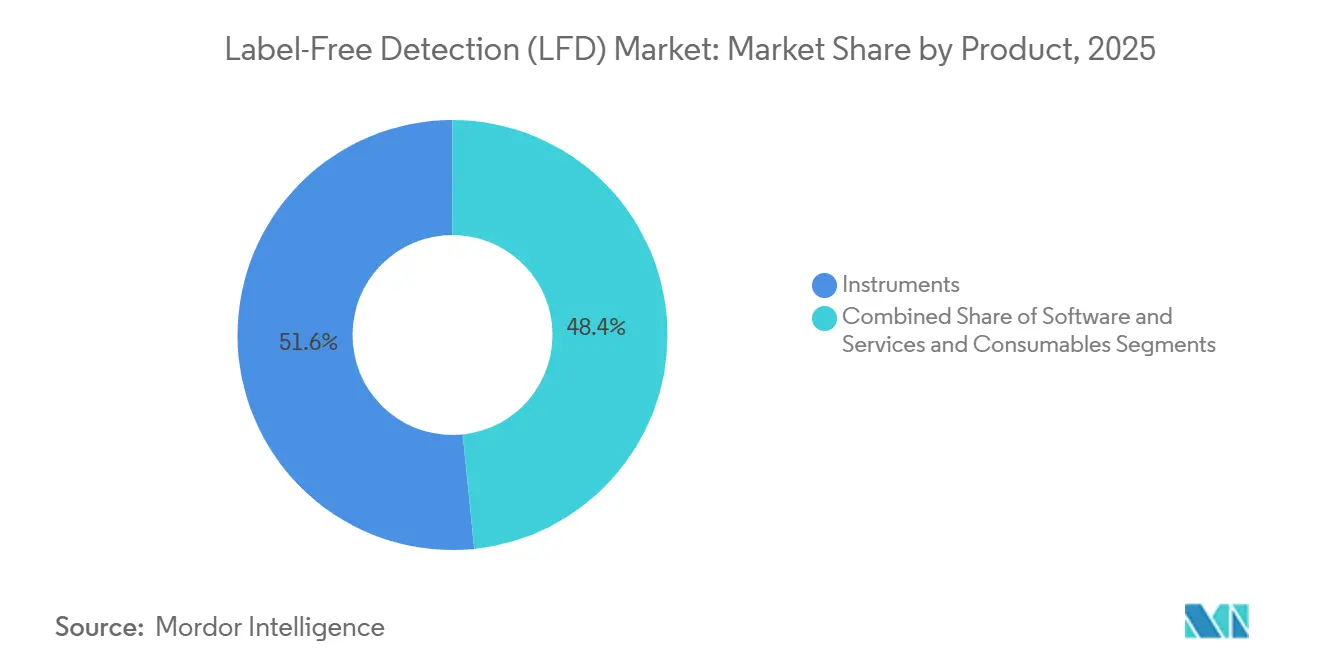
- By product, instruments led with 51.62% revenue share in 2025, while services are projected to expand at an 11.55% CAGR through 2031.
- By technology, surface plasmon resonance accounted for 46.10% of the revenue share in 2025, and bio-layer interferometry is forecast to grow at a 11.72% CAGR through 2031.
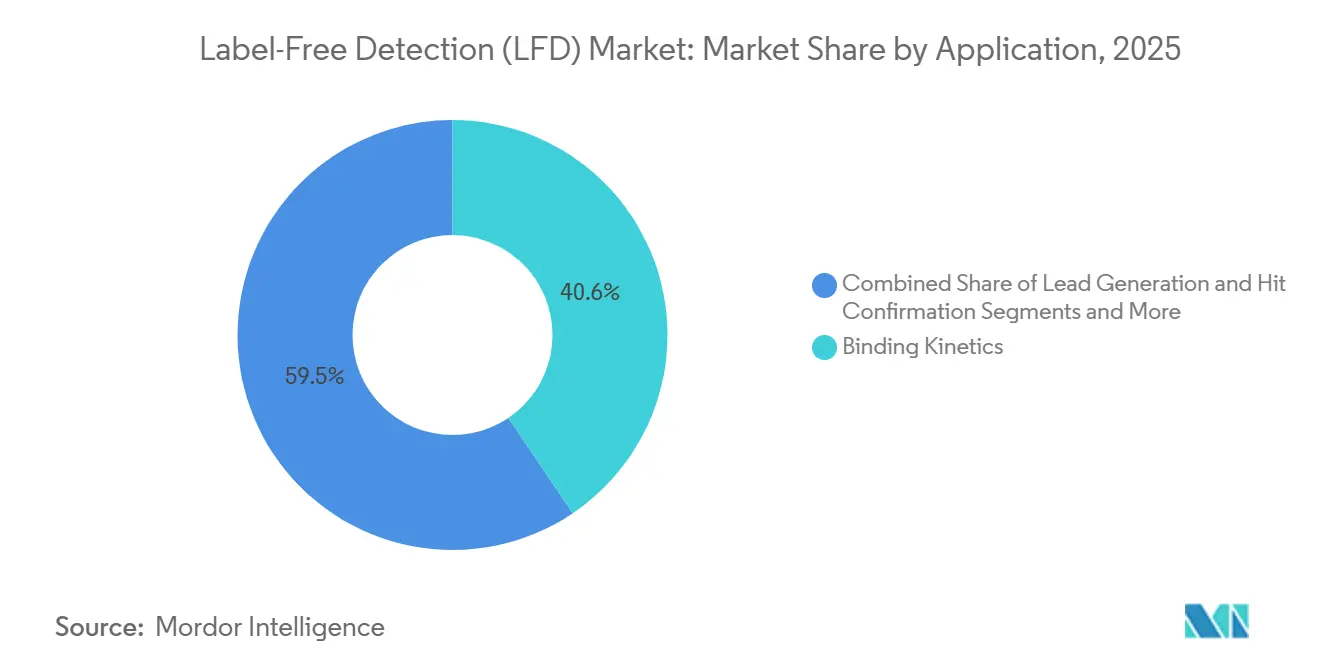
- By application, binding kinetics captured a 40.55% share in 2025, and binding thermodynamics is expected to advance at a 12.25% CAGR through 2031.
- By end user, pharmaceutical and biotechnology companies accounted for 53.10% of revenue in 2025, while contract research organizations are projected to record an 11.48% CAGR through 2031.
- By geography, North America held 38.75% revenue share in 2025, and Asia-Pacific is expected to register a 12.08% CAGR through 2031.
Note: Market size and forecast figures in this report are generated using Mordor Intelligence’s proprietary estimation framework, updated with the latest available data and insights as of 2026.
Global Label-Free Detection (LFD) Market Trends and Insights
Drivers Impact Analysis*
| DRIVER | (~) % IMPACT ON CAGR FORECAST | GEOGRAPHIC RELEVANCE | IMPACT TIMELINE |
|---|---|---|---|
| R&D partnerships between pharma and academia | +0.8% | Global, concentrated in North America and Europe | Medium term (2-4 years) |
| Innovations in label-free detection technologies | +1.2% | Global, early gains in North America, APAC adoption accelerating | Short term (≤ 2 years) |
| High-throughput SPR/BLI for fragment-based discovery | +1.5% | North America and Europe, spillover to APAC core | Medium term (2-4 years) |
| Ai-enhanced kinetic profiling at single-cell resolution | +1.8% | North America, selective adoption in Europe and China | Long term (≥ 4 years) |
| Adoption in cell-therapy manufacturing QC | +1.3% | North America and Europe, emerging in China and India | Medium term (2-4 years) |
| Biosensor-chip subscription models lowering capex | +0.9% | Global, strongest uptake in North America and APAC CROs | Short term (≤ 2 years) |
| Source: Mordor Intelligence | |||
Increasing R&D Partnerships Between Pharma & Academia
Pharmaceutical companies and universities are increasingly co-locating Surface Plasmon Resonance (SPR) and Bio-Layer Interferometry (BLI) platforms in shared facilities. This collaboration reduces capital costs, accelerates target validation, and ensures control over proprietary kinetic datasets for future decisions. Academic groups generate preliminary kinetics, which sponsors refine, streamlining the development of Investigational New Drug (IND)-enabling packages and minimizing the need for redevelopment. Major pharmaceutical sponsors are adopting this model, with Novartis reporting that a significant portion of its early-stage pipeline originated from academic screens under agreements preserving downstream rights. This collaboration trend strengthens the link between the label-free detection market, translational research milestones, and shared infrastructure planning.
Innovations in Label-Free Detection Technologies
Vendors are innovating with microfluidic cartridges and pre-configured consumables, reducing sample volumes and setup times. These advancements enable kinetic profiling of limited biologics, such as patient-derived organoid lysates, without requiring specialized coupling steps. Cytiva’s Biacore Insight, launched features disposable sensor chips with pre-immobilized capture antibodies, cutting assay setup time from hours to minutes and simplifying method transfer. Sartorius’s Octet HTX supports high-throughput environments by processing 384 samples simultaneously while meeting regulated lab standards.[1]Sartorius AG, “Octet HTX High-Throughput BLI System,” Sartorius, sartorius.com Bruker’s integration of native mass spectrometry with label-free detection allows single-injection evaluations of stoichiometry and post-translational modifications, aiding bispecific antibody characterization.
Shift Toward High-Throughput SPR/BLI for Fragment-Based Discovery
Fragment-based discovery, which screens large libraries of low-molecular-weight compounds with weak affinities, increasingly relies on automated SPR and BLI platforms to reliably measure association and dissociation rates at scale. Genentech reported that a significant portion of its clinical-stage small molecules originated from SPR-guided fragment hits, which outperformed traditional high-throughput screening by revealing binding mechanisms missed by static endpoints.[2]Cytiva, “Instrument Platforms, Service Programs, and Consumables,” Cytiva, cytiva.com Contract research organizations are expanding capacity to support sponsors' outsourcing campaigns.
AI-Enhanced Kinetic Profiling at Single-Cell Resolution
Machine learning is transforming sensorgram data analysis by improving predictions of binding affinity and on-off rates, enabling better candidate ranking and reducing false positives during the fragment stage. Agilent’s xCELLigence advances single-cell label-free analysis by quantifying receptor occupancy on individual T cells through impedance readouts, aiding dose regimen optimization in oncology. Gator Bio’s BLI systems incorporate adaptive control during injections, adjusting flow rates based on neural-network predictions to improve kinetic quality for weak binders.
Restraints Impact Analysis*
| RESTRAINT | (~) % IMPACT ON CAGR FORECAST | GEOGRAPHIC RELEVANCE | IMPACT TIMELINE |
|---|---|---|---|
| High capital and maintenance costs of instruments | -1.2% | Global, acute in emerging markets and smaller biotechs | Medium term (2-4 years) |
| Shortage of skilled kinetic-data analysts | -0.7% | North America and Europe, moderate impact in APAC | Long term (≥ 4 years) |
| Improved fluorescent-label alternatives | -0.9% | Global, concentrated in high-throughput screening environments | Short term (≤ 2 years) |
| Data-integrity concerns in cloud LFD platforms | -0.6% | North America and Europe, regulatory scrutiny highest | Medium term (2-4 years) |
| Source: Mordor Intelligence | |||
High Capital Cost of SPR/BLI Instruments
Advanced multi-channel SPR systems sell for USD 300,000–800,000 and require annual service contracts equal to 15–20% of the purchase price. Smaller biotechs, therefore, share instrumentation or outsource to CROs, slowing the build-out of in-house capabilities. Leasing schemes reduce initial cash outlay but often cap annual sample volumes, limiting flexibility. High fixed costs remain the primary hurdle to wider diffusion of label-free technology, keeping the purchasing cycle concentrated among top-tier pharmaceutical firms and well-funded research labs.
Shortage of Skilled Kinetic-Data Analysts
Biosensor workflows demand proficiency in surface chemistry, mass-transport theory, and kinetic modelling. Training newcomers takes 3–6 months, and advanced assay design can require years of experience. Emerging markets face acute shortages because university curricula seldom cover label-free techniques. Personnel scarcity inflates project timelines and labor costs, particularly in Asia-Pacific CROs racing to meet rising demand from multinational sponsors.
*Our forecasts treat driver/restraint impacts as directional, not additive. The impact forecasts reflect baseline growth, mix effects, and variable interactions.
Segment Analysis
By Product: Instruments Anchor Capacity, Services Capture Outsourcing Surge
The instrument class accounted for 51.62% of revenue share in 2025, underpinning core assay capacity across pharmaceutical R&D pipelines. Software and services, however, are advancing at an 11.55% CAGR because cloud-native analytics convert raw sensor data into actionable SAR insights. Spending on subscription licences and managed-analysis services helps laboratories sidestep internal skill shortages. Consumables remain a moderate growth contributor as novel chemistries extend sensor life and broaden detectable analyte classes.
AI-augmented workflows embed algorithms that suggest regeneration protocols, flag mass-transport artifacts, and recommend follow-up titrations. Cloud repositories enable multi-site teams to view curves in real time, ensuring consistent decision gates. Instrument-as-a-service bundles further align operating expenses with project milestones, drawing startups into the label-free detection market while tempering capital-expenditure barriers.


By Technology: SPR Leads, BLI Gains on Throughput Advantages
SPR accounted for 46.10% of 2025 revenues, retaining leadership based on sensitivity and regulatory familiarity. BLI, though, is projected to expand at an 11.72% CAGR as disposable probe designs tolerate crude samples and shorten cleaning cycles. Differential scanning calorimetry and isothermal titration calorimetry continue to supply niche thermodynamic insights, especially for viral protease inhibitor programs.
Competition between SPR and BLI centers on throughput versus sensitivity. Vendors enhance SPR with higher refractive-index stability and introduce BLI systems featuring automated microplate handlers. Emerging electrochemical and impedance methods target point-of-care formats, widening technology options for environmental labs that historically lacked capital for optical platforms. These alternatives create incremental opportunities without displacing core SPR/BLI spend.
By Application: Binding Kinetics Dominates, Thermodynamics Accelerates
Binding-kinetics assays remained the primary revenue driver at 40.55% share in 2025. Diagnostics and quality-control uses, however, are climbing at a 12.25% CAGR, fueled by global food-safety directives and pandemic surveillance mandates. Thermodynamic and stoichiometry analyses grow steadily as research groups probe multivalent antibody interactions and cooperative binding phenomena.
The diagnostics upswing propels vendors to deliver ruggedized systems calibrated for regulatory compliance in pathogen detection. Biosensors now detect E. coli at 5 cells mL⁻¹ within five minutes. Automated data-signature matching aids rapid positive-release decisions in meat-packing plants. Cloud dashboards compile site-level assay performance metrics, enabling centralized oversight across multinational food producers and positioning diagnostics as a resilient revenue pillar within the label-free detection market.
By End-User: Pharma Leads, CROs Surge on Outsourcing Wave
Pharma and biotech companies commanded 53.10% of 2025 demand, yet contract research organizations posted the fastest growth at a 11.48% CAGR as governments tighten approval requirements. CROs expand fee-for-service menus to include kinetic profiling packages, while academic institutes leverage shared-instrument grants to train students in label-free techniques.
Environmental regulators promote the deployment of biosensors for river water monitoring to comply with mercury caps. This policy pressure accelerates purchases of portable BLI units optimized for in-field sampling. Pharma’s enduring dominance assures baseline revenue, but diversification into food safety and environmental testing cushions suppliers against cyclical R&D budgets and extends the relevance of the label-free detection industry across new verticals.
Geography Analysis
North America contributed 38.75% of 2025 revenue, underpinned by robust NIH and BARDA grants that favor biosensor-based biodefense projects. Capital budgets at major U.S. pharmaceutical firms funded fleet upgrades from single-channel SPR instruments to 16-channel platforms capable of 10,000 interactions per day. Government fast-track review pathways recognize label-free kinetics in biologics filings, shortening time-to-approval and reinforcing regional leadership.
Asia-Pacific is projected to log a 12.08% CAGR through 2031, the fastest worldwide. China’s five-year biotech plan subsidizes domestic SPR chip production, lowering consumable costs, while India’s contract-development organizations add label-free suites to capture biologics outsourcing contracts. Japan deepens its installed base for biosimilar comparability studies, and South Korea channels venture capital into AI analytics startups focused on kinetic data. Cross-border joint ventures between Western instrument makers and regional manufacturers target mid-tier pricing to broaden the installed base across local pharma clusters.
Europe retains its status as a steady-growth region, driven by Horizon Europe grants and a maturing biosimilar market that demands rigorous kinetic comparability. Germany and the United Kingdom maintain a dense footprint of CROs offering full-spectrum label-free services, while France and Italy anchor food-safety applications tied to strict EU contamination thresholds. Regulatory divergence post-Brexit necessitates dual-compliance workflows, thereby elevating demand for harmonized analytics platforms in cross-channel biotech collaborations.

Competitive Landscape
The label free detection market shows moderate consolidation. Waters Corporation’s USD 17.5 billion acquisition of Becton Dickinson’s biosciences division augments its analytical suite with flow-cytometry assets, enabling cross-selling into existing chromatography accounts. Bruker’s purchase of Sierra Sensors in 2024 enriches its biorecognition portfolio and embeds label-free capabilities into its mass-spectrometry workflows. Danaher’s acquisition of the Biacore line secures SPR market leadership and expands recurring consumables revenue through proprietary chip chemistries.
Strategic focus has shifted from pure hardware differentiation to algorithm-driven data services. Vendors bundle AI modules that recommend assay conditions, driving lock-in through proprietary databases. Smaller entrants concentrate on niche arenas such as membrane-protein kinetics or cell-based impedance assays, positioning themselves as acquisition targets. Instrument-as-a-service contracts lower entry barriers for startups, but high switching costs maintain customer loyalty once data ecosystems are established.
Competitive intensity also surfaces in consumables where gold-coated chips and disposable sensors deliver margin expansion. Manufacturers are reshoring critical chip fabrication to Europe and North America to hedge geopolitical risk. Partner programs with CROs provide vendors with real-time feedback on chip performance, accelerating iterative improvements that sustain performance leads over low-cost imitators.
Label-Free Detection (LFD) Industry Leaders
PerkinElmer Inc
Corning Incorporated
Ametek Inc
Cytiva (Danaher Corporation)
Thermo Fisher Scientific Inc.
- *Disclaimer: Major Players sorted in no particular order

Recent Industry Developments
- February 2026: Bruker introduced iNTApharma, a label-free platform designed for single-particle sensitivity in the quantitative analysis of nanoscale bioparticles in native aqueous media. This solution enables rapid size and concentration assessments, supporting research, therapy development, and quality workflows without the need for labeling.
- February 2026: Gator Bio launched Gator HIS XT probes, the first BLI probes incorporating AI-designed binding proteins developed with Monod Bio. These probes, utilizing NovoBody anti-His binders, deliver enhanced affinity, improved baseline stability, and superior signal resolution.
- November 2025: BD unveiled a cell analyzer combining spectral and real-time imaging to enhance biological insights and throughput, addressing diverse applications in advanced flow cytometry experiments.


Global Label-Free Detection (LFD) Market Report Scope
As per the scope of the report, label-free detection (LFD) is a method for detecting biomolecules and their interactions. The LFD method has made tremendous advancements through the integration of knowledge from materials science, computational design, and nanofabrication.
The label-free detection (LFD) market is segmented by product, technology, application, end-user, and geography. By product, the market is segmented into consumables and instruments. By technology, the market is segmented into mass spectrometry, surface plasmon resonance, bio-layer interferometry, isothermal titration calorimetry, differential scanning calorimetry, and other LFD technologies. By application, the market is segmented into binding kinetics, binding thermodynamics, endogenous receptor detection, hit confirmation, lead generation, and other applications. By end-user, the market is segmented into pharmaceutical & biotechnology companies, academic & research institutes, and contract research organizations. By geography, the market is segmented into North America, Europe, Asia-Pacific, the Middle East and Africa, and South America. The market report also covers the estimated market sizes and trends for 17 different countries across major regions globally. The report offers market size and forecasts in value (USD) for the above segments.
| Consumables |
| Instruments |
| Service & Software |
| Surface Plasmon Resonance (SPR) |
| Bio-Layer Interferometry (BLI) |
| Mass Spectrometry |
| Isothermal Titration Calorimetry (ITC) |
| Differential Scanning Calorimetry (DSC) |
| Acoustic Resonance |
| Other Emerging LFD Technologies |
| Binding Kinetics |
| Binding Thermodynamics |
| Endogenous Receptor Detection |
| Hit Confirmation |
| Lead Generation |
| Biologics Characterization |
| Cell-Based Assays |
| Other Applications |
| Pharmaceutical & Biotechnology Companies |
| Academic & Research Institutes |
| Contract Research Organizations |
| Diagnostic Laboratories |
| Cell & Gene Therapy Manufacturers |
| Others |
| North America | United States |
| Canada | |
| Mexico | |
| Europe | Germany |
| United Kingdom | |
| France | |
| Italy | |
| Spain | |
| Rest of Europe | |
| Asia-Pacific | China |
| India | |
| Japan | |
| Australia | |
| South Korea | |
| Rest of Asia-Pacific | |
| Middle East and Africa | GCC |
| South Africa | |
| Rest of Middle East and Africa | |
| South America | Brazil |
| Argentina | |
| Rest of South America |
| By Product | Consumables | |
| Instruments | ||
| Service & Software | ||
| By Technology | Surface Plasmon Resonance (SPR) | |
| Bio-Layer Interferometry (BLI) | ||
| Mass Spectrometry | ||
| Isothermal Titration Calorimetry (ITC) | ||
| Differential Scanning Calorimetry (DSC) | ||
| Acoustic Resonance | ||
| Other Emerging LFD Technologies | ||
| By Application | Binding Kinetics | |
| Binding Thermodynamics | ||
| Endogenous Receptor Detection | ||
| Hit Confirmation | ||
| Lead Generation | ||
| Biologics Characterization | ||
| Cell-Based Assays | ||
| Other Applications | ||
| By End-User | Pharmaceutical & Biotechnology Companies | |
| Academic & Research Institutes | ||
| Contract Research Organizations | ||
| Diagnostic Laboratories | ||
| Cell & Gene Therapy Manufacturers | ||
| Others | ||
| By Geography | North America | United States |
| Canada | ||
| Mexico | ||
| Europe | Germany | |
| United Kingdom | ||
| France | ||
| Italy | ||
| Spain | ||
| Rest of Europe | ||
| Asia-Pacific | China | |
| India | ||
| Japan | ||
| Australia | ||
| South Korea | ||
| Rest of Asia-Pacific | ||
| Middle East and Africa | GCC | |
| South Africa | ||
| Rest of Middle East and Africa | ||
| South America | Brazil | |
| Argentina | ||
| Rest of South America | ||


Key Questions Answered in the Report
What is the 2026 value of the label free detection market?
The label free detection market size is USD 2.13 billion in 2026.
Which region is growing fastest?
Asia-Pacific is forecast to post a 12.08% CAGR between 2026 and 2031.
Which technology segment leads in 2025?
SPR systems held 46.10% of 2025 revenue.
What application segment is expanding quickest?
Diagnostics and quality control are advancing at a 12.25% CAGR through 2031.
How are AI tools affecting adoption?
AI-assisted kinetic modelling cuts hit-to-lead cycles to 6 to12 months, speeding project decisions and encouraging instrument purchases.
What is the chief barrier for small labs?
Upfront instrument prices of USD 300,000 to 800,000 alongside annual service fees limit access for early-stage companies.
Page last updated on:


