KVM Switch Market Size and Share
Market Overview
| Study Period | 2020 - 2031 |
|---|---|
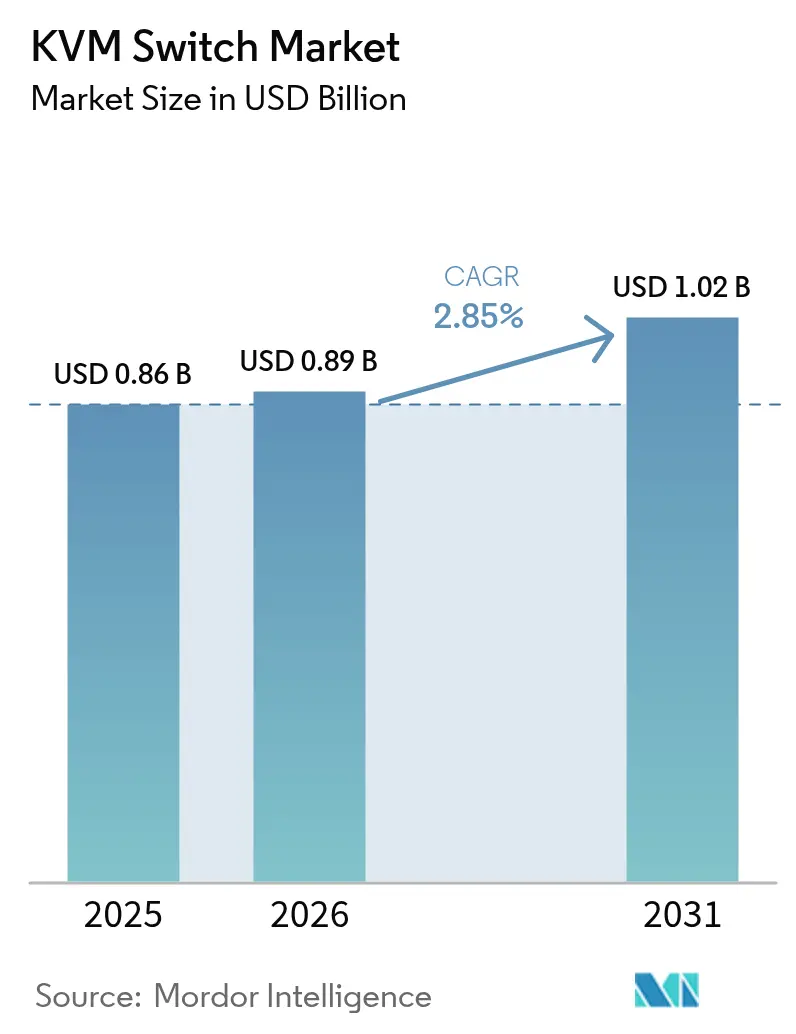
| Market Size (2026) | USD 0.89 Billion |
| Market Size (2031) | USD 1.02 Billion |
| Growth Rate (2026 - 2031) | 2.85% CAGR |
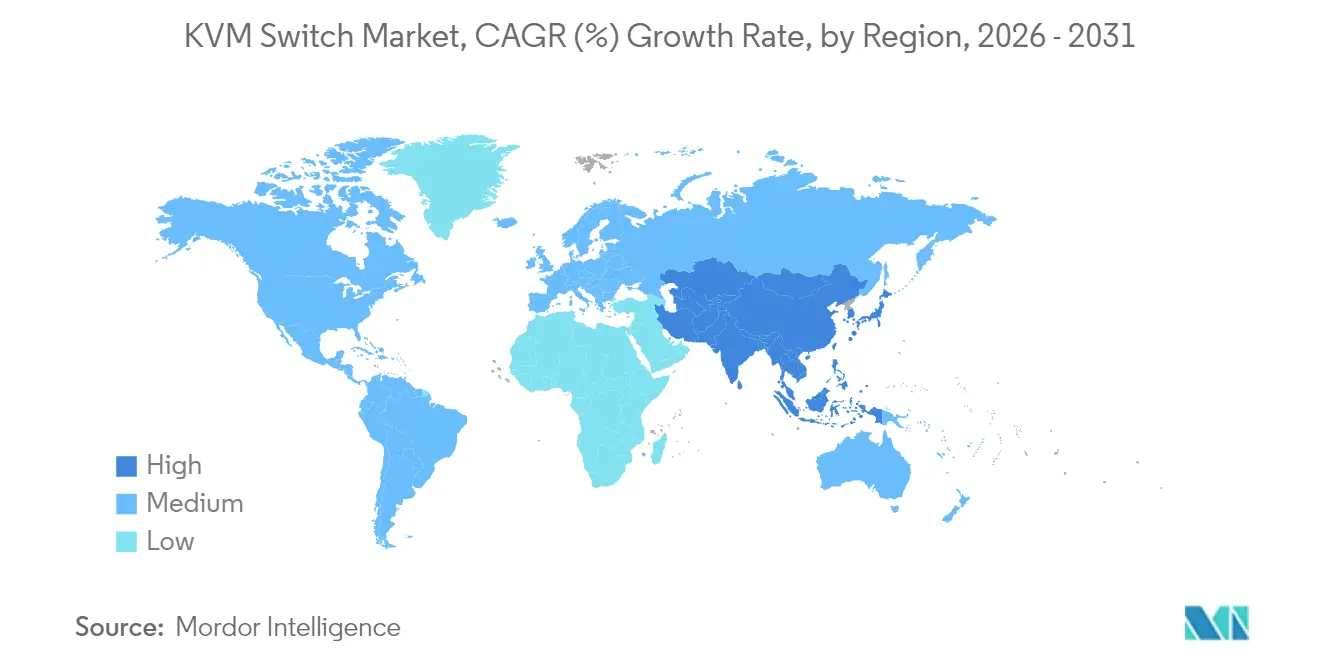
| Fastest Growing Market | Asia Pacific |
| Largest Market | North America |
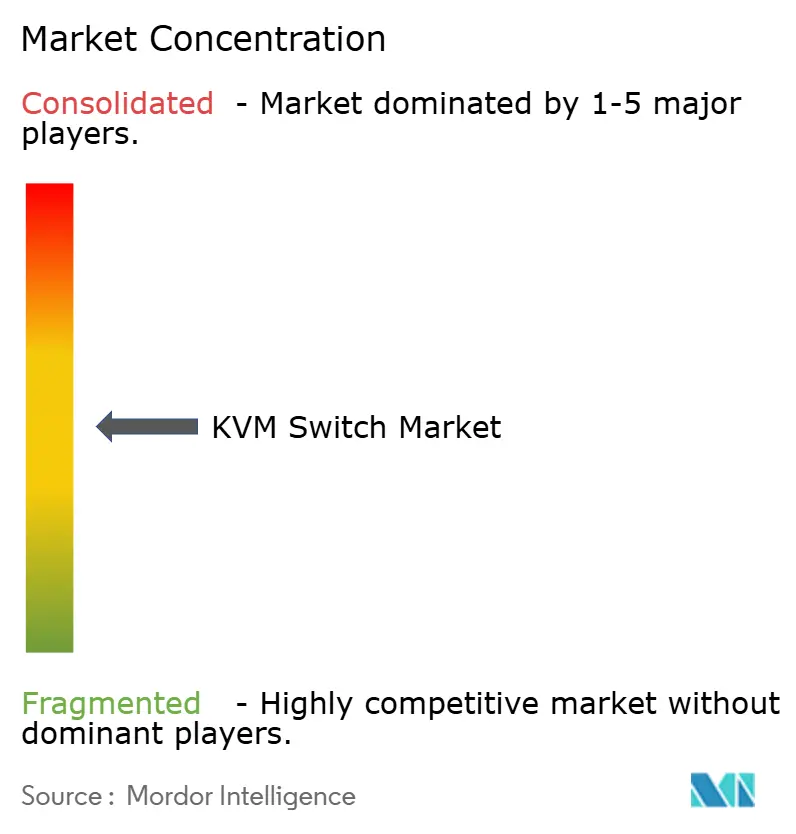
| Market Concentration | Medium |
Major Players *Disclaimer: Major Players sorted in no particular order Image © Mordor Intelligence. Reuse requires attribution under CC BY 4.0. | |
KVM Switch Market Analysis by Mordor Intelligence
The KVM switch market size was valued at USD 0.86 billion in 2025 and estimated to grow from USD 0.89 billion in 2026 to reach USD 1.02 billion by 2031, at a CAGR of 2.85% during the forecast period (2026-2031). Behind this measured pace, the sector is undergoing two opposing changes: a gradual decline in low-cost desktop applications as enterprises migrate to software alternatives, and a surge in high-performance hardware driven by artificial-intelligence (AI) infrastructure build-outs. Healthy project backlogs at data-center integrators, wider secure-desktop adoption in public agencies, and sustained government procurement cycles continue to underpin unit shipments even as commoditized models face margin compression. Hardware remains essential in circumstances where BIOS-level, out-of-band or air-gapped access must be guaranteed, placing physical switches at the center of long-term data-center reliability strategies despite the availability of cloud-native remote-desktop tools. Intensifying video-resolution requirements and the transition toward higher-bandwidth optical networks further reinforce the need for specialized ASIC-based solutions that software alone cannot replicate, especially in latency-sensitive environments. In parallel, edge computing deployments are broadening the addressable opportunity for ruggedized devices that can operate in uncontrolled field conditions.
Key Report Analysis
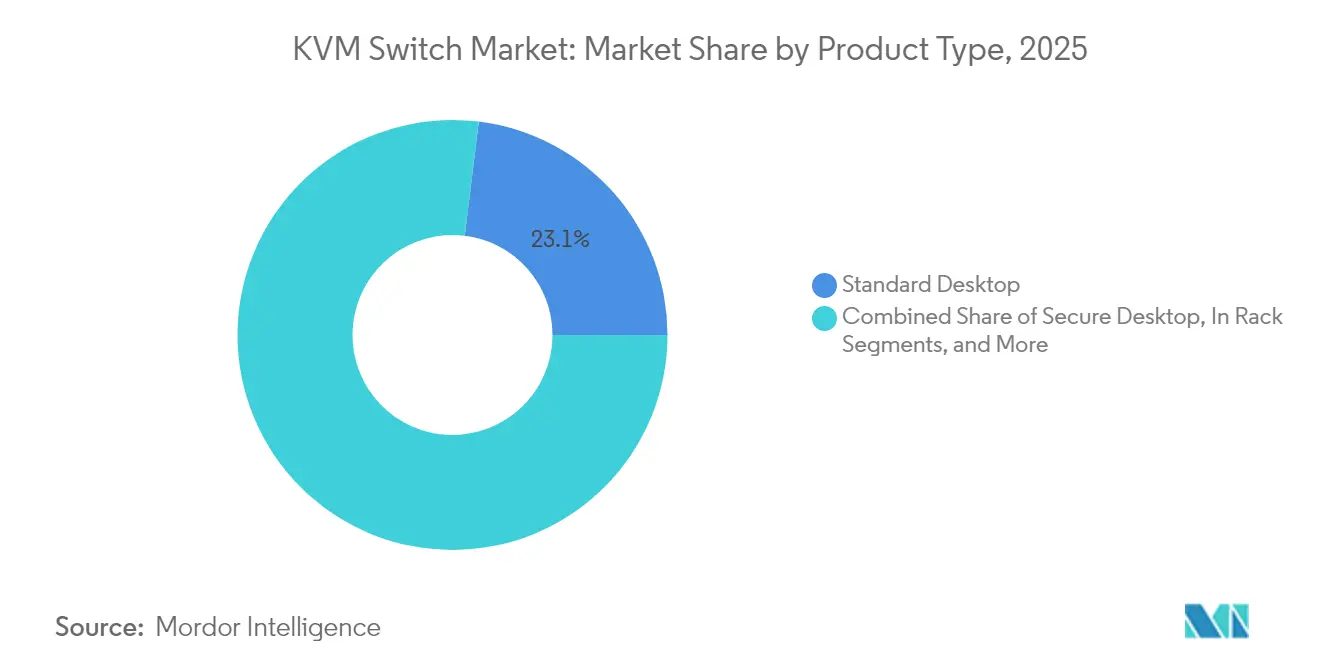
- By product type, standard desktop units retained 23.05% revenue share in 2025, but secure-desktop models are projected to advance at a 3.25% CAGR through 2031.
- By user type, single-user designs commanded 52.20% of the KVM switch market share in 2025, whereas multi-user platforms are forecast to expand at 4.85% CAGR to 2031.
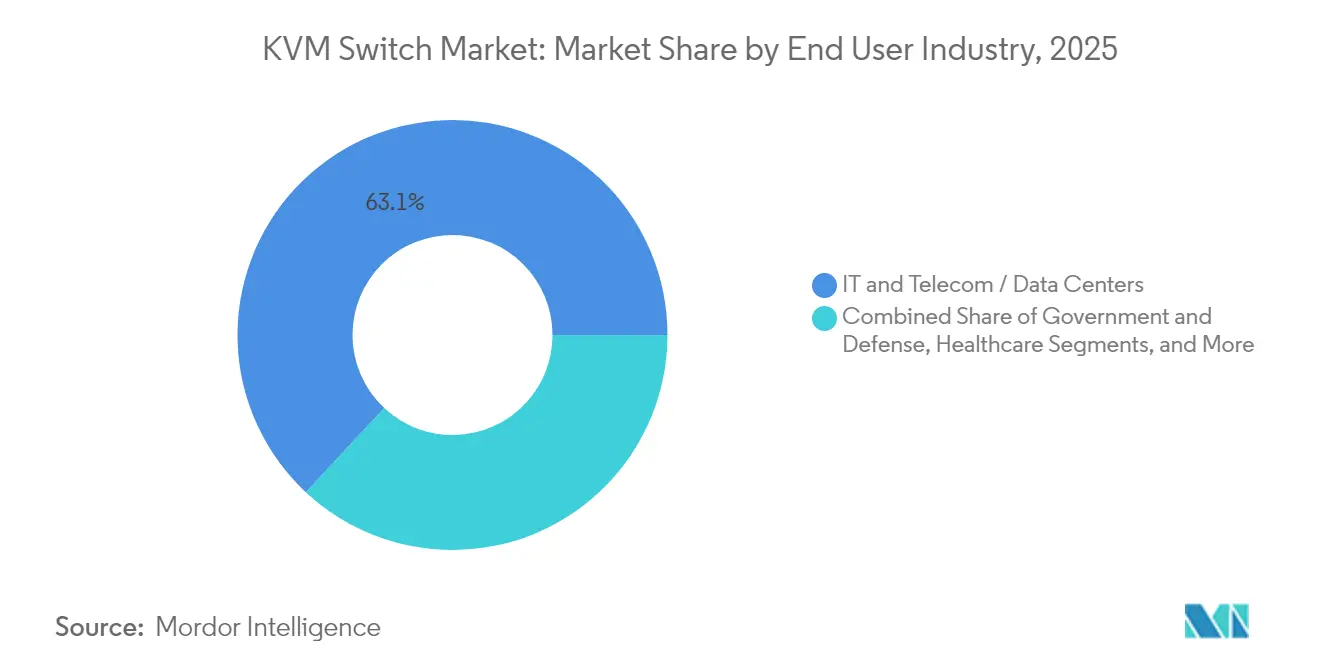
- By end-user industry, IT and telecom/data-center customers accounted for 63.05% of the KVM switch market size in 2025; government and defense demand is on track to grow at a 4.35% CAGR through 2031.
- By connectivity interface, KVM-over-IP solutions captured 32.40% of 2025 revenue and NIAP-certified secure interfaces are progressing at a 4.10% CAGR.
- By geography, North America held 23.20% of global revenue in 2025, while Asia-Pacific is the fastest-growing region at a 3.55% CAGR to 2031.
Note: Market size and forecast figures in this report are generated using Mordor Intelligence’s proprietary estimation framework, updated with the latest available data and insights as of 2026.
Global KVM Switch Market Trends and Insights
Drivers Impact Analysis*
| Driver | (~) % Impact on CAGR Forecast | Geographic Relevance | Impact Timeline |
|---|---|---|---|
| Cloud migration and hyperscale data-center build-outs | +0.8% | Global, APAC fastest | Medium term (2-4 years) |
| Rising secure-desktop uptake in defense and government | +0.6% | North America and EU, expanding to Asia-Pacific | Long term (≥ 4 years) |
| Demand surge for KVM-over-IP in remote IT operations | +0.7% | Global, accelerated post-pandemic | Short term (≤ 2 years) |
| Edge micro-data-center rollouts requiring ruggedized units | +0.4% | Asia-Pacific core, spill-over to MEA | Medium term (2-4 years) |
| AI-enabled predictive-maintenance features | +0.3% | North America and EU early adopters | Long term (≥ 4 years) |
| Source: Mordor Intelligence | |||
Cloud Migration and Hyperscale Data-Center Build-Outs
Hyperscale operators continue to procure hardware KVM platforms because software cannot provide BIOS-level or power-cycle control during network outages. Vertiv recorded 37% organic orders growth in Q3 2024 and a USD 7.4 billion backlog linked to AI-ready facilities where out-of-band access is mandatory.[1]Vertiv Holdings Co., “Q3 2024 Earnings Release,” investor.vertiv.com Private-equity transactions such as Blackstone’s USD 16 billion AirTrunk acquisition illustrate investor confidence in physical management layers that complement software orchestration. CommScope reports fiber densities moving rapidly toward 400G, 800G, and 1.6T, compounding infrastructure complexity and reinforcing demand for reliable local switching fabric.
Rising Secure-Desktop Adoption in Defense and Government
Public-sector agencies rely on NIAP-certified hardware to maintain air-gapped and classified environments where network-dependent tools fail security audits. Raritan offers FIPS 140-2 encryption and Common Access Card log-ins that meet U.S. and EU defense requirements. Adder Technology’s consoles help command centers visualize multi-classification data on a single operator desk without risking crossover contamination.[2]Raritan, “Secure KVM Switches: Government and Military Solutions,” raritan.com Procurement cycles are slower but value-focused; once installed, systems remain in service beyond five-year refresh periods, locking in a steady replacement pipeline as certification standards evolve.
Demand Surge for KVM-over-IP for Remote IT Operations
Enterprise hybrid-work policies require administrators to troubleshoot servers even when primary networks are down. A major public broadcaster installed 47 Black Box Emerald endpoints to sustain 360 days of live programming with 4K video headroom, proving scalability in real-time environments. Raritan’s KX IV-101 delivers Java-free browser access and 4K resolution to address security concerns tied to legacy plugins while supporting high-pixel-density screens.[3]Adder Technology, “Mission-Critical Command and Control Solutions,” adder.com
Edge Micro-Data-Center Deployments Driving Ruggedized High-Performance KVM
Guntermann & Drunck’s VisionXS extenders employ Bluedec compression for lossless transmission across long links and withstand vibration, temperature swings, and electromagnetic interference in field cabinets. ASEAN carriers are pushing edge-node rollouts alongside 5G, opening demand for industrial-grade switches that run unattended yet permit instant service access when faults arise.
Restraints Impact Analysis*
| Restraint | (~) % Impact on CAGR Forecast | Geographic Relevance | Impact Timeline |
|---|---|---|---|
| Proliferation of software-based remote-desktop alternatives | -0.9% | Global, with stronger impact in cost-sensitive markets | Short term (≤ 2 years) |
| High upfront cost and integration complexity in legacy sites | -0.5% | North America and EU legacy infrastructure | Medium term (2-4 years) |
| Semiconductor supply-chain volatility for high-res video ASICs | -0.4% | Global manufacturing, concentrated in Asia-Pacific | Short term (≤ 2 years) |
| Network latency and bandwidth limitations for KVM-over-IP deployments | -0.3% | Global, particularly affecting remote locations | Medium term (2-4 years) |
| Source: Mordor Intelligence | |||
Proliferation of Software-Based Remote-Desktop Alternatives
Cost-driven enterprises now consider hypervisor-embedded consoles that eliminate discrete hardware; Hewlett Packard Enterprise’s KVM-based solution, launched after VMware’s pricing reset, exemplifies the shift toward subscription-style models. Software portfolios iterate faster and integrate with monitoring suites, lowering operating overhead for uncomplicated tasks. However, they remain exposed to network failures, latency spikes, and broader cyber-attack surfaces that limit use in mission-critical racks.
High Upfront Cost and Integration Complexity in Legacy Sites
Many legacy halls lack spare rack units, structured cabling or cooling headroom needed for modern, high-bandwidth switches. Retrofits often demand new PDUs, cable trays or even floor reinforcement, adding hidden costs that can double an initial bill of materials. Strict change-management in regulated industries extends testing phases, slowing full deployment and nudging smaller firms toward software-only fixes despite functional gaps
*Our forecasts treat driver/restraint impacts as directional, not additive. The impact forecasts reflect baseline growth, mix effects, and variable interactions.
Segment Analysis
By Product Type: Secure Desktop Accelerates Despite Standard Dominance
Standard desktop platforms delivered 23.05% of 2025 revenue, reflecting ongoing demand for straightforward, low-priced server access. Secure-desktop devices, though smaller in absolute terms, are set to outpace them through 2031 as agencies harden workstation fleets and enterprises formalize zero-trust roadmaps. Government frameworks mandate Common Criteria certifications, pushing procurement toward FIPS-validated chipsets and tamper-resistant circuitry that justify list-price premiums. High-performance units with proprietary compression rise in broadcast studios, simulation labs and aerospace test rigs where frame integrity and sub-millisecond latency govern operator effectiveness. In-rack models meanwhile capture density-focused colocation halls where cable length constraints meet top-of-rack switch layouts.
Raritan’s crypto-enabled designs exemplify how moving to secure-desktop formats can unlock programs previously closed to generic hardware, shielding sensitive data flows from unauthorized USB injection attacks and screen-scraping malware


By User Type: Multi-User Growth Signals Consolidation Trend
Single-user architectures claimed 52.20% of global spending in 2025, favored for isolated racks, small labs or enclave-style secure rooms. Multi-user frames, hosting matrix switching and dynamic session hand-offs, are expanding at a 4.85% CAGR as large enterprises centralize support teams. Cloud operators now run around-the-clock maintenance windows administered from multiple continents, necessitating concurrent doorstep access to the same physical host from different shifts.
Guntermann and Drunck’s FreeSeating function showcases seamless transition between operators, reducing log-in delays and freeing unused compute cycles during off-hours. The KVM switch market size for multi-user equipment is projected to widen further as managed-service providers fold hardware into packaged colocation offers, giving customers hands-off remote control while preserving air-gapped independence. Where security allows, pooling several admins through a shared matrix lowers capital cost per seat and improves utilization, supporting the overall profitability of managed data-center footprints.
By End-User Industry: Government Defense Momentum Challenges IT Dominance
IT and telecom/data-center operators generated 63.05% of revenue in 2025, driven by routine server provisioning and migration to high-density blade farms. Yet public-sector budgets show the strongest multiyear lift, with a 4.35% CAGR predicted through 2031 as threat-surface expansion triggers hardening mandates. Classified programs in defense ministries must view multi-level secure video on single monitors without exposing cross-domain leakage, a requirement natively served by NIAP-approved switches.
Media and entertainment houses such as leading broadcasters rely on 4K-ready extenders to move camera feeds over IP without jitter, a workload currently out of reach for many purely software consoles. Hospitals are another specialist niche: operating-room tele-robotics and radiology viewers require hardware isolation to safeguard patient data, propelling niche vendors that can pair medical-grade housings with antimicrobial surfaces. Industrial automation is the final emerging pocket, as remote production monitoring grows in smart-factory programs where local IT staff is minimal.
By Connectivity Interface: NIAP-Certified Security Gains Traction
KVM-over-IP holdings controlled 32.40% of sales in 2025, proving that secure network tunneling does not negate the need for a discrete hardware hop at the source. NIAP-certified secure ports, though currently behind in share, show a 4.10% growth clip, reflecting the widening geographic reach of Common Criteria procurement rules. Where operators refresh fleet PCs, DisplayPort 1.4 and USB-C rise quickly, often bundled with power delivery and multi-stream transport that legacy analog VGA cannot match.
Raritan’s latest family offers AES-256 encryption across IP links, illustrating how hardware can reconcile network manageability with tamper-evident security. Guntermann & Drunck’s RemoteAccess-GATE couples KVM islands to management VLANs without relinquishing keyboard-video integrity, meeting operator requirements for both physical and logical segmentation
Geography Analysis
North America retained 23.20% of global revenue in 2025. Demand here is tied to refresh cycles in hyperscale campuses, compliance with federal cybersecurity directives and ongoing upgrades in defense facilities. Vertiv’s USD 2.04 billion Q1 2025 revenue underscores sustained public-cloud expansions coupled with AI hardware rollouts that require dependable out-of-band layers. Canada contributes incremental volume through investment incentives for sustainable data centers, while Mexico’s manufacturing corridors adopt KVM solutions to support remote line diagnostics in export-oriented plants.
Asia-Pacific is the fastest-growing territory at a 3.55% CAGR through 2031. Regional capacity has already exceeded 12.2 GW, and institutional investors such as KKR and Bain Capital continue to acquire assets across Singapore, China and Indonesia, anchoring multi-year build pipelines. The KVM switch market benefits directly as hyperscale developers specify hardware control points for disaster-recovery compliance. In parallel, telcos in India and ASEAN roll out edge micro-facilities tied to 5G slices, spurring demand for ruggedized units able to tolerate outdoor heat and humidity.

Competitive Landscape
The KVM switch market is structurally fragmented. Tier-one infrastructure brands such as Vertiv leverage scale economies to bundle switching with power and cooling, capturing cross-portfolio synergies unavailable to single-product firms. Vertiv’s AI collaboration with NVIDIA highlights a route to embed KVM hooks inside GPU-dense racks that must remain serviceable without server downtime.
Specialist vendors counter this scale by innovating at the application layer. Raritan focuses on defense and intelligence data rooms, building in smart-card access and automatic channel logout. Guntermann & Drunck targets broadcast and industrial automation, investing in proprietary video-compression silicon that reduces latency below 1 frame. Adder Technology extends reach through partnerships with display specialist Eizo, integrating color-calibrated monitors with zero-pixel-loss switching for mission-planning suites.
KVM Switch Industry Leaders
ATEN International
Fujitsu Limited
D-Link Corporation
Dell Technologies Inc.
Schneider Electric SE
- *Disclaimer: Major Players sorted in no particular order

Recent Industry Developments
- April 2025: Vertiv Holdings Co. reported Q1 2025 net sales of USD 2.04 billion, up 24% year over year on strong AI-driven data-center demand.
- January 2025: Adder Technology partnered with Solstice AV and Eizo to launch ADDERLink XDIP and ARDx for IP-based switching.
- December 2024: Vertiv disclosed Q4 2024 net sales of USD 2.35 billion, a 26% jump, with organic orders up 30%.
- October 2024: Vertiv posted Q3 2024 revenue of USD 2.07 billion, citing a USD 7.4 billion backlog linked to AI and liquid cooling.


Research Methodology Framework and Report Scope
Market Definitions and Key Coverage
Our study treats the keyboard-video-mouse (KVM) switch market as all purpose-built hardware that lets an operator control two or more servers, PCs, or appliances from a single keyboard, monitor, and mouse, whether the connection is analog, digital, or IP based. We include rack-mount, desktop, secure NIAP-approved, and high-performance models sold as standalone units or bundled with essential accessories.
Exclusion: software-only remote-desktop tools and embedded BMC/IPMI cards are outside scope.
Segmentation Overview
- By Product Type
- Standard Desktop
- Secure Desktop
- In-rack
- KVM-over-IP
- Other Types
- By User Type
- Single-User
- Multi-User
- By End-User Industry
- IT and Telecom / Data Centers
- Industrial Automation
- Government and Defense
- Healthcare
- Media and Entertainment
- Others
- By Connectivity Interface
- Analog (VGA)
- Digital (DVI/HDMI)
- DisplayPort / USB-C
- KVM-over-IP
- NIAP-certified Secure
- By Geography
- North America
- United States
- Canada
- Mexico
- South America
- Brazil
- Argentina
- Rest of South America
- Europe
- Germany
- United Kingdom
- France
- Italy
- Spain
- Russia
- Rest of Europe
- Asia-Pacific
- China
- Japan
- India
- South Korea
- Australia and New Zealand
- Southeast Asia
- Rest of Asia-Pacific
- Middle East and Africa
- Middle East
- Saudi Arabia
- United Arab Emirates
- Turkey
- Rest of Middle East
- Africa
- South Africa
- Nigeria
- Egypt
- Rest of Africa
- Middle East
- North America
Detailed Research Methodology and Data Validation
Desk Research
We start by collecting shipment, trade, and installed-base signals from tier-one sources such as UN Comtrade, U.S. International Trade Commission import codes, Statistics Canada, and Eurostat, which reveal physical flows of KVM hardware. Public filings from leading system vendors, data-center construction surveys of Uptime Institute, and technical papers indexed on IEEE Xplore give added color on unit capacities, port counts, and refresh cycles. Paid databases like D&B Hoovers (financials) and Dow Jones Factiva (news momentum) help benchmark company footprints and announce plant expansions. These illustrate patterns but, of course, are not our only references; many additional documents informed the desk phase.
Primary Research
Mordor analysts interview data-center managers, defense IT administrators, and specialty distributors across North America, Europe, and Asia-Pacific. Conversations clarify average selling prices, secure-switch adoption, and rack-level attach rates, while short web surveys quantify port-mix shifts that secondary sources seldom capture.
Market-Sizing & Forecasting
A top-down model rebuilds 2024 installed server racks by region, marries them with KVM penetration ratios, and multiplies by blended ASPs. Select bottom-up checks, supplier rollups for Tier-1 brands and sampled channel invoices, fine-tune totals. Key variables tracked include annual hyperscale rack additions, multi-user share, NIAP-certified unit mix, average IP-based price premium, refresh interval length, and currency conversion to 2025 dollars. Five-year outlooks employ multivariate regression that links the above indicators with macro drivers like remote-work prevalence and edge build-outs, then scenario analysis adjusts for capex cyclicality.
Data Validation & Update Cycle
Every draft model passes variance checks against historical customs data, peer ratios, and fresh interview feedback. Senior reviewers sign off only after anomalies are resolved. Reports refresh yearly and, when material events break, analysts revisit the dataset ahead of client delivery.
Why Mordor's KVM Switch Baseline Commands Credibility
Published figures vary widely because firms choose different device mixes, price ladders, and forecast assumptions. Some fold extenders and serial consoles into totals, others anchor growth on aggressive rack forecasts, while a few under-sample secure models.
Key gap drivers include scope breadth, ASP derivation (channel-weighted versus list price), cadence of primary validation, and currency treatment. Mordor keeps a narrow hardware definition, updates inputs yearly, and cross-checks with live practitioner feedback, which tempers extremes seen elsewhere.
Benchmark comparison
| Market Size | Anonymized source | Primary gap driver |
|---|---|---|
| USD 0.86 B (2025) | Mordor Intelligence | N/A |
| USD 2.39 B (2024) | Global Consultancy A | Adds extenders and KVM software, applies high list prices |
| USD 1.19 B (2024) | Industry Knowledge Firm B | Uses five-year average FX rates and bullish rack growth |
| USD 0.73 B (2024) | Trade Journal C | Excludes secure desktop models; limited primary validation |
Taken together, the comparison shows that Mordor's disciplined scope selection, yearly refresh, and dual validation give decision-makers a balanced, transparent baseline they can retrace and stress-test with ease.


Key Questions Answered in the Report
How large is the KVM switch market in 2026?
The sector is valued at USD 0.89 billion in 2026 and is projected to reach USD 1.02 billion by 2031, growing at a 2.85% CAGR.
Which region is expanding fastest for KVM hardware?
Asia-Pacific leads growth with a 3.55% CAGR through 2031, propelled by record data-center construction activity and edge-computing rollouts.
Why are secure-desktop KVM switches gaining momentum?
Government and defense buyers mandate NIAP-certified, hardware-isolated solutions for air-gapped and multi-classification environments, lifting secure-desktop demand at a 3.25% CAGR.
What is driving multi-user KVM adoption?
Enterprises consolidate IT operations and adopt follow-the-sun support models, causing multi-user systems to expand at 4.85% CAGR as they enable multiple administrators to share hardware access efficiently.
Page last updated on:


