KSA Manned Security Market Size and Share
Market Overview
| Study Period | 2020 - 2031 |
|---|---|
| Forecast Data Period | 2026 - 2031 |
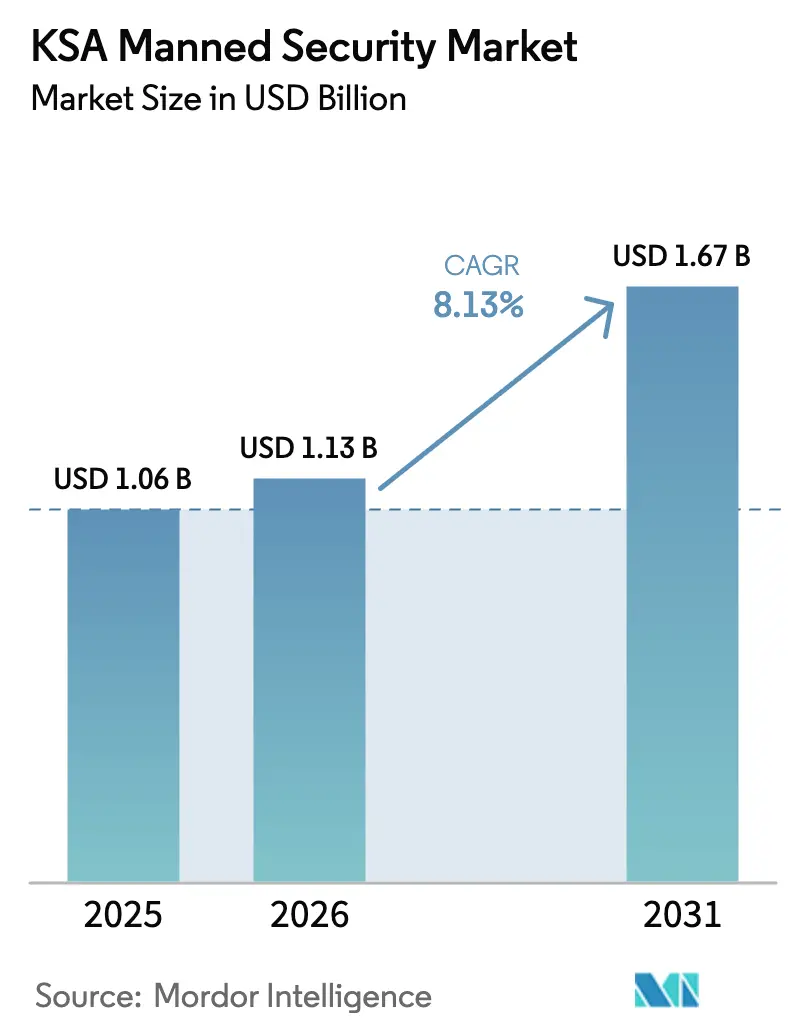
| Base Year Market Size (2025) | USD 1.06 Billion |
| Market Size (2026) | USD 1.13 Billion |
| Market Size (2031) | USD 1.67 Billion |
| Growth Rate (2026 - 2031) | 8.13% CAGR |
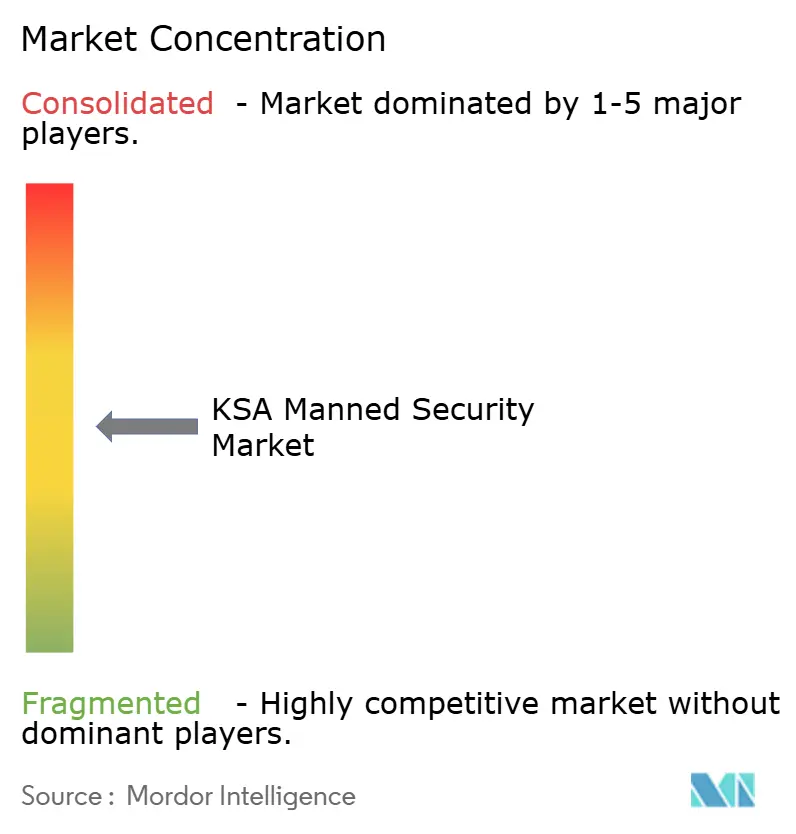
| Market Concentration | Medium |
Major Players *Disclaimer: Major Players sorted in no particular order Image © Mordor Intelligence. Reuse requires attribution under CC BY 4.0. | |
KSA Manned Security Market Analysis by Mordor Intelligence
The KSA manned security market size is expected to increase from USD 1.06 billion in 2025 to USD 1.13 billion in 2026 and reach USD 1.67 billion by 2031, growing at a CAGR of 8.13% over 2026-2031. Intensifying construction activity across NEOM, the Red Sea Project, and Qiddiya is creating a sustained requirement for guards who manage perimeters, regulate access, and respond to emergencies, even while AI-enabled surveillance systems proliferate. Vision 2030 mega-projects are pairing 24-hour patrols with smart-camera grids rather than substituting one for the other, which keeps human presence indispensable on the ground. Mandatory Saudization decrees that took effect in February 2025 have tightened labor supply and lifted wage floors, adding cost pressure yet also pushing operators to professionalize training and compliance frameworks. Commercial venues such as retail chains, hotels, and entertainment complexes continue to dominate revenue, while industrial sites led by petrochemical plants, logistics hubs, and hyperscale data centers are advancing the fastest as asset values scale and regulators impose stricter security protocols.
Key Report Takeaways
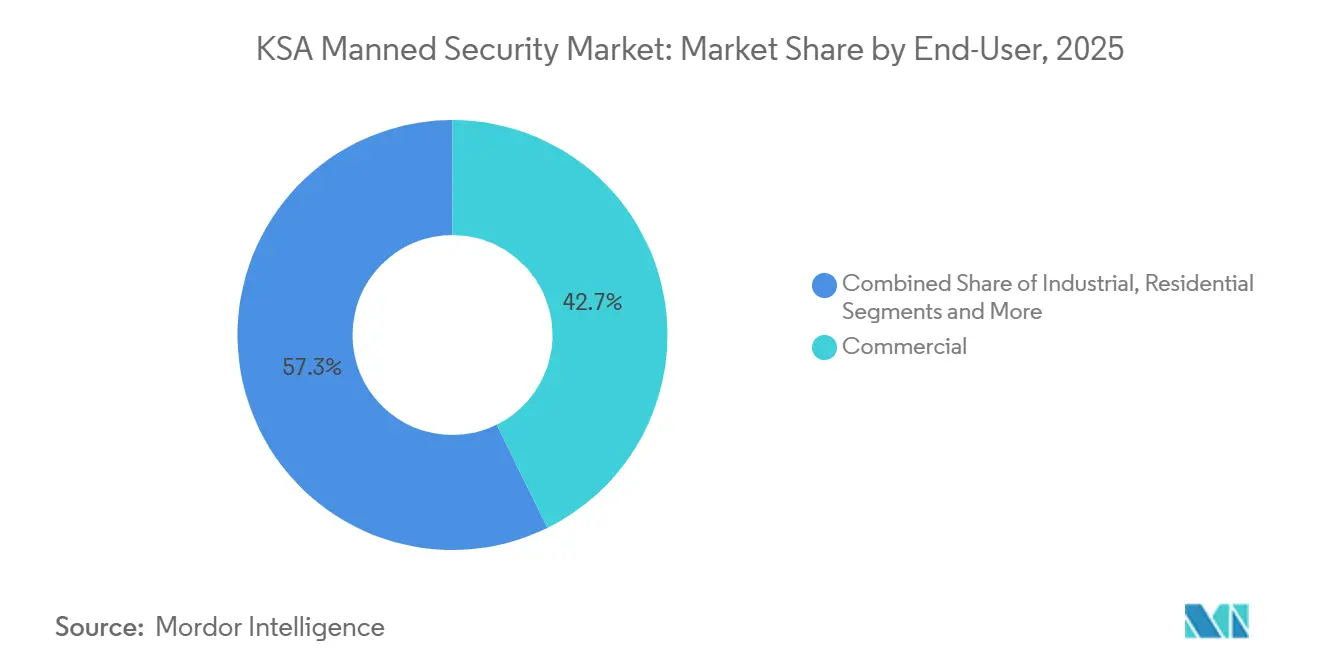
- By end-user, commercial facilities led with 42.72% of the KSA manned security market share in 2025, while the industrial segment is advancing at an 8.53% CAGR through 2031.
- By service type, static guarding commanded 55.43% share of the KSA manned security market size in 2025, whereas cash-in-transit is projected to expand at a 9.48% CAGR between 2026-2031.
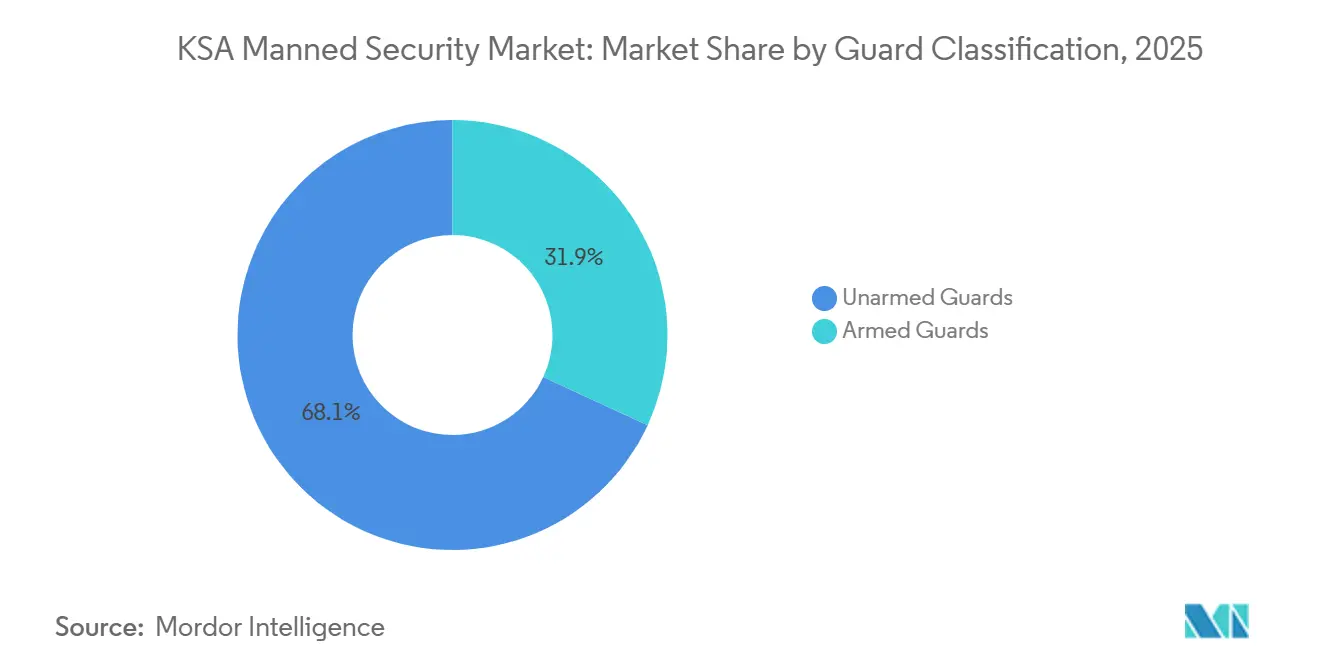
- By guard classification, unarmed officers accounted for 68.11% share in 2025 and armed personnel are growing at an 8.31% CAGR over the same forecast window.
- By contract duration, long-term agreements above 12 months held 61.83% share in 2025, yet event-based contracts are forecast to post an 8.49% CAGR to 2031.
Note: Market size and forecast figures in this report are generated using Mordor Intelligence’s proprietary estimation framework, updated with the latest available data and insights as of 2026.
KSA Manned Security Market Trends and Insights
Drivers Impact Analysis*
| Driver | (~) % Impact on CAGR Forecast | Geographic Relevance | Impact Timeline |
|---|---|---|---|
| Expansion of GIGA Projects Under Vision 2030 | +2.1% | National, focused in NEOM, Red Sea Project, Qiddiya | Long term (≥ 4 years) |
| Mandatory Saudization Targets for Security Guards | +1.4% | National, enforcement strongest in Riyadh, Jeddah, Dammam | Medium term (2–4 years) |
| Growth in High-Value Logistics and Cash Management | +1.3% | National, early gains along Riyadh–Jeddah–Eastern Province corridor | Medium term (2–4 years) |
| Surge in Critical Infrastructure, NEOM Ports, Data Centers | +1.2% | National, spill-over to NEOM industrial zones, Dammam clusters | Long term (≥ 4 years) |
| Mainstreaming Public-Private Security Partnerships | +0.7% | National, pilots in Riyadh and Mecca | Medium term (2–4 years) |
| Demand From Private Mega-Events, Formula 1, Riyadh Season | +0.9% | Riyadh, Jeddah, Mecca and Medina | Short term (≤ 2 years) |
| Source: Mordor Intelligence | |||
Expansion Of GIGA Projects Under Vision 2030
NEOM mobilized 140,000 workers by mid-2025, and the Red Sea Project spans 28,000 km², both of which obligate developers to fund 24-hour manned patrols despite parallel investments in AI cameras.[1]Saudi Press Agency, “NEOM Workforce Reaches 140,000 as Phase 1 Infrastructure Advances,” SPA.GOV.SA A USD 500 billion Public Investment Fund commitment secures budgets for perimeter guards, access controllers, and emergency responders through the decade. Qiddiya alone plans to welcome 17 million visitors annually by 2030 and has locked in multi-year guard contracts that favor domestic staffing. Vast site dispersion means a single incident can occur kilometers away from the nearest command center, making rapid human intervention irreplaceable. Collectively, these projects anchor long-term demand that outweighs substitution risk from surveillance software.
Mandatory Saudization Targets For Security Guards
The February 2025 decree reserving private security roles for Saudi nationals removed the expatriate pool that once filled 40% of guard posts. Wage premiums have risen 15-25% as firms compete for certified citizens, and 100% Saudi staffing thresholds now trigger license audits. Market leaders such as Securitas AB pre-emptively trained 10,000 officers in 2024 under its Certified Data Center Security Professional program, enabling them to meet ISO 27001 client requirements and secure higher-margin contracts. Smaller operators without structured academies face onboarding delays of six-to-eight weeks, which restricts their ability to respond to tenders. The policy therefore both inflates costs and accelerates industry consolidation.
Growth In High-Value Logistics And Cash Management
E-commerce logistics surged from USD 4.57 billion in 2024 to a projected USD 13.66 billion by 2033, magnifying the volume and value of cash and goods in transit. Saudi Central Bank rules issued in May 2025 require armed escorts and GPS-tracked armories for any load above SAR 100,000 (USD 26,667). Jeddah-based Nesma Security grew its armored fleet 30% in 2025 to capitalize on an 18% jump in point-of-sale transactions. These regulations push demand toward specialized, higher-rate services that average ticket prices 25-40% above static guarding. As online retail scales, the KSA manned security market embeds itself deeper in the cash lifecycle from warehouse to ATM.
Surge In Critical Infrastructure, NEOM Ports, Data Centers
The Saudi National Data Center Strategy targets 1.5 GW by 2030, and the Public Investment Fund earmarked USD 6 billion for digital infrastructure in 2024. Hyperscale complexes by Microsoft, Oracle, AWS, and Google require ISO 27001-certified, armed guards 24-hours a day. Humain and Center3 each announced 1 GW campuses in Riyadh, embedding biometric access control and AI video analytics that still depend on physical responders. NEOM’s future port will handle 1.3 million TEU annually and mandates patrols, cargo screening, and customs-area oversight. Collectively, critical infrastructure projects transfer industrial safety and cyber-security requirements onto guard specifications, lifting training standards and daily rates.
Restraints Impact Analysis*
| Restraint | (~) % Impact on CAGR Forecast | Geographic Relevance | Impact Timeline |
|---|---|---|---|
| Rapid Adoption of AI-Enabled Video Surveillance | -1.1% | Riyadh smart-city deployments, Mecca Hajj monitoring | Short term (≤ 2 years) |
| Rising Labor Costs Driven by Wage Protection System | -0.9% | Riyadh, Jeddah, Dammam labor markets | Medium term (2–4 years) |
| Grey-Market Guard Providers Undercutting Pricing | -0.5% | Smaller cities and industrial peripheries | Short term (≤ 2 years) |
| High Turnover Due to Stricter Work-Hour Regulations | -0.4% | Outdoor posts in Eastern Province, NEOM zones | Medium term (2–4 years) |
| Source: Mordor Intelligence | |||
Rapid Adoption Of AI-Enabled Video Surveillance
Riyadh integrated 1,600 AI cameras into its Baseer platform in 2025, trimming static guard posts at parks and intersections by 12%.[2]Saudi Data and Artificial Intelligence Authority, “Baseer Platform Integrates 1,600 AI-Enabled Cameras Across Riyadh,” SDAIA.GOV.SA The same software was pilot-tested during Hajj and cut manned checkpoints at holy sites by one-fifth without harming safety, setting a precedent for malls and offices. stc projects visual-intelligence revenue to triple to USD 2.1 billion by 2032, implying continued budget diversion from human patrols. While high-risk facilities still employ guards, low-risk retail outlets are experimenting with camera-only overnight coverage. The substitution effect restrains growth in commodity static guarding even as premium armed services thrive.
Rising Labor Costs Driven by Wage Protection System
Electronic salary transfers under the Wage Protection System ended informal payment practices and elevated hourly wages above SAR 4,000 (USD 1,067) per month for Saudi guards. Summer heat rules capping outdoor shifts at five hours force firms to double up personnel to cover the same post, inflating payroll by roughly 10%. Operators unable to pass these increases to clients see margins compress. Stricter Ministry of Interior audits in 2025 suspended 14 licenses for wage and training violations, signaling that compliance investment is now non-negotiable. Higher labor costs therefore squeeze low-end providers and accelerate the shift toward technology-blended offerings.
*Our forecasts treat driver/restraint impacts as directional, not additive. The impact forecasts reflect baseline growth, mix effects, and variable interactions.
Segment Analysis
By End-User: Industrial Sites Accelerate Under Vision 2030
Industrial facilities are forecast to grow at an 8.53% CAGR, outpacing commercial venues despite the latter’s 42.72% revenue lead in 2025. Saudi Aramco’s Jafurah gas field contracts require armed guards at wellheads and pipelines, illustrating how higher asset values demand stronger deterrence. NEOM’s port, logistics, and data zones are designing guard ratios of one officer per 50 workers for general perimeters and one per 20 at high-value storage areas. Commercial hotspots such as Riyadh Season, shopping malls, and five-star hotels still employ large headcounts, but hybrid models replacing static posts with patrol-plus-camera setups curb their growth trajectory. Religious tourism adds lobbies, crowd marshals, and VIP escorts, yet most of these roles remain unarmed and therefore lower margin. Together, these dynamics ensure the KSA manned security market continues to rely on commercial contracts for scale while industrial clients fuel the steepest upward curve.
The industrial trend carries financial upside because contracts often bundle multiple services, including access control, fire watch, and emergency medical response, under multi-year frameworks. Firms that master ISO 27001 and ISO 45001 integration enjoy higher daily rates and lower churn. Conversely, commercial landlords renegotiate annually and remain price sensitive, prompting providers to differentiate with mobile patrols, visitor-analytics dashboards, and bilingual concierge guards. The dual-speed pattern lets operators balance predictable base revenue with fast-growing, high-skill opportunities.


By Service Type: Cash-In-Transit Leads Future Growth
Static guarding retained 55.43% of 2025 revenue, anchoring the KSA manned security market size in long-duration construction and office contracts. Yet cash-in-transit is expanding 9.48% a year as e-commerce escalates and central-bank rules oblige armed escorts for loads over SAR 100,000. Nesma Security’s 30% fleet expansion in 2025 exemplifies first-mover advantage in this niche. Mobile patrols appeal to chain retailers because a single crew can check several stores per shift, but they cannot replace permanent teams at sensitive sites. Event security for Formula 1, Riyadh Season, and Hajj delivers peak-hour pricing and adds resilience to annual revenue cycles, even though its share remains below 10%. Specialized K9 and VIP protection remain small yet attract premium fees that lift blended margins.
Looking forward, operators are overlaying AI route-optimization on cash trucks, biometric unlocking on cash vaults, and live GPS feeds for dispatchers, all of which require guard certification upgrades. Static guarding still dominates the KSA manned security market share today; however, unit economics increasingly favor services that fuse manpower with technology and command risk-priced premiums.
By Guard Classification: Armed Officers Gain Traction
Unarmed personnel filled 68.11% of posts in 2025 across malls, offices, and residential compounds where threat levels are considered low. Armed roles are growing at an 8.31% CAGR through 2031 as critical infrastructure, financial institutions, and cash-logistics operators meet regulatory mandates. Saudi Central Bank guidelines and Ministry of Interior firearm licensing demand ISO 9001 quality management plus annual proficiency tests, restricting supply and lifting hourly wages 20-30% above unarmed rates.
Data center clients including Microsoft, Oracle, and Humain stipulate armed teams for server-hall access, embedding a premium wage tier. Eastern Province petrochemical plants now deploy armed quick-reaction units able to respond within three minutes of an alert, reflecting the sector’s intolerance for downtime and theft. The Saudization decree narrows the qualified talent pool, further favoring incumbents with accredited training academies.
By Contract Duration: Event-Driven Assignments Scale Fast
Long-term contracts above one year accounted for 61.83% of 2025 engagements, particularly on multiyear GIGA projects. These deals stabilize cash flow but lock in pricing that may lag systemic wage inflation. Event-based work, from Formula 1 to Hajj, is projected to post an 8.49% CAGR through 2031 and already shows weekend revenue equaling six months of static post income.
Operators, therefore, cultivate flexible rosters and fast-onboarding pipelines to capture these spikes. Riyadh Season’s month-long festivities demonstrate how local knowledge and quick mobilization outcompete global brands. Meanwhile, GIGA project managers seek single-supplier frameworks covering both construction and operational phases, gradually shifting short jobs into evergreen renewals. This mixture of stable baseload and opportunistic peaks keeps the KSA manned security market resilient across business cycles.
Geography Analysis
Riyadh generated about 35% of 2025 revenue as government ministries, corporate headquarters, and entertainment venues concentrated demand. The municipality’s 1,600 smart cameras trimmed some static posts, yet the USD 50 billion King Salman Park and New Murabba downtown ensure a robust pipeline of perimeter jobs. Security providers increasingly combine AI analytics with foot patrols to satisfy insurance requirements without ballooning headcount.
Jeddah and the wider Western Province contributed roughly 30% thanks to both Umrah pilgrim flows, which hit 27.4 million in 2025, and the Red Sea Project’s 28,000 km² tourism build-out.[3]Ministry of Hajj and Umrah, “27.4 Million Umrah Pilgrims Recorded in 2025,” HAJ.GOV.SA Crowd-management protocols mandate multilingual guards and AI-assisted monitoring, pushing firms to cross-train staff in customer relations and analytics console operation. Seasonal spikes during Hajj test labor scalability and highlight the margin upside of short contracts.
The Eastern Province delivered close to 25% of turnover, with Dammam data centers and Saudi Aramco sites requiring armed, ISO-certified personnel. Here, guard ratios skew toward perimeter vehicles and rapid response because facilities often exceed USD 1 billion in replacement value. NEOM, Qiddiya, and other Vision 2030 clusters made up the remaining 10% in 2026 and are projected to reach 15% by 2031 as they transition from construction to operations. Their remote footprints make onsite human presence indispensable, securing multi-year revenue streams for compliant providers.
Competitive Landscape
Allied Universal G4S, Securitas AB, and AMNCO jointly held under 30% of 2025 revenue, giving the KSA manned security market a moderate concentration profile. Dozens of regional firms such as Arabian Protective Services Group, Al Majal Al Arabi, Nesma Security, and Sharaf Din Security Services compete on price, Saudization compliance, and local relationships. Securitas AB’s early investment in data-center guard certification won a USD 12 million annual contract from Microsoft in 2026, illustrating the payoff from specialized training.
Technology adoption is a key differentiator. Al Majal Al Arabi, in partnership with G4S, deployed facial-recognition gates at government offices in 2025, cutting guard headcount by 10% while retaining contract value. Operators offering AI-camera integration, biometric access control, and GPS-backed mobile patrols command 15-20% price premiums over labor-only bidders.
Grey-market suppliers still undercut compliant firms by roughly 20% in secondary cities, yet intensified Ministry of Interior audits suspended 14 licenses in September 2025, signaling tougher enforcement. Smaller uncertified shops face existential risk as banks, data centers, and petrochemical firms require ISO 27001 and ISO 9001 credentials. Consolidation is expected to raise the top-five combined share above 35% by 2028, though niche specialists will survive in VIP protection and K9 detection.
KSA Manned Security Industry Leaders
Allied Universal G4S
Arabian Protective Services Group
Securitas AB
The Arab Security and Safety Services Company (AMNCO)
ETH Security Solutions Company LLC
- *Disclaimer: Major Players sorted in no particular order

Recent Industry Developments
- February 2026: Saudi Data and Artificial Intelligence Authority expanded Baseer to 3,200 cameras across Riyadh, Jeddah, and Dammam, enabling incident detection projected to cut municipal guard posts 15% by year-end.
- January 2026: Microsoft began operations at its Riyadh and Jeddah data centers, with a USD 12 million annual manned-security contract led by Securitas AB requiring ISO 27001-certified, armed guards.
- December 2025: Public Investment Fund confirmed USD 6 billion for digital infrastructure to 2030, expected to create 2,000-3,000 guard jobs by 2028.
- October 2025: Nesma Security boosted its cash-in-transit fleet by 30%, adding armored vehicles and K9 units for Western Province retailers.


KSA Manned Security Market Report Scope
The KSA Manned Security Market Report is Segmented by End-user (Commercial, Industrial, Government and Institutional, Residential), Service Type (Static Guarding, Mobile Patrol, Event and Crowd-Control Security, Cash-in-Transit and Valuables Logistics, K9 and Specialised Protection), Guard Classification (Unarmed Guards, Armed Guards), and Contract Duration (Long-Term Above 12 Months, Short-Term and Event-Based). The Market Forecasts are Provided in Terms of Value (USD).
| Commercial |
| Industrial |
| Government and Institutional |
| Residential |
| Static Guarding |
| Mobile Patrol |
| Event, Crowd-Control Security |
| Cash-in-Transit, Valuables Logistics |
| K9 and Specialised Protection |
| Unarmed Guards |
| Armed Guards |
| Long-Term (Above 12 Months) |
| Short-Term, Event-Based |
| By End-user | Commercial |
| Industrial | |
| Government and Institutional | |
| Residential | |
| By Service Type | Static Guarding |
| Mobile Patrol | |
| Event, Crowd-Control Security | |
| Cash-in-Transit, Valuables Logistics | |
| K9 and Specialised Protection | |
| By Guard Classification | Unarmed Guards |
| Armed Guards | |
| By Contract Duration | Long-Term (Above 12 Months) |
| Short-Term, Event-Based |


Key Questions Answered in the Report
What is the forecast value of the KSA manned security market by 2031?
It is projected to reach USD 1.67 billion by 2031 based on an 8.13% CAGR from 2026-2031.
Which segment is growing fastest within the sector?
Cash-in-transit services, supported by stricter central-bank regulations and rising e-commerce volumes, are advancing at 9.48% a year.
How is Saudization affecting security providers?
A 100% Saudi staffing mandate since Feb 2025 has narrowed labor supply, lifted wages, and favored firms with in-house training academies and compliance systems.
Why are armed guards gaining share?
Critical infrastructure sites, data centers, and cash-logistics operators must meet regulatory requirements that specify armed, ISO-certified personnel.
What technology trends could reduce guard headcount?
AI-enabled video analytics on platforms such as Baseer and retail smart-cameras are substituting for static posts in low-risk environments, especially in major cities.
Page last updated on:


