
Kenya Used Car Market Size and Share
Market Overview
| Study Period | 2020 - 2031 |
|---|---|
| Forecast Data Period | 2026 - 2031 |
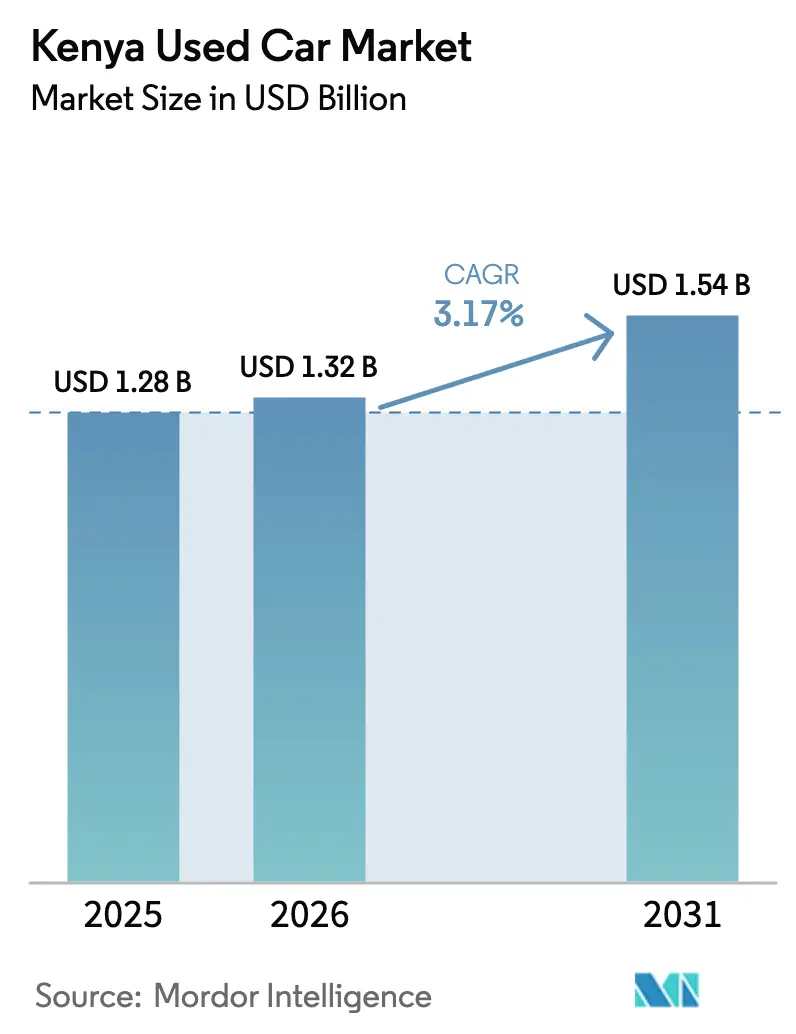
| Base Year Market Size (2025) | USD 1.28 Billion |
| Market Size (2026) | USD 1.32 Billion |
| Market Size (2031) | USD 1.54 Billion |
| Growth Rate (2026 - 2031) | 3.17 % |
| Market Concentration | Medium |
Major Players *Disclaimer: Major Players sorted in no particular order Image © Mordor Intelligence. Reuse requires attribution under CC BY 4.0. | |
Kenya Used Car Market Analysis by Mordor Intelligence
The Kenya used car market size is expected to grow from USD 1.28 billion in 2025 to USD 1.32 billion in 2026 and is forecast to reach USD 1.54 billion by 2031 at 3.17% CAGR over 2026-2031. Consumer migration to online platforms, the prominence of Japanese right-hand-drive imports, and regulatory age limits shape demand patterns and dealer strategies. While traditional informal dealerships still dominate vehicle sales, organized channels are steadily gaining ground, driven by better financing options and stronger regulatory compliance that boost buyer confidence. Interest in hybrid and electric vehicles is growing, supported by government targets and a rising number of registered EVs. Japan continues to be the leading source of vehicle imports, maintaining supply despite stricter age limits introduced by Kenya. Stable currency conditions help dealers manage costs and plan inventory more effectively, especially in markets heavily reliant on imports.
Key Report Takeaways
- By vehicle type, hatchbacks captured 42.36% of the Kenyan used car market share in 2025, whereas SUVs and MPVs marked the fastest growth at 4.44% CAGR through 2031.
- By vendor type, unorganized dealers held 62.63% of the Kenya used car market share in 2025, while organized channels recorded the highest projected growth at 5.04% CAGR through 2031.
- By fuel type, petrol models led with 72.71% share of the Kenya used car market size in 2025; hybrid and electric vehicles are advancing at an 8.61% CAGR to 2031.
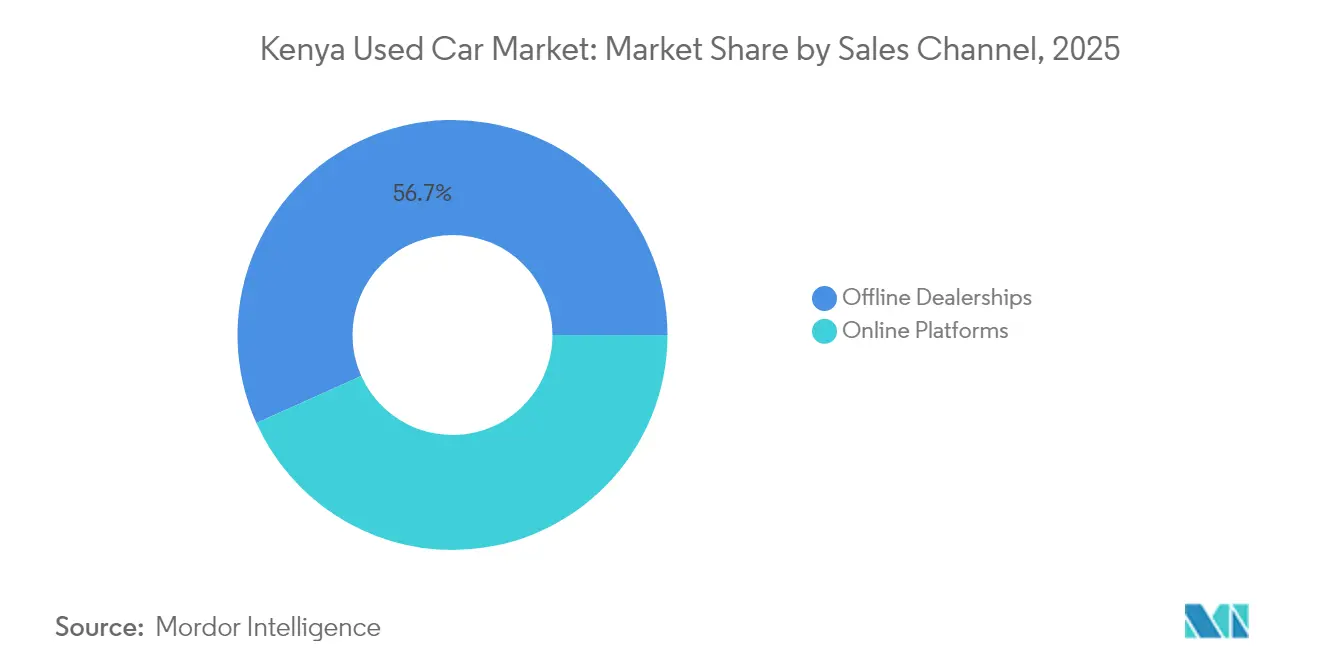
- By sales channel, offline dealerships retained a 56.72% share in 2025, yet online platforms are set to rise at an 8.14% CAGR through 2031.
- By vehicle age, the 5–8-year bracket commanded 50.73% of the Kenya used car market size in 2025, yet the 0–3-year segment is projected to expand at a 5.55% CAGR between 2026 and 2031.
Note: Market size and forecast figures in this report are generated using Mordor Intelligence’s proprietary estimation framework, updated with the latest available data and insights as of 2026.
Projections can easily extend beyond country and regional trends as they are defined by movement across the full international system. Mordor Intelligence's worldwide used car market outlook captures this forward trajectory.
Kenya Used Car Market Trends and Insights
Drivers Impact Analysis*
| Driver | (~) % Impact on CAGR Forecast | Geographic Relevance | Impact Timeline |
|---|---|---|---|
| Middle-Class Preference for Affordable Second-Hand Imports | +0.8% | Nairobi, Mombasa, Kisumu | Medium term (2–4 years) |
| Online B2C Platforms & Fintech Car Loans Expanding Access | +0.6% | Urban centers, secondary cities | Short term (≤ 2 years) |
| Ex-Japan RHD Hybrids Lowering Ownership Costs | +0.5% | National, early adoption in cities | Medium term (2–4 years) |
| Ride-Hailing and Delivery Fleets Driving Low-CAPEX Demand | +0.4% | Nairobi, Mombasa, Nakuru, Eldoret | Short term (≤ 2 years) |
| Refurbished Ex-Corporate Fleets Entering from East Africa | +0.3% | Regional hub distribution | Long term (≥ 4 years) |
| Duty-Free Re-Export via Mombasa FTZ Boosting Trade Flow | +0.2% | Coastal cross-border trade | Long term (≥ 4 years) |
| Source: Mordor Intelligence | |||
Price-Sensitive Middle Class Favoring Second-Hand Imports
New vehicle registrations declined as more buyers turned to used cars that better match tighter household budgets. Inflation has reduced disposable income, making reliable pre-owned imports—mainly from Japan—an attractive alternative. Although new vehicles carry high tax burdens, much of this cost is absorbed before they enter the used market, improving affordability. These dynamics are reshaping consumer preferences and reinforcing the role of used vehicles in meeting mobility needs. Monthly motor insurance plans introduced by CIC Insurance lowered upfront ownership barriers, broadening accessibility for middle-income earners. The result is consistent transaction volume for second-hand cars even as new sales retract.
Expansion of Ride-Hailing and Delivery Fleets Demanding Low-CAPEX Vehicles
Uber counts 363,000 active riders in Kenya, creating a steady need for cost-efficient, durable vehicles[1]“2025 Africa Fact Sheet,”, Uber Technologies, uber.com. Fare adjustments of 10–20% in 2024 improved driver margins, encouraging vehicle acquisition for platform work. NTSA’s commission cap at 18% further protects take-home pay and stimulates fleet growth. Age rules of 2009+ in Nairobi fit the sweet spot for imported 8–15-year models, keeping older units relevant. Parallel e-commerce expansion fuels demand for pickups and vans, linking logistics growth to the Kenya used car market.
Growing Supply of Refurbished Ex-Corporate Fleets from East Africa
Large organizations across East Africa retire fleets sooner to meet ESG goals, releasing well-maintained stock into regional auctions centered in Kenya. Importers refurbish these units and remarket them with limited mileage history, appealing to buyers seeking reliable alternatives to high-mileage Japanese imports. Kenya’s status as a valuation hub means refurbishers source spares quickly and in bulk, compressing turnaround times. The trend feeds a pipeline of quality inventory that differentiates organized dealers from informal rivals.
Duty-Free Re-Export Window via Mombasa Free-Trade Zone
Three new Export Processing Zones at Bonje, Bombululu, and Mavoko, declared in February 2023, grant duty-free privileges that importers leverage to stage vehicles for re-export to Uganda and Tanzania[2]“Kenya EPZ Expansion,”, UNCTAD, unctad.org. The mechanism lowers total landed cost for onward buyers and positions Kenya as East Africa’s clearing center. While a modest contributor, the window diversifies revenue sources for dealers facing domestic age-limit constraints, bolstering long-term growth prospects for the Kenyan used car market.
Restraints Impact Analysis*
| Restraint | (~) % Impact on CAGR Forecast | Geographic Relevance | Impact Timeline |
|---|---|---|---|
| Proposed Up to 5-Year Age Limit on Imports | -0.7% | National | Short term (≤ 2 years) |
| Stricter Emissions Tests and Euro-4 Enforcement | -0.5% | National, Mombasa port focus | Medium term (2–4 years) |
| Currency Depreciation Raising CIF Vehicle Costs | -0.3% | Import-dependent zones | Short term (≤ 2 years) |
| Low-Cost Chinese CKD Assembly Undercutting Used-Car Demand | -0.2% | Urban markets | Long term (≥ 4 years) |
| Source: Mordor Intelligence | |||
Tougher Emissions Tests & Impending Euro-4 Standard Enforcement
Upcoming alignment with regional environmental standards will restrict the import of older, less efficient engines, increase inspection requirements, and extend clearance times at key entry points like Mombasa port. Retrofitting borderline vehicles to meet compliance may become costly, making some models unaffordable. However, vehicles that meet the new standards will likely retain higher resale value, which could lead to a market shift favoring those with verified environmental credentials.
Low-Cost Chinese CKD Assembly Eroding Used-Car Appeal
In collaboration with Toyota-linked dealerships, BYD has made a significant market entry by launching several models. These offerings come with competitive advantages, including attractive warranties and financing options. Despite withdrawing local tax incentives for assembled vehicles, BYD's economies of scale might still uphold its pricing edge. As new electric cars become available at prices comparable to used imports, buyer preferences will likely shift. This is particularly true for those emphasizing long-term reliability, which could transform demand within crucial segments of the used car market.
*Our forecasts treat driver/restraint impacts as directional, not additive. The impact forecasts reflect baseline growth, mix effects, and variable interactions.
Segment Analysis
By Vehicle Type: Hatchbacks Lead Despite SUV Momentum
Hatchbacks represented 42.36% of the Kenyan used car market in 2025, underscored by Toyota Vitz and Honda Fit models that align with urban parking constraints and lower running costs. SUVs and MPVs show a 4.44% CAGR to 2031 as rising disposable income and aspirational preferences lift demand for perceived safety and versatility. Sedans retain appeal among corporate fleets that favor formal aesthetics, while light commercial vehicle uptake tracks agricultural output and e-commerce distribution demand.
Light commercial vehicles, led by Toyota Hilux and Isuzu D-Max, benefit from parts availability and robust chassis suited to mixed-terrain logistics routes. Chinese entrants offer lower sticker prices but face skepticism over resale value and service coverage. Continued infrastructure upgrades widen delivery routes, translating into incremental demand for pickups and vans throughout the Kenyan used car market.




By Vendor Type: Unorganized Dominance Faces Digital Disruption
The unorganized segment held a 62.63% share in 2025, leveraging minimal overheads and direct sourcing links to Japan. However, the organized dealers’ 5.04% forecast CAGR reflects gains from warranty programs, structured financing, and compliance advantages that appeal to risk-averse buyers. Withholding tax obligations on digital platforms force greater transparency, nudging informal operators either to formalize or lose online visibility.
Banks regularly prefer collateral from registered dealers, channeling credit toward organized players and reinforcing their inventory purchasing power. Meanwhile, unorganized dealers retain agility in price negotiation and can source niche models fast, keeping them relevant in the Kenyan used car market even as digital disruption mounts.
By Fuel Type: Petrol Dominance Meets Hybrid Acceleration
Petrol units held 72.71% of the 2025 volume, supported by a wide refueling infrastructure and simple maintenance. Hybrid and electric vehicles, registering an 8.61% CAGR, gain impetus from the Draft Electric Mobility Policy’s green plates and prospective duty incentives. Diesel remains essential for long-haul and high-torque needs but faces public perception challenges over emissions.
Toyota Prius and Honda Insight imports enjoy mature aftermarket support, minimizing parts scarcity risk. The Kenya used car market size for hybrids is projected to grow alongside charging infrastructure rollouts and sustained fuel price volatility that magnifies operational savings.
By Sales Channel: Digital Platforms Challenge Traditional Dealerships
Offline dealerships kept a 56.72% share in 2025 because many buyers value physical inspection and immediate vehicle release. Yet online channels, expanding at 8.14% CAGR, aggregate multi-dealer inventories and integrate financing that compresses consumer search costs. NTSA’s digital number plate issuance, resumed in May 2025, reduces fraud risk and dovetails with online verification workflows.
Dealers are experimenting with hybrid models where listings originate online, but final transactions conclude in showrooms, preserving the experiential component. The Kenya used car market benefits as heightened transparency limits price distortions and broadens geographic reach for both buyers and sellers.
By Vehicle Age: Mid-Age Preference Shifts Toward Newer Models
Vehicles aged 5–8 years held 50.73% of 2025 transactions, offering an equilibrium between depreciation savings and acceptable reliability. The 0–3-year cohort posts a 5.55% CAGR as eight-year age caps force importers upmarket and banks offer longer tenures on newer collateral. Vehicles above eight years old lose import eligibility yet continue circulating domestically, reinforcing multilayer resale activity inside the Kenyan used car market.
Ride-hailing standards align closely with 8—to 15-year-old vehicles, sustaining demand even as import restrictions tighten. Financing structures increasingly link loan term to vehicle age, nudging consumers toward younger assets and supporting residual value retention for lenders.
Geography Analysis
Kenya is East Africa’s principal vehicle gateway, with Mombasa Port handling the lion’s share of right-hand-drive Japanese imports. Coastal counties in Kenya's used car market benefit from direct access to clearing services and trade-zone incentives that trim overall landed costs. Nairobi, the nation’s economic hub, concentrates high-frequency retail turnover and hosts the largest aggregation of ride-hailing demand, driving continuous replenishment of mid-age vehicle stock.
Inland regions like Eldoret and Nakuru display a growing appetite as infrastructure upgrades improve connectivity, enabling dealers to extend supply chains beyond traditional coastal-to-capital corridors. Uganda and Tanzania depend on Kenya for re-exports, though varying age-limit rules create differential pricing windows. EPZ facilities at Bonje and Bombululu allow importers to warehouse units duty-free before distribution, amplifying Kenya’s role as a regional distribution center.
Ethiopia’s budding assembly capacity portends future supply competition, yet Kenya’s legacy of aftermarket expertise, financial-service integration, and regulatory transparency supports sustained dominance. Mobile money and branchless banking facilitate cross-border transactions, shortening settlement cycles for Ugandan and Tanzanian buyers purchasing through Kenyan online platforms. This regional pull adds a buffer to domestic cyclical swings and strengthens long-run stability across the Kenyan used car market.
The used car market is analyzed by Mordor Intelligence across multiple other geographies, with in-depth regional assessments available for Africa. This is complemented by country-specific insights for South Africa, Egypt, Brazil, Bangladesh, Kuwait, Canada, Qatar, and Oman, reflecting various localized market behavior and policy environments' coverage.
Regulatory Landscape
Kenya regulates used-vehicle imports through Kenya Bureau of Standards (KEBS) requirements and customs processes administered by the Kenya Revenue Authority (KRA). From January 1, 2026, imported used vehicles must meet the eight-year age limit (2019 or newer) and comply with KS 1515:2000, with right-hand-drive (RHD) configuration remaining a core condition for import eligibility.
Compliance is enforced through mandatory pre-shipment inspection (PSI) by KEBS-appointed agents that issue a Certificate of Roadworthiness (CoR), while KRA applies the main border taxes and levies, including import duty (25%), VAT (16%), Import Declaration Fee (3.5%), and Railway Development Levy (2%). These rules raise the need for accurate documentation and inspection readiness, particularly for clearance via Mombasa-linked logistics corridors.
Value Chain Analysis
Kenya's used-car value chain begins with overseas sourcing, predominantly Japan for RHD units, and proceeds through pre-export compliance via KEBS-appointed PSI agents that issue the Certificate of Roadworthiness. Vehicles then enter customs clearance and tax payments through KRA processes, followed by port and inland logistics that move units into refurbishment, valuation, and retail distribution. Registration and road-use compliance are tied to national transport governance structures (including NTSA), which affect buyer confidence and clearance-to-sale turnaround times.
Downstream, the chain differentiates between unorganized dealers and organized channels that combine assurance and financing. Certified pre-owned programs such as Automark (CFAO Mobility Kenya) use structured inspection and reconditioning to standardize quality, while digital marketplaces such as Autochek link listings with financing and after-sales support, tightening the feedback loop between retail demand and inventory procurement. Inspection, assessment, and maintenance service providers and industry groups, including the Kenya Auto Bazaar Association and Motor Assessors Association of Kenya, help keep imported vehicles compliant and roadworthy across multiple resale cycles.
Competitive Landscape
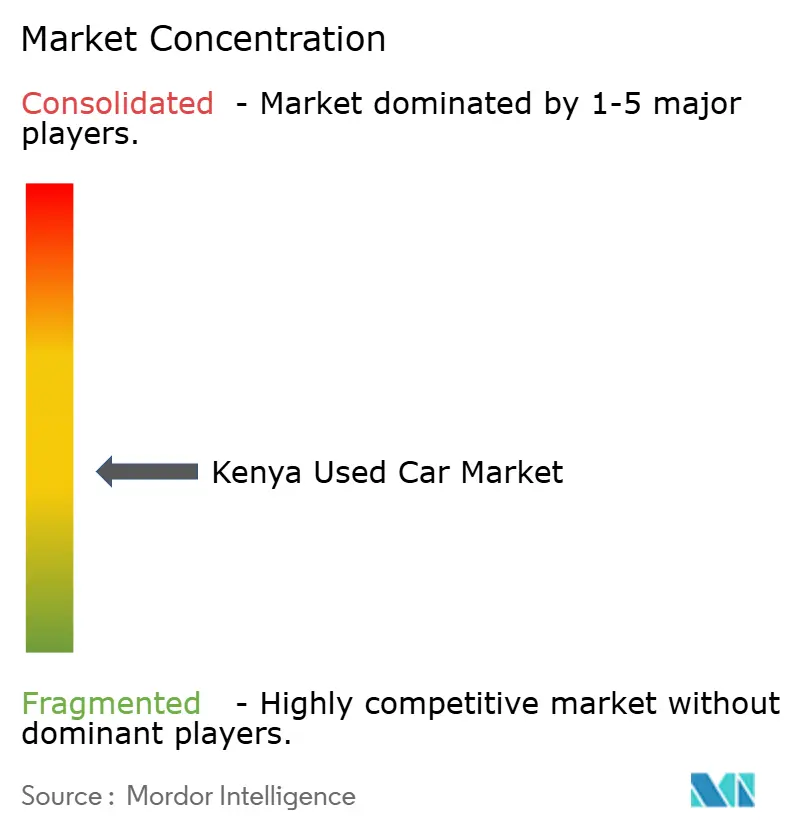
Market competition remains fragmented. Autochek’s consolidation of Cheki Kenya illustrates digital-scale advantages, including AI-based pricing tools that inform buyer budgets and dealer floor-planning strategies. The January 2025 shutdown of CMC Motors Group reveals vulnerability among legacy distributors unable to pivot quickly to used-car-oriented models or meet compliance costs.
Organized players emphasize warranties, refurbishment standards, and document automation to differentiate themselves. Unorganized importers lean on price under-cutting and quick turnover, but face intensifying scrutiny under KEBS validation and NTSA plate digitization. BYD’s partnership with Toyota-affiliated dealerships introduces a fresh competitor that can offer new EVs at prices approaching late-model hybrids, potentially reshaping value comparisons for urban buyers.
Financing alliances, such as KCB’s extended-tenor loans and NCBA’s mobile credit scoring, increasingly dictate dealership throughput. Digital marketing via social media and automotive classifieds enhances lead generation efficiency, while aftermarket service bundling sustains revenue post-sale. Overall, strategic positioning hinges on compliance prowess, financing integration, and digital visibility across the Kenyan used car market.
Kenya Used Car Industry Leaders
Gigi Motors Limited
Toyota Kenya (Automark)
Jiji Kenya
Autochek Africa
Peach Cars
- *Disclaimer: Major Players sorted in no particular order

Market Opportunities and Future Outlook
The January 2026 tightening of the import rule, limited to 2019 or newer under the eight-year cap, creates room for organized dealers and online platforms that can reliably source newer units, absorb compliance costs, and demonstrate inspection history. Certified pre-owned propositions provide a workable differentiation route, with programs such as Automark applying standardized checks (including a multi-point inspection approach) and structured trade-in flows that reduce buyer uncertainty versus informal lots.
Digitization and data-led retailing also extend into adjacent services tied to used-car transactions, especially financing, warranties, and pricing transparency. Autochek's platform model shows how marketplaces are combining sourcing, credit enablement, and after-sales support into a single workflow, while AI-based pricing tools help dealers manage stock turns and budget planning for consumers. As enforcement centers on KEBS inspection readiness and KRA customs compliance, document verification automation, vehicle-history presentation, and inspection coordination become practical levers to scale online-to-offline conversions and broaden organized-channel reach beyond major urban centers.
Recent Industry Developments
- July 2026: CFAO Mobility Kenya commissioned construction of a Sh500 million multi-brand showroom in Kisumu to expand Automark operations and introduce trade-in services in the Lake region. The launch broadens regional showroom presence for used-car channels and strengthens organized-channel competitiveness in Kenya's market.
- June 2026: CFAO Mobility Kenya completed a Sh2.4 billion investment to acquire a 99.4% stake in Kenya Vehicle Manufacturers and commissioned a Toyota Hiace assembly line at Thika. The move brings local vehicle assembly and market control, reducing import dependence and boosting supply-chain efficiency in the used-car market.
- June 2026: CFAO Mobility Kenya launched the Toyota bZ4X, the company's first fully electric SUV, in Nairobi. The introduction accelerates EV awareness and adoption in Kenya, influencing used-car demand and green financing considerations.


Research Methodology Framework and Report Scope
Market Definition and Coverage
This market covers the value of used passenger and light commercial vehicles sold within Kenya through offline and online channels, including dealer and individual-led transactions where a price is paid for a previously owned vehicle.
Scope exclusions: We exclude new vehicle sales, motorcycles, heavy trucks and buses, vehicle parts, repair services, and insurance or financing fees that are not part of the vehicle selling price.
Segmentation Overview
- By Vehicle Type
- Hatchbacks
- Sedans
- Sport Utility Vehicles and Multi-Purpose Vehicles
- Light Commercial Vehicles (Pick-ups and Vans)
- By Vendor Type
- Organized
- Unorganized
- By Fuel Type
- Petrol
- Diesel
- Hybrid & Electric
- By Sales Channel
- Online Platforms
- Offline Dealerships
- By Vehicle Age
- 0-3 Years
- 3-5 Years
- 5-8 Years
- Above 8 Years
Data Sources, Market Sizing, and Validation
Desk Research
Desk work starts with building a clean picture of used vehicle supply into Kenya and the local demand signals that shape resale value. For this, we refer to public datasets and official releases, including Kenya Revenue Authority and Kenya National Bureau of Statistics updates, Central Bank of Kenya macro series, Kenya Bureau of Standards import and compliance notes, and international trade statistics portals that show vehicle import categories.
After that, we connect the data to what the market actually trades at by using sources such as industry association commentary, reputable press reporting on pricing and import trends, and company filings or investor decks from ecosystem participants. Where gaps exist, paid subscriptions for company financials and intelligence, news and financials, and shipment-level trade tracking are used to cross-check directionally consistent numbers. The desk source list mentioned here is illustrative only, and many other public and paid references were also used to collect, validate, and clarify data points.
Primary Interviews and Surveys
We interview Kenyan dealers, importers, marketplace specialists, financiers, fleet buyers, and regulators. Their input helps assess import volumes, retail prices, margins, channel shifts, and informal activity that is not visible in published records. Conflicting responses are checked against secondary evidence before assumptions are finalized.
Distribution of primary research fieldwork respondents
| Company type | Respondent position |
|---|---|
| Top tier: 25% | CXOs: 15% |
| Mid tier: 55% | Functional/Unit leaders: 35% |
| Smaller Players: 20% | Managers: 50% |
Market-Sizing & Forecasting
Sizing is built mainly from a top-down reconstruction that links Kenya vehicle inflow and resale turnover into an annual value pool. In practice, imports by vehicle category, typical age bands under the local import rule, and observed resale activity are converted into volumes, which are then paired with realistic price levels to reach total market value.
To keep the model grounded, we corroborate outputs with selective bottom-up checks, such as dealer and broker channel checks on monthly unit flow, sampled listing prices adjusted for negotiation discounts, and auction or trade-in value references where available. Inputs that matter most include the Kenya shilling to US dollar movement (because many units are import priced), landed-cost components like duties and fees, the imported vehicle age mix, demand shifts between SUVs/MPVs and smaller cars, and the online share of transactions that affects price transparency.
For forecasting, we use scenario analysis supported by simple time-series smoothing, since policy changes, exchange rates, and import affordability can swing volumes quickly. When a bottom-up signal is missing for a niche category, we fill gaps using observed proxy mixes from adjacent vehicle types and then re-test the impact with interview feedback before finalizing.
Data Validation & Update Cycle
Model results are checked against independent signals so totals do not drift away from what the market can realistically absorb, including import value trends, currency movements, and reported pricing changes in mainstream sales channels. If a segment grows too fast compared to these signals, drivers are re-opened and assumptions are reworked before sign-off.
A multi-step review is followed internally, where calculations, unit conversions, and year alignment are rechecked, and then the logic is tested again with follow-up calls when a variance looks material. Reports are refreshed annually, and interim updates are done when major events occur, such as policy changes on vehicle age limits, duty revisions, or sharp exchange-rate shifts. Right before delivery, a final review pass is completed so clients receive the most current view available.
Mordor Intelligence's Kenya Used Car Market Sizing Compared With Other Published Estimates
Published market values for used cars in Kenya can look different because not everyone counts the same transaction set, and pricing assumptions vary a lot in an import-led market. We also see year selection differences, where some sources report a past year while others share a forward year based on expected currency and duty conditions.
By tracking import value signals, resale price bands, and dealer turn rates, Mordor Intelligence keeps the model tied to vehicles actually transacting in Kenya, before totals are converted to USD using consistent timing assumptions. Key gaps usually come from whether informal peer-to-peer sales are included, how online listing prices are treated versus realized selling prices, and whether estimates blend in fees like financing charges or focus only on the vehicle price.
Benchmark comparison
| Source | Market Size | Gaps in Research Methodology |
|---|---|---|
| Mordor Intelligence | USD 1.28 B (2025) | |
| Trade Journal A | USD 1.23 B (2024) | Uses a prior-year snapshot and appears to lean on advertised prices and anecdotal deal sizes, which can understate value when FX-driven price increases show up later in the year. |
| Regional Consultancy B | USD 2.00 B (2025) | Likely blends a wider vehicle set and may treat gross import spend or broader automotive resale activity as used-car value, which inflates totals if fees and non-vehicle components are not removed. |
The comparison shows that the spread is mainly explained by what is counted as a used-car sale and how prices are normalized when the currency is volatile. Our approach stays repeatable by tying value to measurable import and transaction signals, and then stress-testing the totals with practical channel feedback before final numbers are locked.


Key Questions Answered in the Report
What is the forecast value of the kenya used car market by 2031?
The kenya used car market is projected to reach USD 1.54 billion by 2031.
Which vehicle age bracket is growing fastest in Kenya’s second-hand sector?
Units aged 0–3 years are forecast to expand at 5.55% CAGR between 2026 and 2031 due to tighter import age rules and improved financing.
How dominant are online platforms in Kenya’s used vehicle sales?
Online channels held 43.28% of 2025 transactions and are growing at 8.14% CAGR as buyers seek transparency and integrated financing.
How does the eight-year import age limit impact supply?
The January 2025 rule removes the oldest inventory categories, raising average vehicle prices and benefiting organized dealers able to finance newer stock.
What recent policy supports EV adoption in Kenya?
The Draft Electric Mobility Policy issued in March 2025 introduces green number plates and targets a 5% EV share, signaling favorable treatment for electric imports.
Page last updated on:





