Finland Used Car Market Size and Share
Market Overview
| Study Period | 2020 - 2031 |
|---|---|
| Forecast Data Period | 2026 - 2031 |
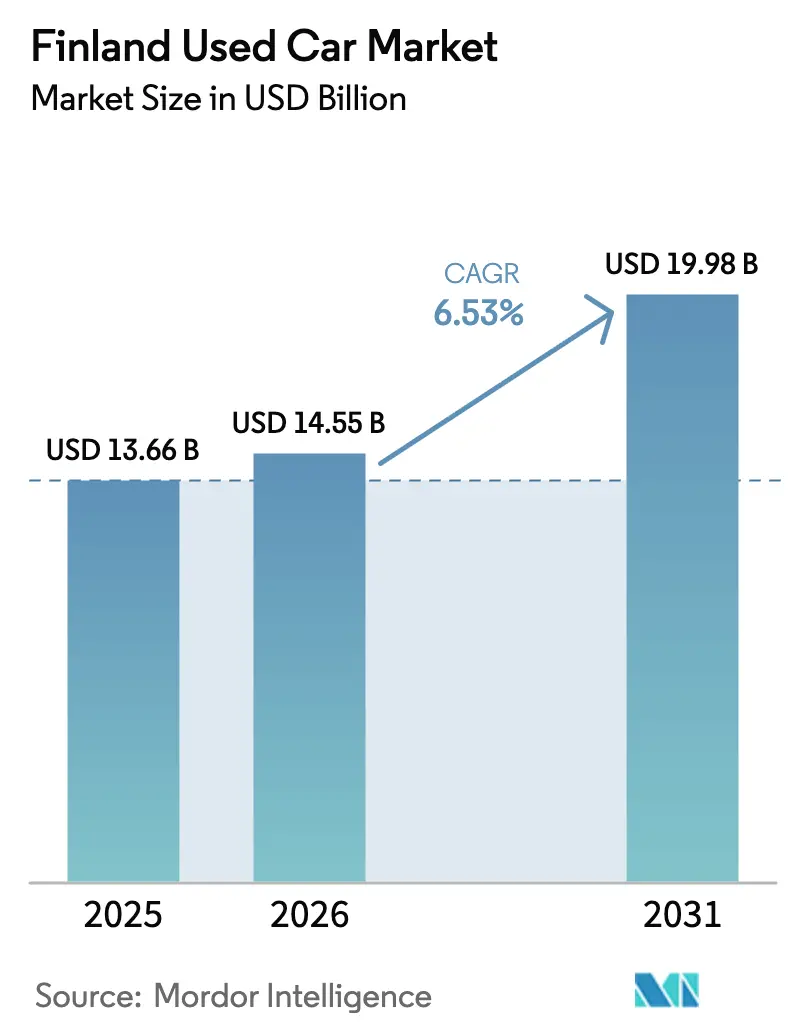
| Base Year Market Size (2025) | USD 13.66 Billion |
| Market Size (2026) | USD 14.55 Billion |
| Market Size (2031) | USD 19.98 Billion |
| Growth Rate (2026 - 2031) | 6.53% CAGR |
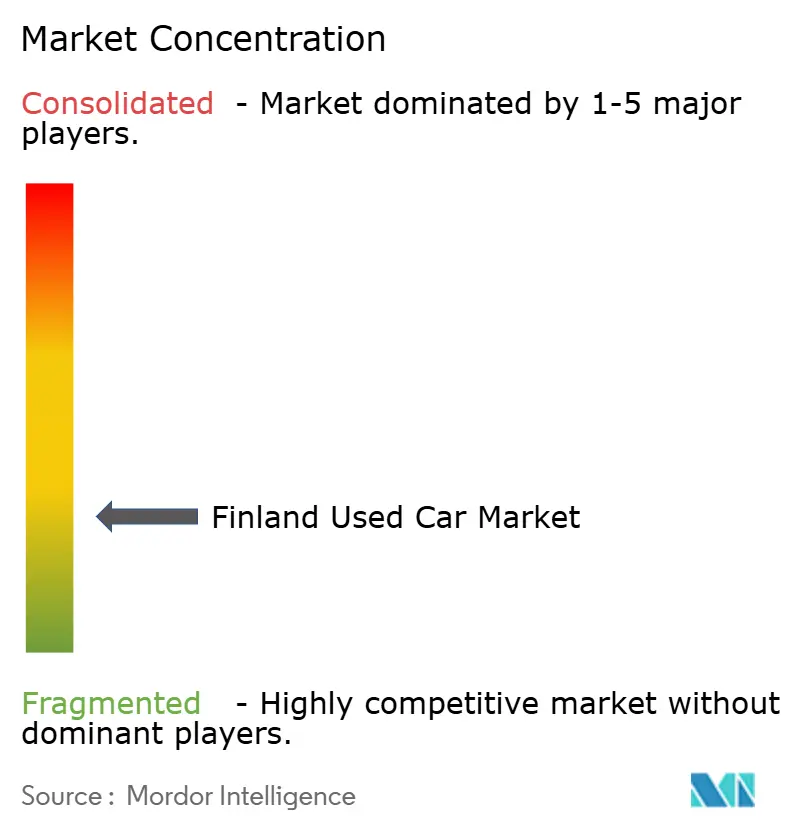
| Market Concentration | Low |
Major Players *Disclaimer: Major Players sorted in no particular order Image © Mordor Intelligence. Reuse requires attribution under CC BY 4.0. | |
Finland Used Car Market Analysis by Mordor Intelligence
The Finland used car market size is expected to grow from USD 13.66 billion in 2025 to USD 14.55 billion in 2026 and is forecast to reach USD 19.98 billion by 2031 at 6.53% CAGR over 2026-2031. This growth reflects sustained demand for cost-efficient mobility, rapid digital retail expansion, and a widening supply of battery-electric and hybrid vehicles that align with the nation’s 2030 electrification target. Organized retailers benefit from rising consumer expectations for certified quality, transparent pricing, and integrated financing, pushing consolidation in a still-fragmented competitive arena. Premiumization is evident in stronger uptake of newer vehicles, SUVs, and higher-price bands, while residual values for “future-proof” ICE models with hybrid readiness remain resilient. Inventory sourcing from neighboring EU states supports supply depth and model variety despite persistent new-car delivery delays that steer shoppers toward the secondary channel.
Key Report Takeaways
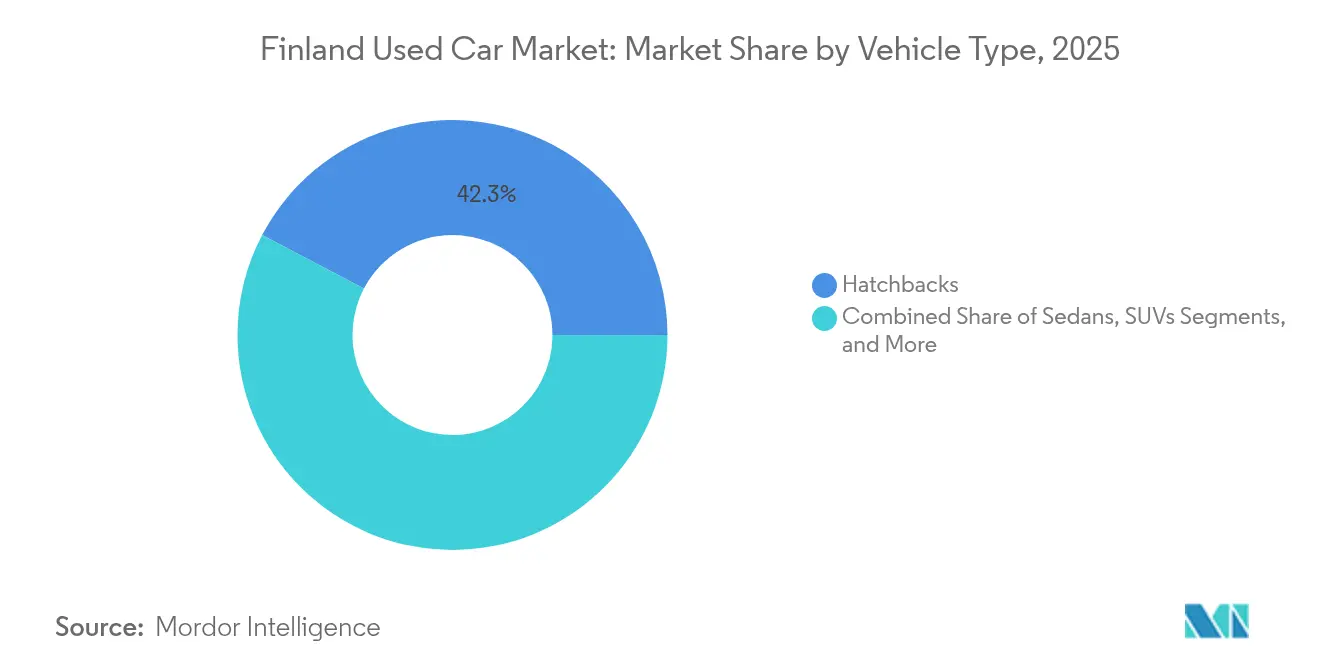
- By vehicle type, hatchbacks led the Finland used car market with 42.31% revenue share in 2025, while SUVs are projected to expand at a 9.05% CAGR through 2031.
- By vendor type, the unorganized segment held 54.22% of Finland's used car market share in 2025; organized channels are expected to record the fastest CAGR, at 8.67% by 2031.
- By fuel type, petrol cars accounted for 48.95% of the Finland used car market size in 2025, whereas battery-electric vehicles advanced at 11.78% CAGR over the same horizon.
- By sales channel, online platforms captured a 64.12% share of the Finland used car market in 2025 and are expected to grow with a 9.19% CAGR through 2031.
- By vehicle age, cars older than 12 hold a 41.32% share in the Finland used car market in 2025; 0-2-year units post the highest 9.96% CAGR to 2031.
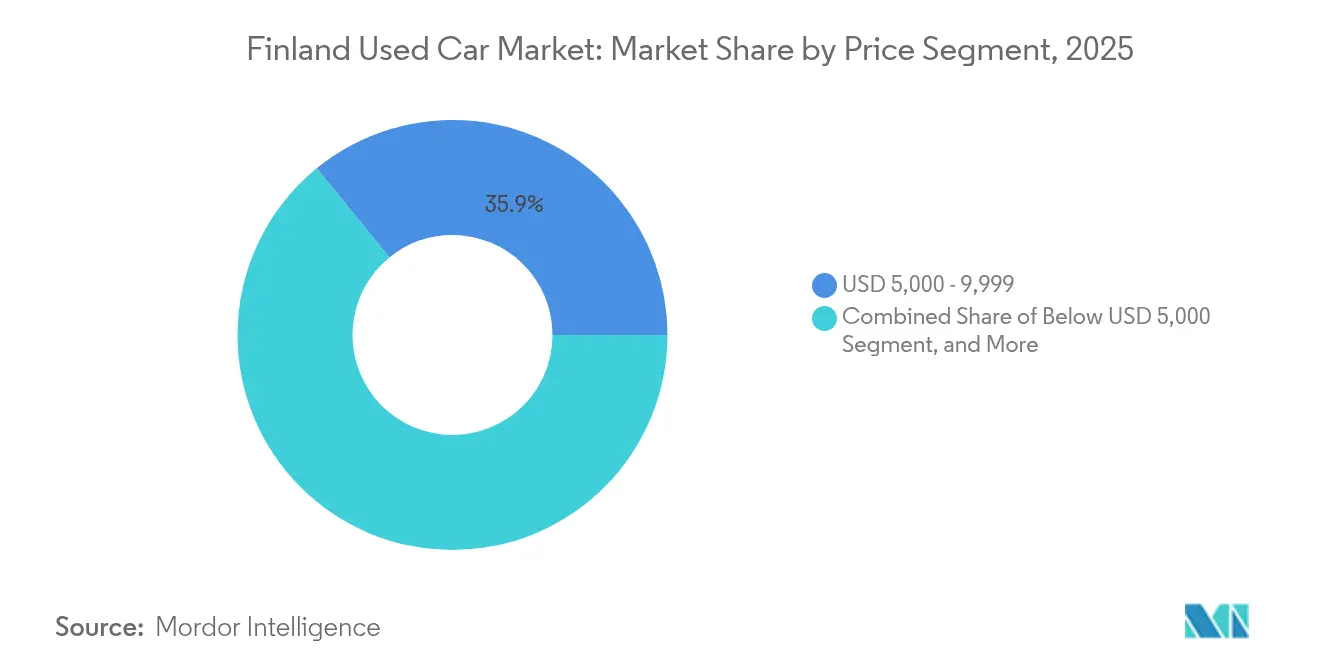
- By price band, units priced USD 5,000-9,999 dominated the Finnish used car market in 2025, with a 35.88% share, yet the USD 20,000-29,999 bracket accelerates at a 9.22% CAGR to 2031.
- By ownership, multi-owner cars represented 67.66% of share in the the Finland used car market in 2025, while first-owner resales grew at an 10.92% CAGR to 2031.
Note: Market size and forecast figures in this report are generated using Mordor Intelligence’s proprietary estimation framework, updated with the latest available data and insights as of 2026.
Global valuation is built by aggregating outputs from multiple countries and regions, with Finland being one of the contributors. Our global used car market size represents that cumulative total.
Finland Used Car Market Trends and Insights
Drivers Impact Analysis*
| Driver | (~) % Impact on CAGR Forecast | Geographic Relevance | Impact Timeline |
|---|---|---|---|
| Shift to Cost-Efficient Mobility | +1.5% | National, concentrated in Helsinki metropolitan area | Medium term (2-4 years) |
| Drop in New-Car Sales & Delivery Delays | +1.2% | National, with stronger impact in northern regions | Short term (≤ 2 years) |
| Digitalization of Used-Car Platforms | +1.1% | National, with urban acceleration | Long term (≥ 4 years) |
| Growth in Second-Hand BEVs & Hybrids | +0.8% | National, with southern Finland leading adoption | Medium term (2-4 years) |
| Strong EV-Ready ICE Residual Values | +0.7% | National, premium segments concentrated in major cities | Medium term (2-4 years) |
| Rise in Corporate Lease Returns | +0.6% | National, corporate centers in Helsinki, Tampere, Turku | Short term (≤ 2 years |
| Source: Mordor Intelligence | |||
Post-Pandemic Shift to Cost-Efficient Mobility
Remote work reached more knowledge workers, permanently altering commuting habits and intensifying price sensitivity. Used vehicles now rank as pragmatic substitutes for new cars, supporting the Finnish used car market as households focus on the total cost of ownership rather than status. Organized retailers capture this demand by bundling warranties and predictable financing, while corporates extend replacement cycles and redirect budget to pre-owned units for non-executive fleets. The premiumization angle emerges because buyers equate lower lifetime cost with better-kept, technologically current cars, bolstering transaction values in higher segments.
Decline in New-Car Sales and Extended Delivery Lead Times
Registrations fell 15.4% in 2024 to 74,072 units, pushing shoppers toward readily available pre-owned alternatives[1]“New-car registrations slump 15.4% in 2024,” Helsinki Times Staff, helsinkitimes.fi. Delivery queues of 6-12 months for popular models elevate residuals on 0-2-year vehicles, while organized dealers import stock from Germany, Sweden, and the Netherlands to meet demand. Strengthened residuals raise trade-in equity, keeping owners within the Finland used car market cycle and deepening liquidity.
Rapid Digitalization of Used-Car Retail Platforms
Online channels already command a 64.75% share and climb at 9.37% CAGR, aided by virtual inspections, AI-based pricing, and one-click finance[2]“Marketplace segment financials 2024,” Alma Media Plc, alma.fi. Nettiauto alone processed more than 640,000 deals every year, lowering search frictions and expanding reach for small-town dealers. Digital scale intensifies competition but delivers price transparency that advances consumer trust, a traditional hurdle for the Finland used car industry.
Surge in Corporate Lease-Return Volumes
Fleet disposals from companies in Helsinki, Tampere, and Turku raise near-new supply with full service records, matching buyers seeking reliable options. Kesko’s automotive arm reports a larger throughput of such cars, giving organized channels inventory depth and quality advantages. Leasing-turnover cycles shorten as firms chase tax incentives for low-emission fleets, reinforcing a regular inflow of well-maintained stock that underpins volume growth.
Restraints Impact Analysis*
| Restraint | (~) % Impact on CAGR Forecast | Geographic Relevance | Impact Timeline |
|---|---|---|---|
| Higher Financing Costs Amid Elevated ECB Interest Rates | -0.9% | National, disproportionately affecting price-sensitive segments | Short term (≤ 2 years) |
| Persistent Trust and Transparency Concerns | -0.8% | National, particularly affecting unorganized dealers | Long term (≥ 4 years) |
| Shrinking Diesel Demand Depresses Resale Values | -0.6% | National, with rural areas most affected | Medium term (2-4 years) |
| EU Sustainability Disclosure Raises Reconditioning Cost | -0.4% | National, primarily impacting organized dealers | Medium term (2-4 years) |
| Source: Mordor Intelligence | |||
Higher Financing Costs Amid Elevated ECB Interest Rates
Car-loan rates surged during 2024, eroding affordability for entry-level buyers and squeezing dealer finance-margin income[3]“ECB rate hike impact on consumer credit,” Daily Finland Business Desk, dailyfinland.fi. Banks tightened credit standards, nudging prospects toward cash deals or alternative lenders. Although the Bank of Finland flagged easing consumer-credit rates in early 2025, the lagged effect still tempers short-term momentum for the Finland used car market.
Persistent Trust and Transparency Concerns
Complaint volumes at leading chains underline lingering skepticism over vehicle condition disclosures, particularly in the unorganized space. Regulators are weighing stricter inspection norms that could raise compliance costs yet heighten confidence. Organized dealers leverage certified pre-owned schemes and third-party reports to alleviate fear, but smaller sellers risk margin erosion as the bar for transparency climbs.
*Our forecasts treat driver/restraint impacts as directional, not additive. The impact forecasts reflect baseline growth, mix effects, and variable interactions.
Segment Analysis
By Vehicle Type: SUVs Drive Premiumization Trends
Hatchbacks still hold the most significant slice of the Finnish used car market at 42.31%, while SUVs account for a 9.05% CAGR, the quickest growth within. Buyers prioritize ride height, safety perception, and winter traction, steering demand toward AWD-equipped crossovers suited to rural and icy conditions. Organized retailers capitalize by importing desirable models and bundling winter-tire packages, reinforcing higher ticket values. Sedans and MPVs serve legacy family and fleet niches but concede share to versatile crossovers. Coupes and convertibles remain lifestyle picks for affluent urbanites. The widening spectrum of body types enables retailers to strategically tier their inventory, ensuring customer capture across various budgets and lifestyles.


By Vendor Type: Organized Channels Gain Market Share
The unorganized share, at 54.22% in 2025, still dominates; however, organized outlets are projected to outpace it at an 8.67% CAGR through 2031, driven by stronger consumer trust, digital investments, and financing partnerships. Consolidation looms as compliance and technology costs rise. Organized chains align multi-site inventory with national online storefronts, preserving scale and lifting gross margins despite competitive pricing. Unorganized operators rely on lower overheads and price agility, but they confront tightening EU sustainability rules that increase reconditioning expenses. Some transition to franchise models or integrate with digital marketplaces to retain relevance. As scale benefits accumulate, the Finnish used car market size attributable to organized ventures is expected to eclipse unorganized turnover in the next decade.
By Fuel Type: Electric Vehicles Accelerate Market Transformation
Petrol cars dominate the Finland used car market, with a 48.95% share, yet battery-electric units post the fastest 11.78% CAGR, driven by corporate EV lease returns and 4,600 public charging points nationwide. Residual value volatility for EVs moderates as charging coverage widens, and second-life battery warranties emerge. Diesel demand contracts, mirroring policy disincentives, and heightened urban emission controls. Hybrid (HEV/PHEV) cars bridge the transition, enjoying tax breaks for company fleets. Alternative fuels stay niche but support targeted commercial uses. The result is a diversified energy mix that cushions supply risks and broadens buyer choice in the Finland used car market.
By Vehicle Age: Premium Segments Drive Value Migration
Units older than 12 command 41.32% share in the Finland used car market, while cars aged 0-2 years rise the quickest at 9.96% CAGR. High corporate turnover injects near-new, tech-rich stock that attracts buyers deterred by new-car wait times. The size of the used car market in Finland for this youngest cohort is forecast to double by 2030, aided by imports of recent-model EVs and SUVs.Cars aged 3-5 years balance reliability with value, while 6-8 year vehicles anchor budget needs. The 9-12-year bracket often triggers a repair-or-replace decision, feeding steady replacement cycles. Dealers use segmented warranty tiers to match risk with buyer expectations, maximizing inventory liquidity.
By Price Segment: Mid-Market Expansion Drives Growth
The USD 5,000-9,999 band leads the Finnish used car market, with a 35.88% share, aligning with median income purchasing power. However, the USD 20,000-29,999 tier accelerates at 9.22% CAGR, underscoring a shift toward higher-specification cars that deliver advanced safety, infotainment, and efficiency features. Organized dealers leverage certified status and finance bundles to convert aspirational shoppers, expanding Finland's used car market margins. Below USD 5,000, supply shrinks as older cars struggle with tightening safety and emission tests. Mid-bands remain volume anchors, while deals above USD 30,000 cater to enthusiasts and luxury cross-shoppers. Dynamic price segmentation lets retailers fine-tune marketing and stocking strategies.
By Sales Channel: Digital Platforms Reshape Market Structure
Online platforms captured a 64.12% share in the Finnish Used Car Market in 2025, which is expected to grow with a 9.19% CAGR through 2031. It underpins a step change in buying behavior, with one-stop valuation-to-delivery journeys becoming the norm. Nettiauto’s live data analytics facilitate price discovery and promote transparent negotiation. Dealers deploy omnichannel modules that sync showroom stock with web listings, raising inventory turn and reach. Offline venues remain available for customers who require tactile inspection or trade-in appraisals. OEM-backed certified programs win premium customers seeking factory support. Physical auctions are shifting toward dealer-to-dealer transactions as consumer bidders increasingly opt for online bidding.
By Ownership: First-Owner Vehicles Command Premium Positioning
Multi-owner cars account for 67.66% of transactions, while first-owner resales increase by 10.92% CAGR, reflecting lease-return inflows and perceived quality assurance. Certified outlets highlight their single-ownership history to justify pricing premiums and expedite the time-to-sale. Fleet disposal cars often combine full-service records with low mileage, providing a satisfying value for those wary of unknown histories. As the supply of such units rises, residuals stabilize and reinforce trust in organized channels across the Finnish used car industry.
Geography Analysis
Southern Finland, led by the Helsinki metropolitan region, accounts for the largest share of the Finnish used car market, driven by higher disposable income, widespread online adoption, and increased uptake in the premium segment. The area’s tech-savvy consumer base embraces fully digital purchase flows, supporting quick inventory turnover and robust pricing. Winter-tyre mandates and short urban commutes favor compact SUVs and hatchbacks, while premium brands benefit from employer car schemes.Central corridors around Tampere and Turku host significant corporate fleets that feed a steady stream of lease returns into regional lots. Their logistics advantage positions organized dealers to redistribute stock nationwide, smoothing regional price fluctuations and reinforcing pipeline consistency. Digital platforms further bridge urban-rural gaps, giving buyers in smaller towns visibility into national inventory and fostering competitive tension that aligns regional price points.Northern Finland experiences harsher climates and longer travel distances, sustaining demand for AWD diesels and rugged SUVs. Supply logistics are more cumbersome, yet lower competitive density grants established dealers wider margins. Cross-border proximity to Sweden encourages bilateral trade, with exporters targeting models suited to local road and weather conditions. Regulatory harmonization within the EU simplifies paperwork, allowing Finnish dealers to capitalize on vehicle inflows from Germany and the Netherlands, where larger markets generate ample supplies of late-model vehicles.
Coverage of the used car market by Mordor Intelligence spans a wide geographic footprint, with regional analysis available for Africa, alongside detailed country-level intelligence for Switzerland, Belgium, Tanzania, Norway, Myanmar, Sri Lanka, Nigeria, and Kenya, each shaped by local operating conditions.
Competitive Landscape
Finland's used car market is moderately fragmented, with top organized players lacking a dominant share, leaving space for smaller independents while exposing them to rising compliance and technology costs. Kamux leverages standardized sourcing and reconditioning across a multishop footprint, though customer-service complaints highlight residual trust gaps. K-Auto utilizes parent Kesko’s retail muscle, integrating new-vehicle trade-ins and service contracts to stabilize profitability.
Technology is the primary competitive lever. AUTO1 Group’s Europe-wide auction network provides Finnish dealers with access to 500 drop-off points, enhancing cross-border sourcing and price arbitrage. Pure-play e-retailers like Autoverkkokauppa employ headless-commerce stacks to push targeted campaigns, shortening the promotion-to-launch cycle and sharpening conversions. Smaller operators adopt white-label marketplace tools or affiliate with classifieds to maintain digital relevance without prohibitive capital expenditures.
Consolidation is likely as EU sustainability disclosure tightens, elevating reconditioning standards. Operators with scale can amortize audit, data, and warranty costs across higher volumes, widening the gap to unorganized lots. Premium and EV specialization emerges as a niche for dealers investing in battery diagnostics and high-voltage technician training, an area underserved by incumbents. The interplay of digital efficiency, sourcing reach, and compliance readiness will shape competitive outcomes across the Finnish used car market.
Finland Used Car Industry Leaders
Kamux Corporation
Kesko-Auto
Veho Oy Ab
Saka – Suomen Autokauppa Oy
Nettiauto
- *Disclaimer: Major Players sorted in no particular order

Recent Industry Developments
- January 2025: The Bank of Finland signaled lower consumer credit rates, potentially reviving financed purchases after a high rate in 2024.
- November 2024: AUTO1 Group opened its 500th European drop-off branch, boosting cross-border inventory flow for Finnish dealers.


Finland Used Car Market Report Scope
A used Car is a pre-owned vehicle that has previously had one or more retail owners. These cars are sold through a variety of outlets through independent dealers, online sales channels, and others.
Finland used car market is segmented by vehicle type, vendor type, and fuel type. Based on the vehicle type, the market is segmented into hatchbacks, sedans, sports utility vehicles, and multi-purpose vehicles. Based on the vendor type, the market is segmented into organized and unorganized. Based on the fuel type, the market is segmented into gasoline, diesel, electric, and other fuel types.
For each segment, the market sizing and forecast have been done based on the value (USD).
| Hatchbacks |
| Sedans |
| Sport-Utility Vehicles (SUVs) |
| Multi-Purpose Vehicles (MPVs) |
| Organised |
| Unorganised |
| Petrol |
| Diesel |
| Hybrid (HEV & PHEV) |
| Battery-Electric (BEV) |
| Others |
| 0 - 2 Years |
| 3 - 5 Years |
| 6 8 Years |
| 9 - 12 Years |
| Above 12 Years |
| Below 5,000 |
| 5,000 - 9,999 |
| 10,000 - 14,999 |
| 15,000 - 19,999 |
| 20,000 - 29,999 |
| Above 30 000 |
| Online |
| Offline |
| First-owner Resale |
| Multi-owner |
| By Vehicle Type | Hatchbacks |
| Sedans | |
| Sport-Utility Vehicles (SUVs) | |
| Multi-Purpose Vehicles (MPVs) | |
| By Vendor Type | Organised |
| Unorganised | |
| By Fuel Type | Petrol |
| Diesel | |
| Hybrid (HEV & PHEV) | |
| Battery-Electric (BEV) | |
| Others | |
| By Vehicle Age | 0 - 2 Years |
| 3 - 5 Years | |
| 6 8 Years | |
| 9 - 12 Years | |
| Above 12 Years | |
| By Price Segment (USD) | Below 5,000 |
| 5,000 - 9,999 | |
| 10,000 - 14,999 | |
| 15,000 - 19,999 | |
| 20,000 - 29,999 | |
| Above 30 000 | |
| By Sales Channel | Online |
| Offline | |
| By Ownership | First-owner Resale |
| Multi-owner |


Key Questions Answered in the Report
What is the current value of the Finland used car market?
The market is worth USD 14.55 billion in 2026 and is projected to reach USD 19.98 billion by 2031.
Which vehicle type is growing fastest in Finland’s used-car space?
SUVs lead growth with a forecast 9.05% CAGR through 2031, even though hatchbacks remain the volume leader.
How dominant are online sales channels for used cars in Finland?
Online platforms already account for 64.12% of transactions and are expanding at a 9.19% CAGR.
What impact do electric vehicles have on the secondary market?
Battery-electric models grow at 11.78% CAGR, supported by rising lease-return volumes and improved charging infrastructure.
How are higher European interest rates influencing used-car purchases?
Elevated financing costs have temporarily suppressed demand among price-sensitive buyers, though early-2025 rate easing from the Bank of Finland may rekindle financed transactions.
Page last updated on:


