Market Overview
| Study Period | 2020 - 2031 |
|---|---|
| Forecast Data Period | 2026 - 2031 |
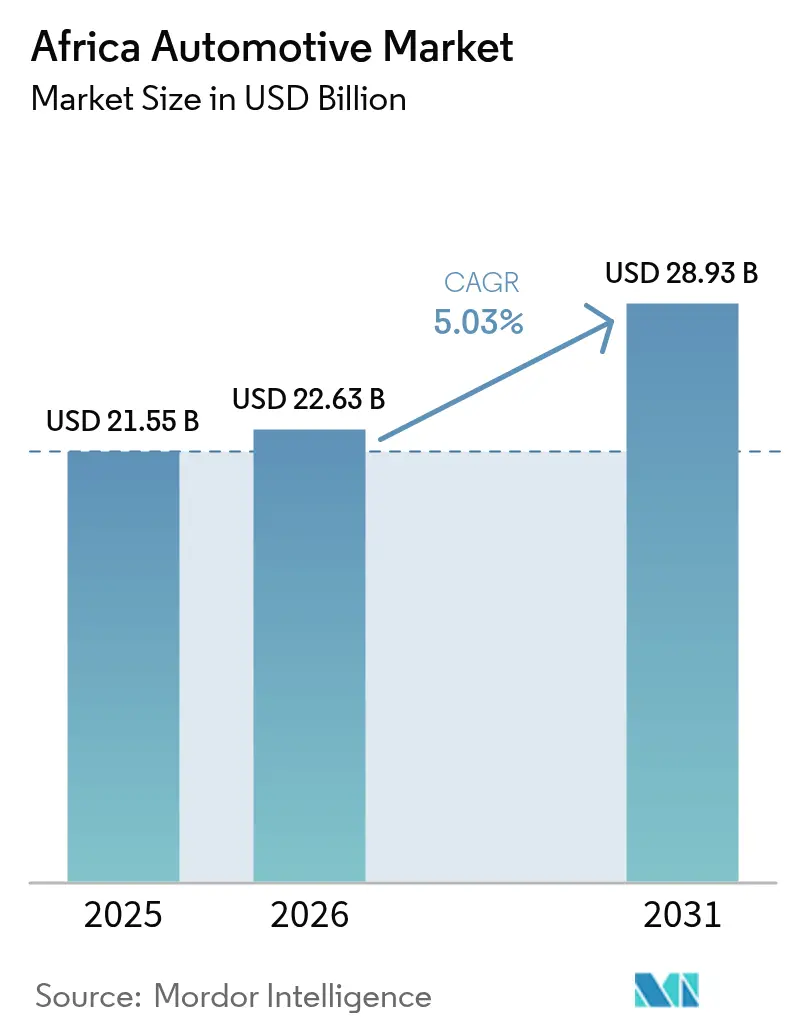
| Base Year Market Size (2025) | USD 21.55 Billion |
| Market Size (2026) | USD 22.63 Billion |
| Market Size (2031) | USD 28.93 Billion |
| Growth Rate (2026 - 2031) | 5.03% CAGR |
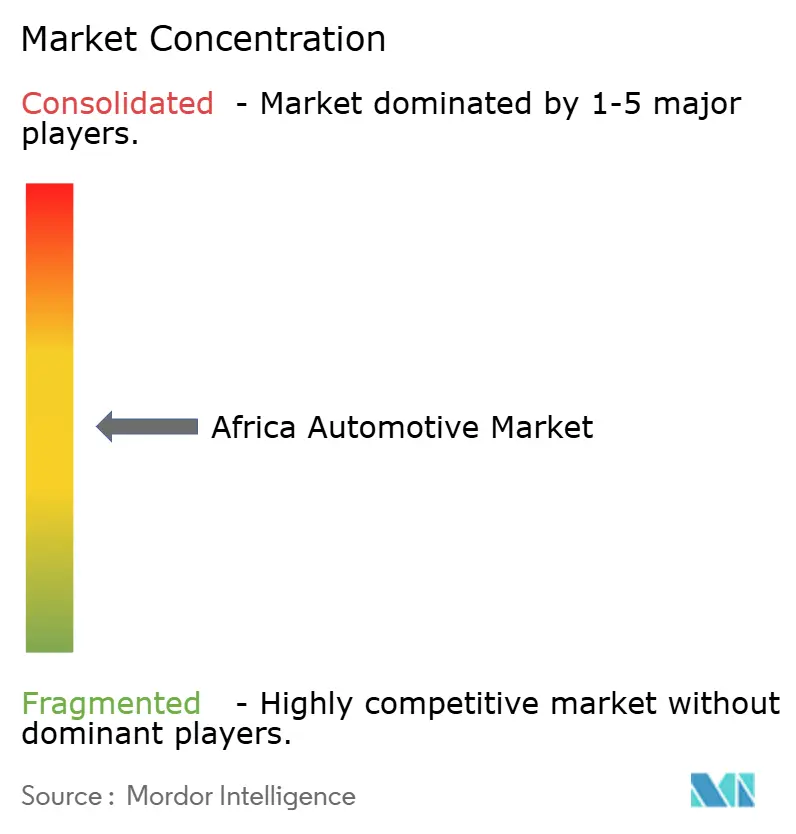
| Market Concentration | Medium |
Major Players *Disclaimer: Major Players sorted in no particular order Image © Mordor Intelligence. Reuse requires attribution under CC BY 4.0. | |
Africa Automotive Market Analysis by Mordor Intelligence
Africa automotive market size in 2026 is estimated at USD 22.63 billion, growing from 2025 value of USD 21.55 billion with 2031 projections showing USD 28.93 billion, growing at 5.03% CAGR over 2026-2031. Rising urban middle-class spending, accelerated Chinese CKD/SKD investments, and AfCFTA tariff liberalization collectively set a positive demand trajectory for the Africa automotive market [1]“Africa’s Emerging Consumer Class,”, Finance & Development, imf.org. Digital remittance platforms channeling diaspora funds into vehicle purchases and ride-hailing and last-mile delivery fleet expansion further widen addressable volumes. Regional OEMs benefit from policy incentives prioritizing local value addition, while miners’ pilot programs for electric pickups in the copper-belt introduce a specialist commercial niche. Logistics bottlenecks, currency volatility, and grey-market used-car inflows remain the critical headwinds that can temper growth momentum in the Africa automotive market.
Key Report Takeaways
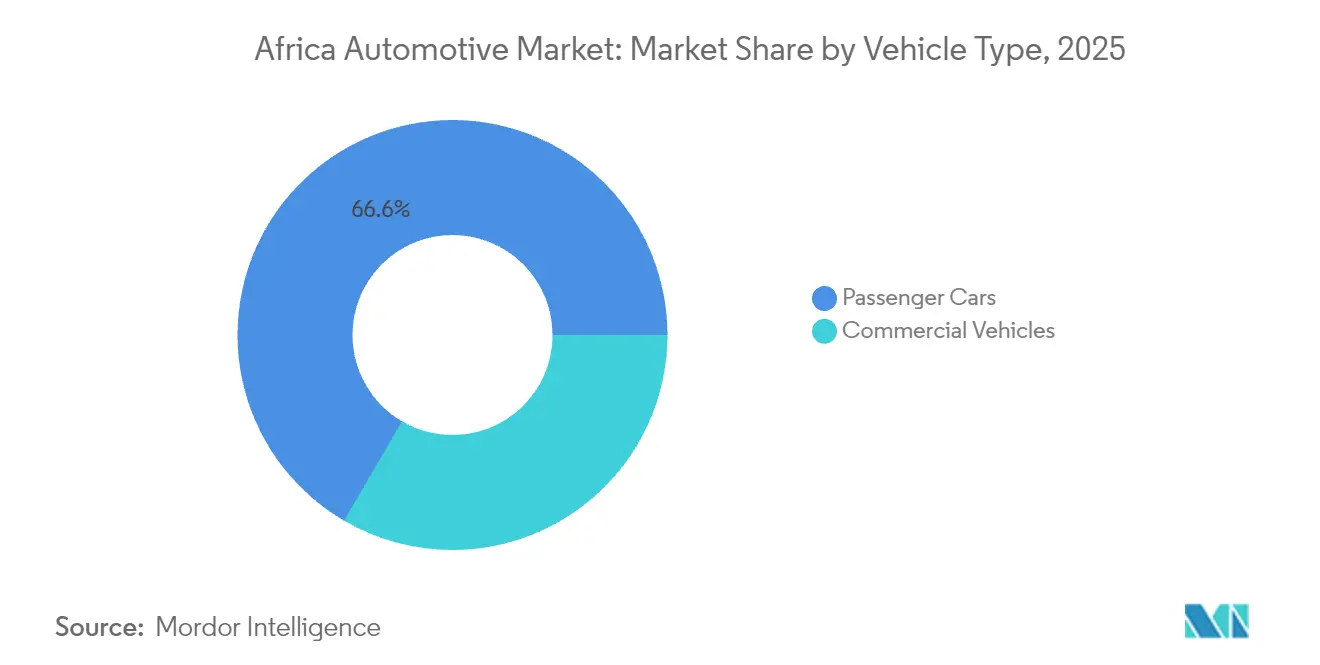
- By vehicle type, passenger cars held 66.58% of Africa automotive market share in 2025; commercial vehicles are projected to expand at an 8.36% CAGR to 2031.
- By propulsion type, internal combustion engines led with 90.68% share in 2025, while battery electric vehicles are forecast to rise at a 10.12% CAGR through 2031.
- By end-use, personal ownership represented 62.05% of Africa automotive market size in 2025, whereas fleet and leasing should advance at a 9.33% CAGR over the forecast period.
- By sales channel, completely built-up imports captured 49.15% share of Africa automotive market size in 2025; SKD/CKD assembly is set to progress at an 8.19% CAGR by 2031.
- By Country, South Africa dominated with a 37.85% share in 2025, while Nigeria is anticipated to post the fastest 8.94% CAGR through 2031.
Note: Market size and forecast figures in this report are generated using Mordor Intelligence’s proprietary estimation framework, updated with the latest available data and insights as of 2026.
Africa Automotive Market Trends and Insights
Drivers Impact Analysis*
| Driver | (~) % Impact on CAGR Forecast | Geographic Relevance | Impact Timeline |
|---|---|---|---|
| Rising Urban Middle Class Car Ownership | +1.2% | Pan-African, concentrated in Nigeria, Kenya, Ghana | Medium term (2-4 years) |
| Chinese OEM CKD/SKD Investments | +0.8% | South Africa, Morocco, Kenya, Rwanda | Short term (≤ 2 years) |
| AfCFTA Tariff Reductions | +0.6% | All 54 member states, early gains in West Africa | Long term (≥ 4 years) |
| Ride-Hailing and Delivery Fleet Expansion | +0.4% | Urban centers across Nigeria, Kenya, South Africa, Ghana | Medium term (2-4 years) |
| Diaspora-Financed Vehicle Purchases | +0.3% | Nigeria, Ghana, Kenya, with spillover to rural areas | Short term (≤ 2 years) |
| Mining-Sector EV Pilot Programs | +0.2% | Zambia, DRC, with expansion potential to Zimbabwe | Long term (≥ 4 years) |
| Source: Mordor Intelligence | |||


Rising Passenger-Car Ownership Among Africa's Urban Middle Class
Vehicle ownership closely tracks income gains, and Africa’s middle class is projected to swell toward 1.1 billion people by 2060. Driving incremental demand for personal mobility. Aspirational buyers gravitate toward entry-level and compact passenger models that balance affordability with urban practicality. Financing innovations such as longer-tenor auto loans and subscription models improve affordability, reinforcing the upward demand cycle across the Africa automotive market.
AfCFTA Tariff Reductions Stimulating Intra-Regional Trade
The African Continental Free Trade Area (AfCFTA) will phase out tariffs on 90% of goods, with most non-LDC nations obliged to comply within five years[2]“AfCFTA and Automotive Rules of Origin,”, MONDAQ, mondaq.com. Automotive OEMs stand to gain lower input costs on regional parts procurement, while clear rules of origin encourage local value addition that unlocks preferential tariffs. Forty-six countries have already submitted concession schedules, translating trade liberalization into tangible cost relief for CKD operations. Non-tariff barrier reforms—customs digitization, harmonized standards, and streamlined border procedures—are expected to release an extra USD 20 billion in trade value, a direct boon for the Africa automotive market.
Expansion of Ride-Hailing and Last-Mile Delivery Fleets
Urban congestion and smartphone penetration underpin the meteoric rise of ride-hailing and e-commerce logistics. Uber’s tie-up with Opibus for 3,000 electric motorcycles showcases fleet electrification momentum in Nairobi and Lagos. Ghana-based YomYom is scaling an all-electric fleet to 200 units, proving that route optimization and lower energy costs can cut operating expenses for last-mile operators. These commercial use-cases unlock consistent multi-vehicle orders, supporting sustained growth for light commercial vehicles within the Africa automotive market.
Mining-Sector EV Pilot Programs in Copper-Belt Nations
Zambia and DRC control approximately 70% of global battery minerals, prompting Afreximbank and UNECA to back a transboundary EV Special Economic Zone[3]“Battery Minerals and Regional EV Zone,”, UNECA, uneca.org. Mining houses now test electric pickups for underground operations where zero-emission requirements align with lower ventilation costs. Proximity to cathode materials trims battery logistics expenses, giving regional OEMs a compelling cost advantage. The success of these pilots can catalyze a broader pivot toward electrified commercial vehicles inside the Africa automotive market.
Restraints Impact Analysis*
| Restraint | (~) % Impact on CAGR Forecast | Geographic Relevance | Impact Timeline |
|---|---|---|---|
| Port Congestion and Logistics Bottlenecks | -0.9% | South Africa, Nigeria, Ghana, Kenya | Short term (≤ 2 years) |
| Currency Volatility on Import Costs | -0.7% | Nigeria, Ghana, Kenya, Zambia | Medium term (2-4 years) |
| Grey-Market Used-Vehicle Competition | -0.5% | West Africa corridor, Zimbabwe, Tanzania | Long term (≥ 4 years) |
| Auto-Grade Steel Capacity Shortage | -0.3% | Nigeria, Ghana, Côte d'Ivoire | Long term (≥ 4 years) |
| Source: Mordor Intelligence | |||
Chronic Port Congestion and Inland Logistics Bottlenecks
Durban and Lagos ports rank among the world’s slowest for automotive throughput, inflating dwell times and demurrage fees. Rail under-utilization and aging rolling stock shift traffic onto roads where high tolls and security risks push up landed vehicle costs. For CKD assemblers, inconsistent component arrivals disrupt just-in-time production, while exporters face missed sailing windows that erode supplier credibility. Unless ongoing corridor upgrades and single-window customs systems deliver measurable efficiencies, logistics friction will remain a drag on the Africa automotive market.
Currency Volatility Elevating Import Costs for CKD Kits
Ghanaian importers reported sharp profit erosions when the cedi depreciated, swelling dollar-denominated parts invoices[4]“Currency Risk for Importers,”, University of Cape Coast, ucc.edu.gh. Hedging strategies are expensive, and thinner working-capital buffers make smaller dealers particularly vulnerable. Exchange-rate swings also impair consumers’ price visibility, dampening showroom footfall. Countries with low foreign-currency reserves sporadically tighten import licensing, delaying kit clearances and introducing forecasting uncertainty for plants across the Africa automotive market.
*Our forecasts treat driver/restraint impacts as directional, not additive. The impact forecasts reflect baseline growth, mix effects, and variable interactions.
Segment Analysis
By Vehicle Type: Commercial Vehicles Accelerate on Logistics Demand
Passenger cars dominated the Africa automotive market with a 66.58% share in 2025, reflecting personal mobility’s appeal across sprawling urban centers. However, freight growth under AfCFTA and booming e-commerce pivot attention toward vans, pickups, and heavy trucks that are forecast to outpace passenger models at an 8.36% CAGR. Light commercial vehicles benefit from last-mile parcel volumes, whereas medium and heavy trucks haul regionally traded goods under harmonized customs corridors. Mining firms quickly test battery-electric dumpers, signaling future substitution opportunities in heavy-duty fleets.
Commercial vehicle assemblers leverage government incentives that waive import duties on chassis and drivetrains, narrowing price gaps versus grey-market used imports. Global production reallocations also matter: Morocco surpassed South Africa in 2024 with 614,000 units, creating a deep supplier base that can pivot toward freight platforms. As logistics players formalize operations, fleet replenishment cycles shorten, sustaining momentum in this segment of the Africa automotive market.


By Propulsion Type: Electric Uptake Gathers Pace from a Low Base
Internal combustion engines retained a 90.68% share in 2025, underscoring affordable fuel and servicing ecosystems. Nevertheless, battery electrics are projected to post a 10.12% CAGR on the back of Chinese OEM launches and fiscal incentives in Rwanda, Kenya, and Egypt. Pre-owned hybrid imports from Japan seed early consumer familiarity with electrified drivetrains, while duty exemptions on EV components lower the total cost of ownership for commercial fleets.
Grid stability constraints slow rollout outside major metros, yet copper-belt mining sites deploy off-grid solar-battery hubs to power electric pickups. Over time, diminishing battery costs and wider charging corridors could unlock a steeper adoption curve, gradually trimming ICE dominance in the African automotive market.
By End-Use: Fleets Outpace Private Ownership
Personal buyers still command 62.05% of 2025 volumes, but institutional demand grows faster as corporates decarbonize mobility profiles and ride-hailing apps finance multi-vehicle acquisitions via revenue-share models. Fleet managers exploit bulk-procurement discounts and telematics to optimize uptime, while residual-value guarantees shorten replacement cycles to four years or less.
Government leasing programs stipulate minimum local content, nudging CKD plants toward higher localization thresholds. This virtuous loop reinforces assembly economies of scale, widening the addressable fleet base for the Africa automotive market.

By Sales Channel: Assembly Gains Policy Tailwinds
Completely built-up imports held a 49.15% share in 2025, yet SKD/CKD assembly is forecast to climb at an 8.19% CAGR as tariff differentials widen under local-manufacturing mandates. Nigeria’s updated NAIDP targets 40% local content by 2033, offering VAT waivers on tools and parts to qualifying investors. Kenya enforces age caps on used imports, channeling demand toward locally assembled models while granting excise rebates to dealers that meet employment thresholds.
Chinese OEMs capitalize by shipping knock-down kits to avoid restrictive tariffs applied to finished vehicles. This deepens the Africa automotive market’s manufacturing base and gradually weans customers away from fully imported choices.
Geography Analysis
South Africa contributed 37.85% of regional volumes in 2025, anchored by a mature supplier ecosystem and preferential EU trade access. Yet Nigeria’s 8.94% forecast CAGR reflects pent-up demand in Africa’s most populous nation, supported by AfCFTA-linked duty waivers on parts and vehicles. Morocco’s coastal plants now export SUVs and compact cars to Europe tariff-free under the Agadir Agreement, diversifying Africa’s production footprint beyond the southern cone.
Regional hubs like Ghana and Kenya leverage automotive policies to court investors, banking on strategic port locations and growing consumer bases. Collectively, these markets amplify growth for the African automotive market by spreading production risk and stimulating healthy competition among investment destinations. East Africa gains traction through harmonized customs codes and shared infrastructure. Kenya restricts used-car imports over eight years old, steering buyers toward new or locally built options, while Ethiopia orders thousands of EVs for state fleets to cut fuel import bills. Rwanda’s incentive package for electric buses catalyzes BYD and Chery deployments, forming a demonstrator corridor for zero-emission public transport. These policy moves collectively shape an ecosystem that fosters healthy geographic diversification for the Africa automotive market.
Competitive Landscape
Competition is moderate and intensifying. Toyota, Volkswagen, and Hyundai still leverage long-standing dealer networks, robust after-sales, and brand trust to command showroom traffic. However, Chinese entrants expanded their share from 2% in 2019 to 9% in 2024 by coupling aggressive pricing with advanced tech features and extended warranties [CNBCAF RICA.COM]. BYD’s vertical integration—from battery chemistry to semiconductor design—keeps costs low, allowing the company to broaden its South African line-up to six models by April 2025.
Local manufacturers exploit niche opportunities. Nigeria’s Innoson Vehicle Manufacturing produces minibuses tailored for West African road conditions, while Kenyan startups assemble electric motorcycles for courier fleets. Strategic alliances—such as BYD partnering with Associated Vehicle Assemblers in Mombasa—merge global technology with local assembly knowledge, reinforcing value addition inside the Africa automotive market.
Policy and technology convergence will reshape the competitive set. AfCFTA’s origin rules favor companies with regional footprints, while digital retail platforms allow newcomers to bypass legacy showrooms. Winners will be those that blend cost-effective assembly, accessible financing, and service networks attuned to rugged operating environments. Given current shares, the Africa automotive market exhibits a balanced rivalry where no single player holds overwhelming dominance.
Africa Automotive Industry Leaders
Volkswagen AG
Toyota Motor Corporation
Groupe Renault
Hyundai Motor Corporation
Ford Motor Company
- *Disclaimer: Major Players sorted in no particular order

Recent Industry Developments
- June 2025: BYD confirmed plans to triple its South African dealership count from 13 to 35 by 2026, marking the largest Chinese OEM retail expansion on the continent.
- April 2025: BYD introduced the SHARK 6 hybrid pickup, SEALION 6 hybrid SUV, and SEALION 7 BEV in South Africa, broadening its product slate to six models.
- September 2024: Neta Auto unveiled plans to open 100 dealerships across 20 African countries within three years, underscoring continued Chinese expansion.


Africa Automotive Market Report Scope
The automotive industry comprises a wide range of companies and organizations involved in the design, development, manufacturing, marketing, and selling of motor vehicles. The African automotive market report covers the African market landscape and predicts the growth of its automobile market. The study also includes growth, market trends, progress, challenges, opportunities, government regulations, technology use, and growth forecasts.
By vehicle type, the market is segmented into two-wheelers, passenger cars, commercial vehicles, and three-wheelers. By fuel type, the market is segmented into diesel, petrol/gasoline, electric, CNG/LPG, and others. By country, the market is segmented into South Africa, Morocco, Algeria, Egypt, Nigeria, Ghana, Kenya, and the Rest of Africa. The report offers market size and forecasts for the African automotive market in value (USD) for all the above segments.
By Vehicle Type
| Passenger Cars | Hatchback |
| Sedan | |
| SUV & Crossover | |
| MPV & Others | |
| Commercial Vehicles | Light Commercial Vehicles (LCV) |
| Medium & Heavy Trucks | |
| Buses & Coaches |
By Propulsion Type
| Internal Combustion Engine (ICE) |
| Hybrid Electric Vehicle (HEV) |
| Battery Electric Vehicle (BEV) |
| Alternative Fuels (CNG/LPG, Flex-fuel, FCEV) |
By End-Use
| Personal Ownership |
| Fleet & Leasing |
| Ride-hailing / Mobility Service Providers |
| Government & Institutional |
By Sales Channel
| Completely Built-up Imports (CBU) |
| Semi/Completely Knocked-down Assembly (SKD/CKD) |
| Used-Vehicle Imports |
By Country
| South Africa |
| Morocco |
| Algeria |
| Egypt |
| Nigeria |
| Ghana |
| Kenya |
| Rest of Africa |
| By Vehicle Type | Passenger Cars | Hatchback |
| Sedan | ||
| SUV & Crossover | ||
| MPV & Others | ||
| Commercial Vehicles | Light Commercial Vehicles (LCV) | |
| Medium & Heavy Trucks | ||
| Buses & Coaches | ||
| By Propulsion Type | Internal Combustion Engine (ICE) | |
| Hybrid Electric Vehicle (HEV) | ||
| Battery Electric Vehicle (BEV) | ||
| Alternative Fuels (CNG/LPG, Flex-fuel, FCEV) | ||
| By End-Use | Personal Ownership | |
| Fleet & Leasing | ||
| Ride-hailing / Mobility Service Providers | ||
| Government & Institutional | ||
| By Sales Channel | Completely Built-up Imports (CBU) | |
| Semi/Completely Knocked-down Assembly (SKD/CKD) | ||
| Used-Vehicle Imports | ||
| By Country | South Africa | |
| Morocco | ||
| Algeria | ||
| Egypt | ||
| Nigeria | ||
| Ghana | ||
| Kenya | ||
| Rest of Africa | ||


Key Questions Answered in the Report
What is the current value of the Africa automotive market?
The market is valued at USD 22.63 billion in 2026 and is forecast to reach USD 28.93 billion by 2031.
Which country holds the largest share of vehicle production on the continent?
Morocco produced 614,000 units in 2024, edging past South Africa to become Africa’s largest producer.
Which segment is expanding quickest in terms of vehicle type?
Commercial vehicles, propelled by e-commerce and logistics demand, are set to grow at an 8.36% CAGR to 2031.
Why are Chinese automakers investing heavily in Africa?
Trade barriers elsewhere and AfCFTA tariff advantages make Africa an attractive growth frontier, allowing Chinese OEMs to capture share through CKD/SKD assembly and competitive pricing.
What are the main challenges limiting faster market growth?
Chronic port congestion, currency volatility, widespread used-vehicle imports, and limited local supply of ISO-certified auto-grade steel are the primary hurdles.
Page last updated on:


