
Market Overview
| Study Period | 2021 - 2031 |
|---|---|
| Forecast Data Period | 2026 - 2031 |
| Base Year Market Size (2025) | 202.5 gigawatt |
| Market Volume (2026) | 200.11 gigawatt |
| Market Volume (2031) | 188.45 gigawatt |
| Growth Rate (2026 - 2031) | -1.18 % |
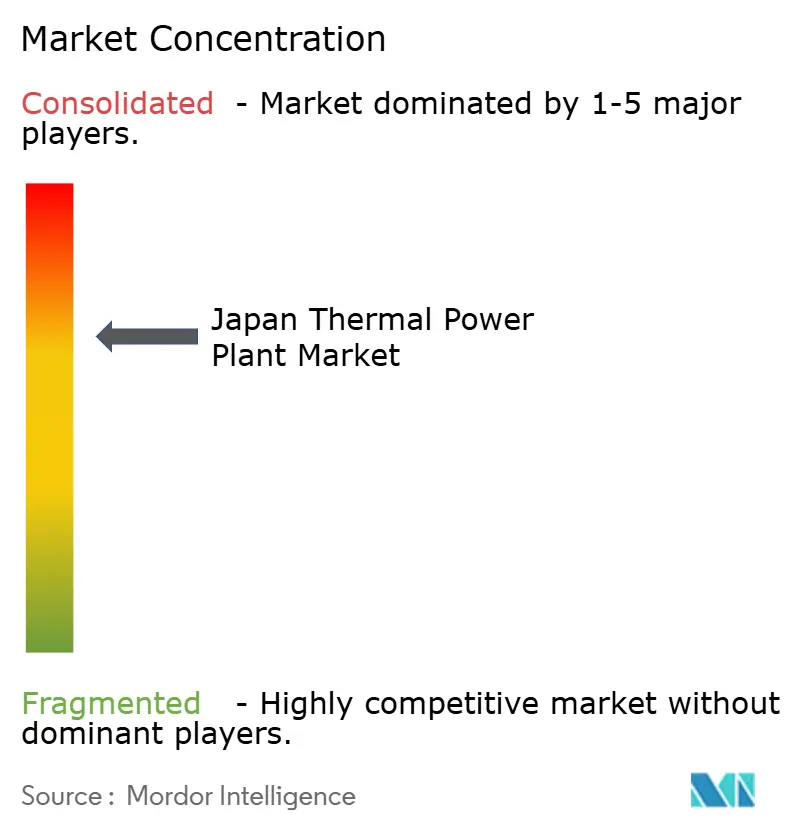
| Market Concentration | Medium |
Major Players *Disclaimer: Major Players sorted in no particular order Image © Mordor Intelligence. Reuse requires attribution under CC BY 4.0. | |
Japan Thermal Power Plant Market Analysis by Mordor Intelligence
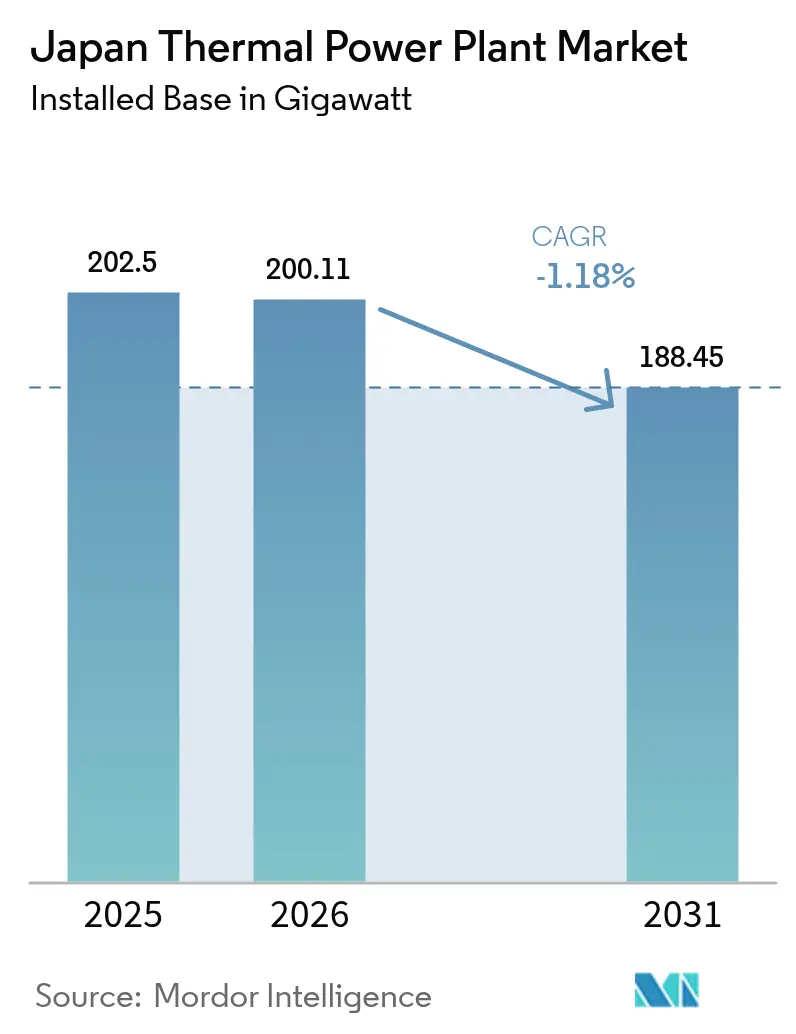
The Japan Thermal Power Plant Market size is expected to grow from 202.5 gigawatt in 2025 to 200.11 gigawatt in 2026 and is forecast to reach 188.45 gigawatt by 2031 at -1.18% CAGR over 2026-2031.
The contraction co-exists with replacement demand because nuclear restarts, coal retirements, and policy-driven decarbonization reorder the generation mix. LNG remains the bridge fuel; gas-fired plants held 49.6% capacity share in 2024 and continue to expand as coal exits the fleet. Utilities are installing ultra-efficient combined-cycle turbines, accelerating ammonia co-firing pilots, and testing carbon capture to comply with the emissions-trading system that becomes mandatory in 2026. Competitive pressure stays intense because capacity-market payments favor dispatchable assets, while data-center build-outs in Tokyo and Osaka create a new source of round-the-clock demand that rewards flexible peaker plants.
Key Report Takeaways
- By fuel type, natural gas held 49.83% of the Japan thermal power market share in 2025 and is the only segment projected to grow, advancing at a 1.18% CAGR through 2031.
- By technology, combined heat and power accounted for 3.72% of incremental capacity additions in 2025 and is forecast to record the fastest 3.75% CAGR through 2031.
- By application, peaker plants contributed 4.95% of new capacity in 2025 and are projected to register a 4.85% CAGR to 2031.
- By combustion method, turbine-based systems represented 50.35% of incremental builds in 2025 and are set to grow at a 2.47% CAGR through 2031.
- JERA, Kansai Electric, and Chubu Electric together generated 57.00% of national thermal output in 2024.
Note: Market size and forecast figures in this report are generated using Mordor Intelligence’s proprietary estimation framework, updated with the latest available data and insights as of 2026.
Japan Thermal Power Plant Market Trends and Insights
Drivers Impact Analysis*
| Driver | (~) % Impact on CAGR Forecast | Geographic Relevance | Impact Timeline |
|---|---|---|---|
| Decommissioning of aging coal fleet | +0.3% | Hokkaido, Tohoku, Chugoku | Medium term (2-4 years) |
| LNG-to-power capacity additions | +0.5% | Chiba, Aichi, Hyogo | Short term (≤ 2 years) |
| Industrial cogeneration demand | +0.2% | Aichi, Osaka, Kanagawa | Long term (≥ 4 years) |
| Hydrogen and ammonia co-firing retrofits | +0.4% | Nationwide, early JERA and Hokkaido Electric sites | Medium term (2-4 years) |
| Data-center-led baseload growth | +0.3% | Tokyo and Osaka metros | Short term (≤ 2 years) |
| Carbon-capture pilot incentives | +0.2% | Kansai, Kanto, Chubu | Long term (≥ 4 years) |
| Source: Mordor Intelligence | |||
Decommissioning of Aging Coal Fleet Accelerates Market Restructuring
Japan's thermal power plant market sees 22% of sub-critical coal units slated for closure by 2030, catalyzing demand for efficient replacements that meet tightening emission norms. Plant retirements converge with fossil-fuel levies, making shutdowns more economical than retrofits. Utilities in Kansai and Kyushu are fast-tracking CCGT and ultra-supercritical projects to secure reliable capacity and grid stability. As coal exits, investment shifts toward gas turbines that pair with battery storage and demand-response frameworks. The cycle creates construction opportunities for OEMs while lowering average fleet emissions intensity.
LNG-to-Power Capacity Additions Strengthen Energy Security Architecture
Three replacement projects delivered 6.66 GW between February 2024 and March 2025, reinforcing LNG’s central role in the Japan thermal power plant market. JERA’s annual procurement of 30 million t, 40% of the national supply, anchors price negotiations and hedging strategies. Coastal siting near existing terminals shortens lead times, and high-efficiency CCGTs lift fleet average thermal efficiency. Yet, domestic LNG demand dropped 25% since 2014, prompting utilities to re-export oversupply via regional trading hubs. This dual track balances domestic security with commercial flexibility.
Industrial Cogeneration Demand Driven by Manufacturing Resilience Requirements
Manufacturers operate 6,213 cogeneration units totaling 11,085 MW, achieving 44-50% overall efficiency that trims energy bills and emissions. Captive power shelters factories from grid price swings and blackout risk, a priority after recent supply chain disruptions. The revised Energy Conservation Act mandates tighter efficiency metrics, spurring upgrades in Aichi, Osaka, and Kanagawa. Developers bundle waste-heat applications with carbon-capture pilots to future-proof assets. As a result, industrial cogeneration becomes a niche growth pocket within the broader, slow-growing Japan thermal power plant market.
Carbon-Capture Pilot Incentives Create Pathways for Thermal Power Longevity
Nine CCS projects selected in July 2024 receive state backing, signalling that policymakers consider abated thermal generation a viable long-term asset class.(1)ICAP, “Japan Emissions Trading System,” capcarbonaction.com Kansai Electric’s Himeji plant captures 5 t CO₂ per day, validating technology integration without extensive downtime. Smaller skid units supplied by Toshiba to Tokyo Gas open distributed applications. Japan’s experience at Tomakomai, 0.3 Mt stored over 2016-2019, builds public confidence in offshore sequestration. If economics improve, CCS could offset a share of carbon-pricing liabilities, keeping legacy capacity dispatchable.
Restraints Impact Analysis*
| Restraint | (~) % Impact on CAGR Forecast | Geographic Relevance | Impact Timeline |
|---|---|---|---|
| Aggressive renewable capacity targets | –0.8% | Nationwide | Long term (≥ 4 years) |
| Rising carbon pricing and ETS costs | –0.6% | Nationwide | Medium term (2-4 years) |
| Coastal LNG terminal opposition | –0.3% | Domestic & Southeast Asia projects | Medium term (2-4 years) |
| Global LNG price volatility | –0.4% | Nationwide | Short term (≤ 2 years) |
| Source: Mordor Intelligence | |||
Aggressive Renewable Capacity Targets Compress Thermal Utilization
Japan aims for renewables to exceed 36-38% of the mix by 2030, a goal led by Kyushu’s solar and Tohoku’s wind build-out.(2)Ministry of Economy, Trade and Industry, “Sixth Strategic Energy Plan,” meti.go.jpHigh penetration forces curtailment of mid-merit thermal units, shrinking run-hours, and squeezing spark-spreads. Utilities respond by mothballing older oil and sub-critical coal assets. Grid-enhancement projects, including HVDC links, aim to smooth regional imbalances yet further curtail thermal dispatch in high-renewables zones.
Rising Carbon Pricing & ETS Costs Tilt Economics Away from Fossil Assets
The Fossil-Fuel Levy scheduled for FY 2028 levies incremental costs that escalate through 2030. Early ETS pilots price carbon near USD 15/t, and analysts expect a doubling by 2030 as free allocations taper. Higher compliance costs disproportionately hit coal and oil units, accelerating decommissioning schedules and constraining any upside in the Japan thermal power plant market.
*Our forecasts treat driver/restraint impacts as directional, not additive. The impact forecasts reflect baseline growth, mix effects, and variable interactions.
Segment Analysis
By Fuel Type: Natural Gas Expands as Coal Contracts
Natural gas accounts for 100.89 GW of the Japan thermal power market size and is projected to rise at a 1.18% CAGR to 2031. Coal retirements accelerate, illustrated by Hokkaido Electric’s 600 MW closure plan, while oil units serve only emergency roles. JERA’s 2.34 GW Goi plant and 1.32 GW Chita expansion anchor the shift. LNG over-contracting pressures margins, yet policy incentives and lower carbon intensity keep gas in a growth trajectory.
Despite 76% of the coal fleet being high-efficiency units, rising carbon costs and ammonia-supply uncertainty curb reinvestment appetite. If CCS pilots achieve sub-USD 100 per-tonne costs and capacity-market revenues remain stable, selected ultra-supercritical plants may survive beyond 2030.
By Technology: CHP Captures Industrial Efficiency Gains
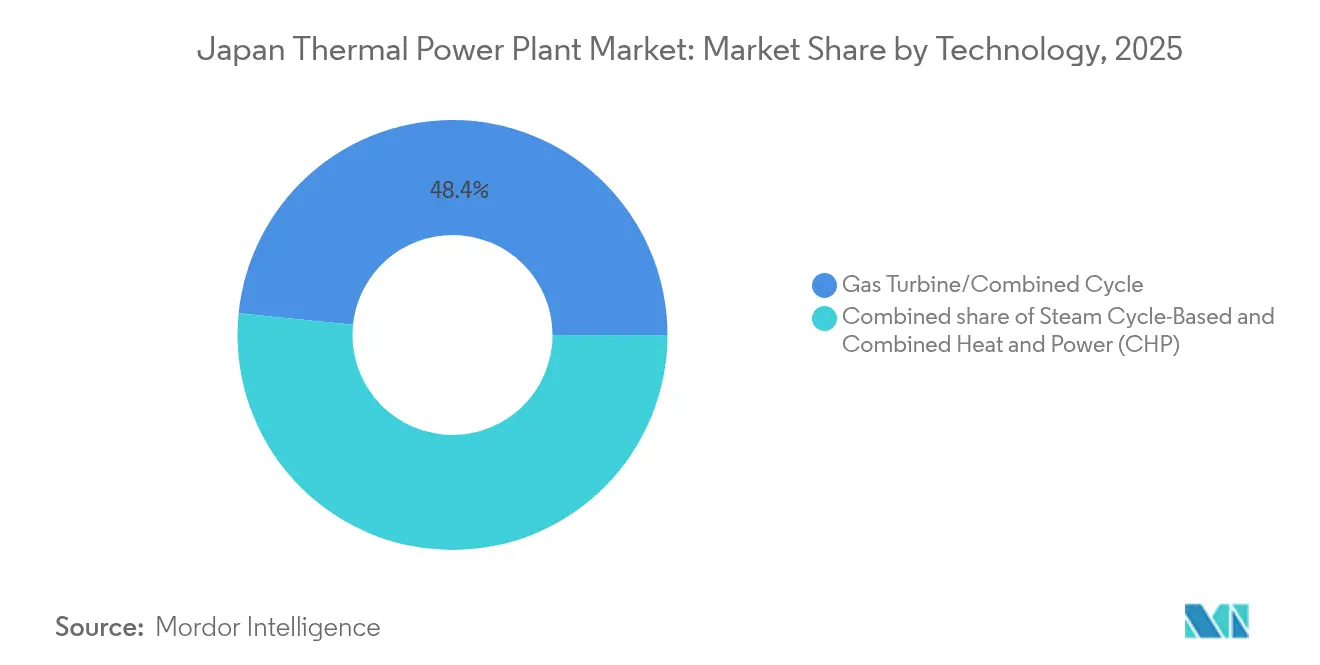
Gas turbine/combined-cycle technology held a 48.38% share in 2025, led by HA-class turbines that reach 64% thermal efficiency. However, combined heat and power is the fastest-growing category, expanding at a 3.75% CAGR as manufacturers hedge against high tariffs. Projects by Hiroshima Gas and the Hyuga Biomass plant show 60-80% efficiency gains.
Small-to-medium CHP units from YANMAR and Aisin proliferate in chemical and steel clusters, while hydrogen household engines advance under METI’s roadmap. Steam-cycle capacity declines in lockstep with coal shutdowns, and IGCC remains niche due to high levelized costs.



By Combustion Method: Turbine-Based Systems Gain Flexibility Premium
Pulverized fuel still comprised 49.65% of capacity in 2025, yet turbine-based combustion is growing at a 2.47% CAGR. GE Vernova HA turbines at Goi and Futtsu ramp from cold start to full load in under 30 minutes, a critical attribute as solar output swings 40 GW within a day.
Fluidized-bed and gasification projects, such as Hirono IGCC, stay demonstration-scale because costs top USD 120 per MWh. Internal-combustion engines remain confined to remote microgrids.
By Application: Peaker Plants Balance Intermittency
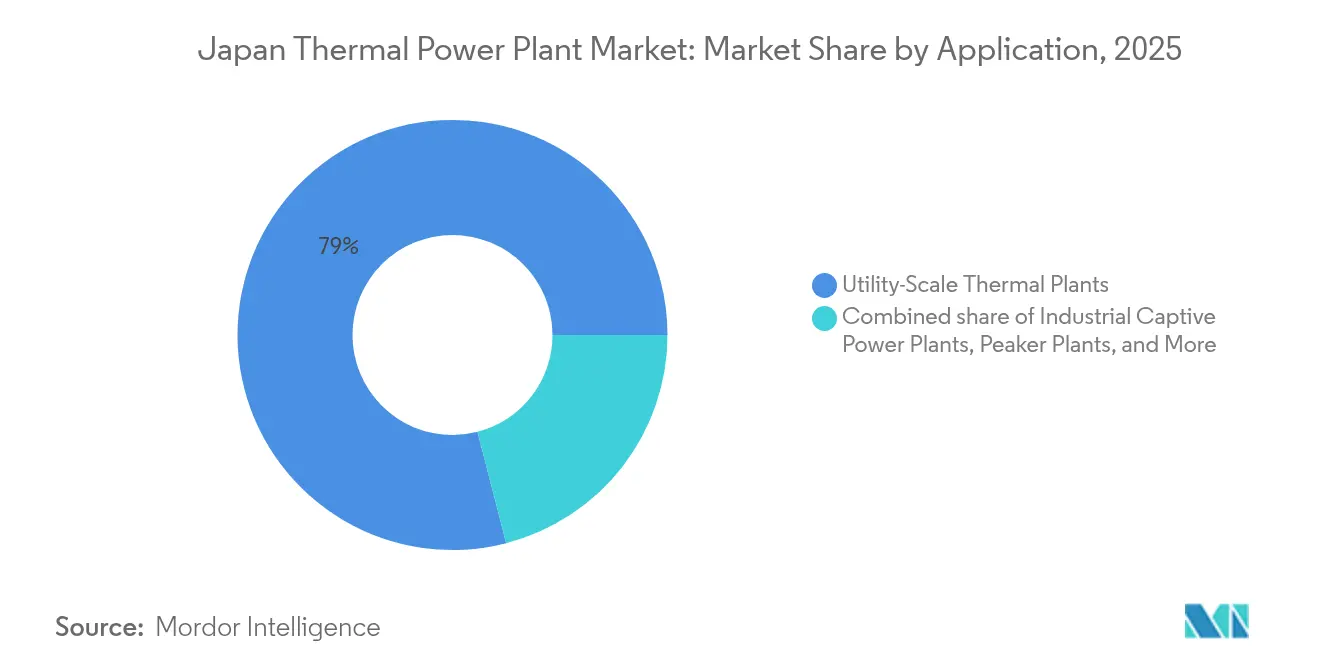
Utility-scale plants still hold a 79.02% share, but peaker plants post a 4.85% CAGR as the grid absorbs more renewables. Capacity-market design pays premiums for rapid-start units, and data-center operators favor dispatchable contracts bundled with certificates. Industrial captive power sees steady uptake of CHP, especially in Aichi, Osaka, and Kanagawa.
Geography Analysis
Tokyo-centric Kanto hosts the largest LNG fleet, including the 2.34 GW Goi plant, and faces a 1.3 GW data-center build-out by 2027. Osaka-based Kansai leads carbon capture, with MHI’s pilot at Himeji No. 2 capturing 5 t/d from 2025. Chubu’s 1.32 GW Chita upgrade underpins LNG demand and feeds into the Tokyo Bay Area CCS export plan to Malaysia.
Hokkaido combines accelerated coal retirements, a 569.4 MW LNG plant brought forward to 2031, and a 20% ammonia co-firing target at Tomato-Atsuma by 2031. Tohoku and Kyushu leverage offshore wind and geothermal, respectively, retiring thermal capacity earlier than the national average. Chugoku remains the testbed for IGCC and gasifier-linked CCS, but cost hurdles limit rollout.
Nuclear restarts shape regional load. Kansai’s Takahama restart in 2023 lifted nuclear to 8.5% of national generation, displacing LNG and worsening the 12 million tpa oversupply. As more reactors return, LNG terminals in regions with slower nuclear progress guard against supply gaps, maintaining geographic imbalances in the Japan thermal power market.
Regulatory Landscape
Japan regulates thermal power plants primarily through the Electricity Business Act. Requirements cover project approvals, environmental impact assessment for new-builds and major modifications, and ongoing technical and safety compliance for core equipment such as boilers and turbines. METI and the Agency for Natural Resources and Energy (ANRE) influence system adequacy through market mechanisms including the Long-Term Decarbonized Power Source Auction launched in January 2024, while the Organization for Cross-regional Coordination of Transmission Operators (OCCTO) coordinates nationwide supply-demand planning.
Decarbonization-linked compliance tightens through the study period, guided by the energy-mix direction in the 7th Strategic Energy Plan. Policy instruments also shift cost recovery toward lower-emission thermal options, including LNG efficiency upgrades, co-firing, and CCUS. Japan's emissions trading system moves to mandatory participation in 2026, increasing the need for verified emissions monitoring and operator compliance planning. Alongside this, government actions focus on maintaining system reliability, including METI confirming a minimum 3% reserve rate for summer 2026.
Competitive Landscape
JERA holds 30% generation share and 59 GW capacity, giving it scale to pilot ammonia and CCS while retiring coal. Kansai Electric partners with MHI on carbon-capture pilots; Chubu Electric co-develops Chita’s gas expansion; and Tohoku and Hokkaido Electric juggle quake-related reliability constraints with decarbonization goals. Independent power producers and trading houses exploit niches in industrial CHP, peakers, and fuel logistics.
Technology vendors shape competition. GE Vernova’s HA turbines anchor high-efficiency builds, MHI pushes hydrogen-ready turbines, and Toshiba supplies steam cycles in Chita’s upgrade. The JPY 1.6 trillion capacity market distributed 72% of payments to fossil plants in 2024, sparking debate that the mechanism delays retirements yet also secures reserve margins demanded by data-center operators.
Marubeni’s 250,000 tpa low-carbon ammonia deal with ExxonMobil and the Tokyo Bay Area CCS consortium indicates that fuel-supply and carbon-transport chains will become profit pools. The Japan thermal power market retains moderate concentration; the top five utilities control about 70% of capacity, enabling coordinated compliance with 2040 decarbonization milestones.(5)Federation of Electric Power Companies, “Press Conference January 2025,” fepc.or.jp
Japan Thermal Power Plant Industry Leaders
Tokyo Electric Power Company Holdings, Inc.,
Toshiba Corp
Mitsubishi Heavy Industries, LTD.
Hitachi, Ltd.
Japan Atomic Power Company
- *Disclaimer: Major Players sorted in no particular order

Market Opportunities and Future Outlook
Near-term opportunities center on decarbonizing and repurposing existing thermal sites, rather than adding net-new baseload coal capacity. Policy-backed monetization routes include the Long-Term Decarbonized Power Source Auction, which provides long-dated capacity revenue for qualifying projects, and the Hydrogen Society Promotion Act enacted in December 2025, which offers price-gap support mechanisms tied to low-carbon fuels such as low-carbon ammonia used for co-firing.
On the project side, ammonia retrofit and fuel-handling scope (boiler modifications, ammonia storage and receiving, safety systems, and controls) continues to expand. JERA has disclosed progress toward 20% ammonia co-firing at Hekinan (Unit 4) targeted for FY2029, supporting an addressable conversion pipeline for OEMs and EPCs covering conversion and reliability engineering. Grid reliability needs and operational flexibility also keep demand for cycling-capable gas and peaking assets, along with upgrades that reduce forced outage risk as dispatch requirements become more volatile. Government actions in March 2026, including a one-year suspension of operational restrictions on inefficient coal plants effective April 2026 to protect supply stability, highlight that capacity value and system adequacy remain binding constraints alongside decarbonization. This sustains demand for life-extension packages, digital monitoring, and integration of abatement pilots (including carbon capture demonstrations at utility sites) as owners balance ETS compliance exposure with dispatchability premiums from capacity mechanisms.
Recent Industry Developments
- July 2026: Mitsubishi Power (Mitsubishi Heavy Industries) won a contract to supply boiler components for converting heavy oil-fired boilers at the Jeddah South and Shuqaiq thermal power plants in Saudi Arabia to dual-fuel operation (natural gas and heavy oil). The award reinforces MHI's active backlog in thermal-asset conversion work, which aligns with Japan's retrofit-led decarbonization approach that prioritizes upgrades over large volumes of new thermal capacity.
- May 2025: Kansai Electric Power launched a CO2 capture pilot plant at the Himeji Second Power Plant with 5-ton-per-day capture capacity in partnership with Mitsubishi Heavy Industries. The pilot strengthens integration know-how for adding capture systems to operating thermal assets and supports the case for abated dispatchable generation under tightening emissions compliance.
- March 2025: JERA initiated a large-scale demonstration of 20% ammonia co-firing at the Hekinan Thermal Power Station. The program moves ammonia co-firing from concept into operational testing at utility scale, increasing demand for fuel logistics, storage, and boiler retrofit solutions that can be replicated across other coal units where economics and supply chains align.


Research Methodology Framework and Report Scope
Market Definition and Coverage
This market covers thermal power plants located in Japan, measured through installed generation capacity and the expected change in that capacity over time, based on operational and planned additions and retirements.
Scope exclusions: We exclude non-thermal generation assets such as hydro, wind, solar, and standalone nuclear units that are not part of thermal capacity accounting.
Segmentation Overview
- By Fuel Type
- Coal-Fired Power Plants
- Natural Gas–Fired Power Plants
- Oil-Fired Power Plants
- By Technology
- Steam Cycle–Based
- Gas Turbine/Combined Cycle
- Combined Heat and Power (CHP)
- By Combustion Method
- Pulverized Fuel (PF) Combustion
- Fluidized Bed Combustion
- Gasification
- Internal Combustion Engines
- Turbine-Based Combustion
- By Application
- Utility-Scale Thermal Plants
- Industrial Captive Power Plants
- Distributed Thermal Plants
- Peaker Plants
Data Sources, Market Sizing, and Validation
Desk Research
Desk research started with public capacity and generation references for Japan, and then it was narrowed to thermal assets so the model stayed aligned with what is installed and operating. Sources used included official statistics and disclosures such as Japan's energy agency publications, the power regulator's market monitoring releases, and grid operator planning documents, along with international datasets from organizations such as the IEA and IRENA.
To avoid mixing plant pipeline announcements with actual capacity, we cross-checked units and commissioning timelines through a combination of utility disclosures, company annual reports, and reliable press coverage. Where helpful, a paid subscription database for plant level and company financial intelligence was used to confirm unit attributes like fuel type, status (operating, planned, retired), and nameplate capacity, especially when public sources were not consistent. These examples are not exhaustive, and many other public sources were also reviewed to collect data, validate assumptions, and clarify open questions.
Primary Interviews and Surveys
Primary work was used to sanity-check the desk model against what practitioners see in Japan, especially around retirement timing, conversion plans, and utilization expectations for major thermal fleets. We spoke with a mix of utility planners, EPC and O&M professionals, fuel and equipment ecosystem participants, and independent advisers so the assumptions on capacity changes and realistic project slippage could be adjusted before finalizing the view.
Distribution of primary research fieldwork respondents
| Company type | Respondent position |
|---|---|
| Top tier: 27% | CXOs: 15% |
| Mid tier: 56% | Functional/Unit leaders: 40% |
| Smaller Players: 17% | Managers: 45% |
Market-Sizing & Forecasting
Sizing is built using a top-down approach where Japan's thermal installed base is reconstructed from plant and unit capacity listings, and then it is moved forward year by year based on additions, retirements, and known project timing. Once that annual capacity path is formed, selective bottom-up checks are applied using sampled unit counts, typical unit sizes by fuel type, and channel checks on major project schedules, which helps correct cases where a single large plant would otherwise distort the trajectory.
Key inputs that influence the model include nameplate capacity by unit, operating status (operational, under construction, announced, retired), expected retirement dates, major conversion or repowering plans, and policy driven constraints that affect which plants remain viable. Because timing matters in a capacity context, we also track commissioning slippage patterns and how grid adequacy needs can affect extension decisions, then reconcile those signals with what interviewees expect.
Forecasting was done using scenario analysis, because thermal capacity in Japan is shaped by policy direction, fuel economics, and unit level decisions that do not always follow smooth historical trends. The base case reflects the most common view shared by practitioners on retirement and additions timing, and where information gaps remain, conservative timing buffers were applied rather than assuming every announced project becomes operational on schedule.
Data Validation & Update Cycle
Validation is handled through multiple checks that compare the model outputs against independent signals, such as publicly reported fleet totals, recent unit commissioning and retirement news, and consistency across different official datasets. When variances show up, the underlying plant list is re-reviewed and, where needed, respondents are re-contacted to confirm whether a change reflects a real event or a reporting lag.
Before sign-off, another analyst reviews the calculation trail, assumptions, and any outliers so errors like double-counting units or mixing gross and net capacity are removed. The report is refreshed annually, and interim updates are triggered when material events occur, such as large retirement announcements, major project cancellations, or policy actions that materially change expected thermal capacity.
Mordor Intelligence's Japan Thermal Power Plant Market Estimate Compared With Other Published Estimates
Published market numbers for Japan thermal power plants can look far apart because the underlying unit of measure and the cut of the market is not the same across sources. Differences usually come from whether the estimate tracks installed capacity, generation output, or investment value, and also from how planned projects and retirements are treated across the forecast window.
The other common reasons behind gaps are practical ones, such as using nameplate capacity versus net capacity, mixing multi-fuel sites without a consistent allocation rule, and applying different timing for currency conversion or update cutoffs when reporting is refreshed. Some sources also lean on announcements without enough validation on whether projects are delayed, downsized, or canceled, which can inflate the forward capacity path.
Benchmark comparison
| Source | Market Size | Gaps in Research Methodology |
|---|---|---|
| Mordor Intelligence | USD 202.50 B (2025) | |
| Industry Association A | USD 210.00 B (2025) | Often aggregates wider thermal-related capacity totals and can mix gross and net reporting conventions, which shifts the installed base upward when compared year on year. |
| Global Consultancy B | USD 190.00 B (2026) | May emphasize operational capacity only and apply earlier retirement timing assumptions, which pulls down the forward year size when delayed projects are not re-included. |
The table shows a spread that largely comes from how capacity boundaries and timing rules are applied, and in Mordor Intelligence's model the figure is tied to Japan thermal installed capacity tracking with explicit unit status updates rather than broad thermal adjacent roll-ups. Once the same unit basis and timing cutoffs are aligned, the remaining variance is usually explained by different assumptions on retirements and project slippage, which can be reviewed and repeated with the same plant list logic.


Key Questions Answered in the Report
How large is Japan's thermal power capacity in 2026?
Installed capacity totals 200.11 GW in 2026.
What CAGR is projected for gas-fired plants through 2031?
Gas-fired capacity is expected to grow at 1.18% CAGR.
Which technology segment is growing the fastest?
Combined heat and power is advancing at 3.75% CAGR as manufacturers seek efficiency gains.
What policy sets Japan's 2040 thermal-generation cap?
The 7th Strategic Energy Plan limits thermal power to 30-40% of generation by 2040.
How does ammonia co-firing help decarbonize coal plants?
Demonstrations such as JERA's 20% test at Hekinan cut CO? while preserving existing assets for grid stability.
When does emissions trading become mandatory?
Japan's ETS shifts from voluntary to mandatory participation in 2026.
Page last updated on:





