Market Overview
| Study Period | 2020 - 2031 |
|---|---|
| Forecast Data Period | 2026 - 2031 |
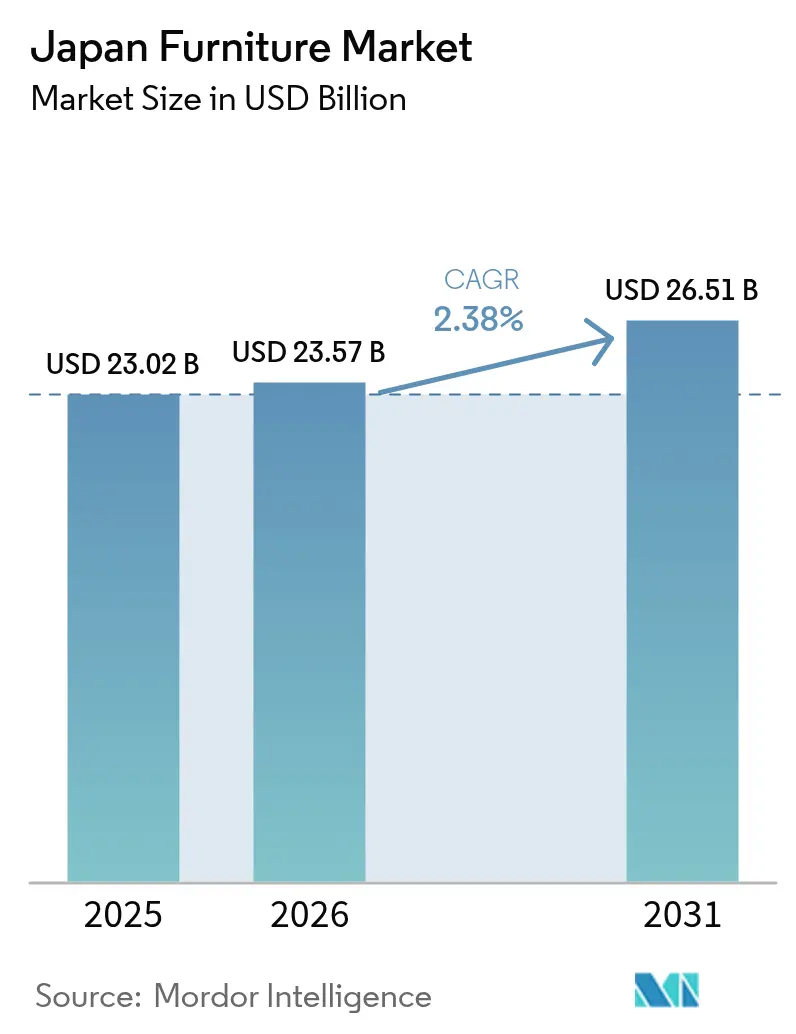
| Base Year Market Size (2025) | USD 23.02 Billion |
| Market Size (2026) | USD 23.57 Billion |
| Market Size (2031) | USD 26.51 Billion |
| Growth Rate (2026 - 2031) | 2.38% CAGR |
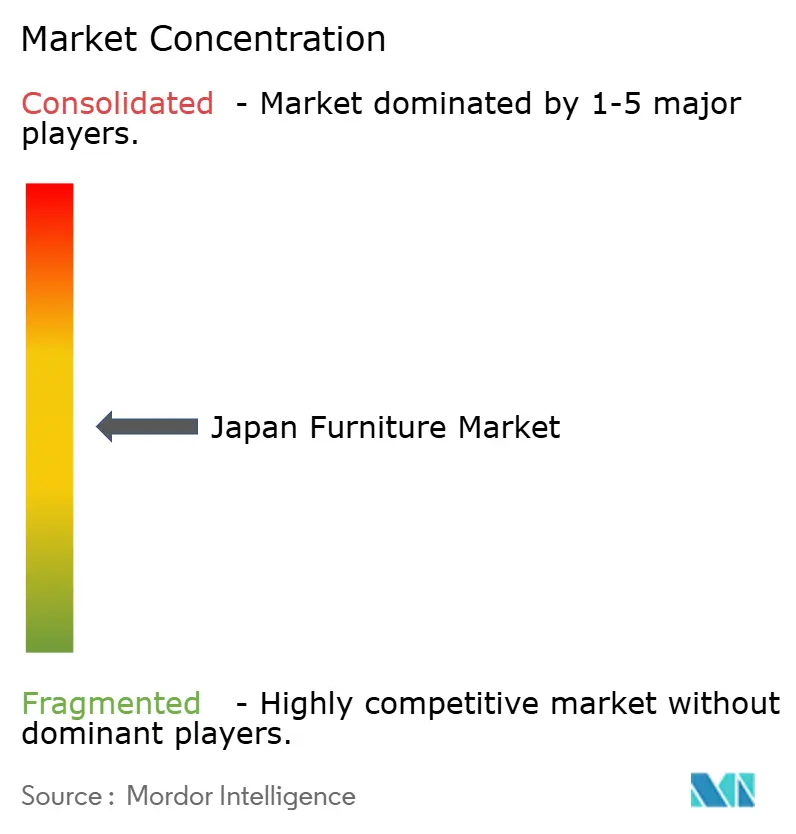
| Market Concentration | Medium |
Major Players *Disclaimer: Major Players sorted in no particular order Image © Mordor Intelligence. Reuse requires attribution under CC BY 4.0. | |
Japan Furniture Market Analysis by Mordor Intelligence
Japan furniture market size in 2026 is estimated at USD 23.57 billion, growing from 2025 value of USD 23.02 billion with 2031 projections showing USD 26.51 billion, growing at 2.38% CAGR over 2026-2031. Steady growth stems from demographic aging, sustained urban migration, and government incentives that favor domestic wood utilization, rather than from short-term macro cycles. Demand is tilting toward space-saving designs, senior-friendly ergonomics, and premium durability, trends that collectively steer product development and pricing. Major players, led by Nitori, IKEA Japan, and MUJI, pursue vertical integration, omnichannel retail, and sustainable material innovation to defend share and improve margins. Currency volatility heightens raw-material cost risks, yet tourism recovery and digital retail adoption provide offsetting opportunities.
Regional dynamics reveal Kantō's commanding 32.51% market share in 2024, anchored by Tokyo's population density of 6,402.6 persons per square kilometer, yet Kyūshū & Okinawa lead regional growth at 3.64% CAGR. This geographic divergence reflects migration patterns where 85.30% of Tokyo's 96,000 annual in-migrants are aged 20-29, creating urban furniture demand, while southern regions benefit from tourism recovery and lifestyle migration[1]Research Institute of Economy, Trade and Industry, “Keys to Successful Regional Revitalization 2.0,” rieti.go.jp, January 8, 2025..
Key Report Takeaways
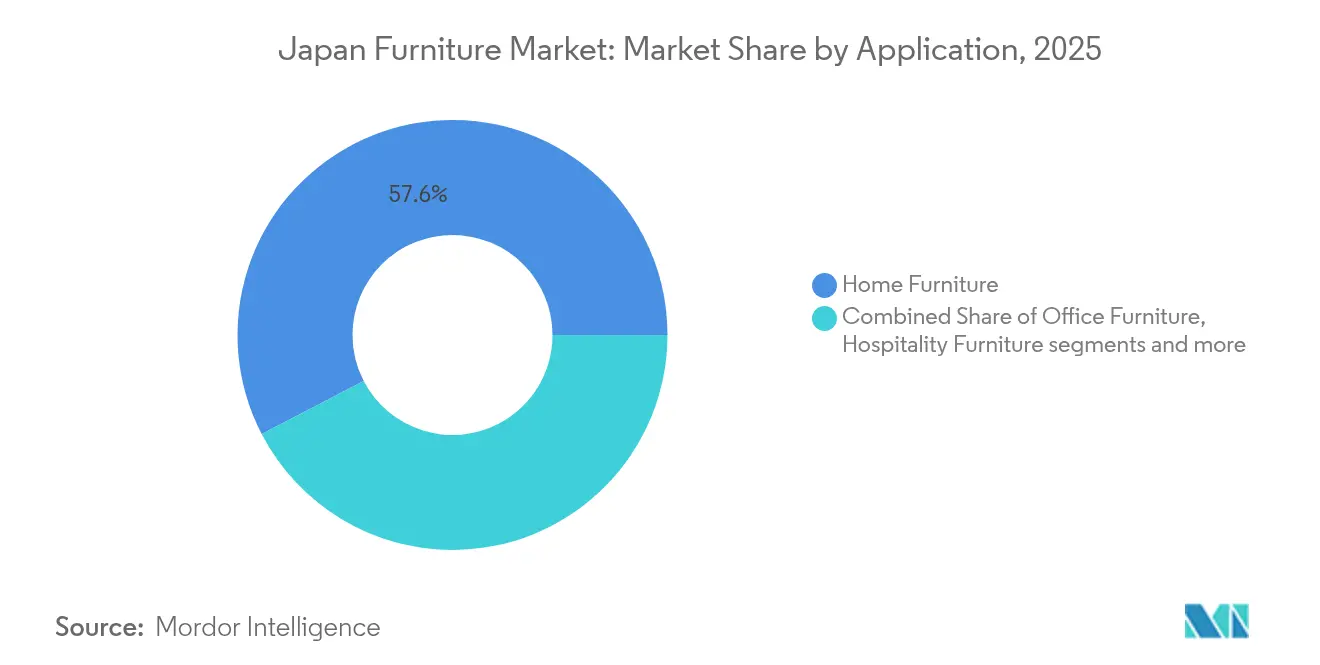
- By application, home furniture led with a 57.62% of the Japan furniture market share in 2025, while healthcare furniture recorded the fastest 3.02% CAGR through 2031.
- By material, wood commanded 60.72% of the Japan furniture market share in 2025, whereas plastic and polymer products delivered the highest 3.55% growth over the same horizon.
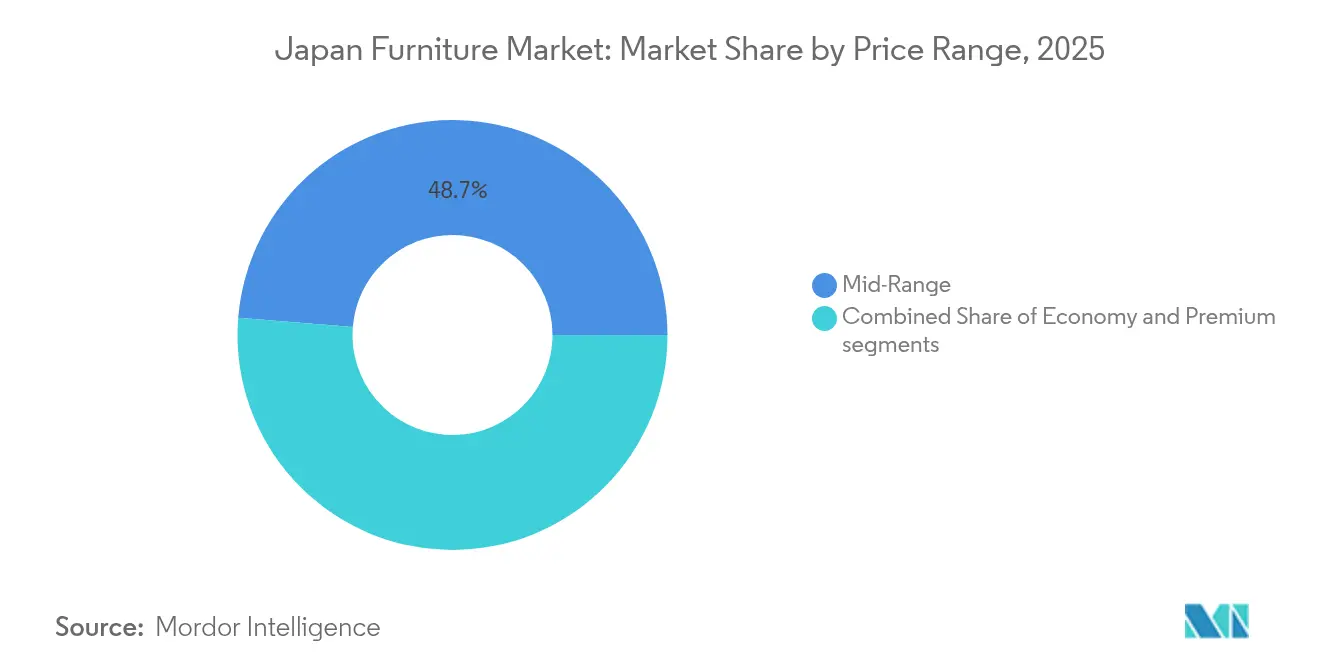
- By price range, the premium segment represented the most rapid 3.38% of the Japan furniture market share in 2025, mid-range segment retained 48.73% of 2025 sales.
- By distribution channel, B2C retail accounted for 72.18% of the Japan furniture market share in 2025 and also posted the leading 3.62% growth rate.
- By region, Kantō captured 32.21% of the Japan furniture market share in 2025, yet Kyūshū & Okinawa advanced at a superior 3.52% CAGR.
Note: Market size and forecast figures in this report are generated using Mordor Intelligence’s proprietary estimation framework, updated with the latest available data and insights as of 2026.
Japan Furniture Market Trends and Insights
Drivers Impact Analysis*
| Driver | (~) % Impact on CAGR Forecast | Geographic Relevance | Impact Timeline |
|---|---|---|---|
| Rapid aging population driving demand for senior-friendly & ergonomic furniture | +0.8% | National, with concentration in rural prefectures | Long term (≥ 4 years) |
| Urban downsizing boosting space-saving modular products | +0.6% | Kantō, Kansai, Chūbu metro areas | Medium term (2-4 years) |
| Government subsidies for domestic wood utilization | +0.4% | National, with emphasis on forestry regions | Medium term (2-4 years) |
| Subscription/rental furniture models gaining traction among millennials | +0.3% | Tokyo, Osaka, Nagoya urban cores | Short term (≤ 2 years) |
| Integration of IoT in care-oriented furniture | +0.2% | National, early adoption in metro areas | Long term (≥ 4 years) |
| Osaka-Kansai Expo 2025 hospitality build-out | +0.1% | Kansai region, spillover to neighboring areas | Short term (≤ 2 years) |
| Source: Mordor Intelligence | |||
Rapid Aging Population Driving Senior-Friendly Furniture
Japan’s population share aged 65 and older surpassed 30% in 2025, and 40.70% of households now include at least one senior member[2]Statistics Bureau of Japan, “Statistical Handbook of Japan 2024,” stat.go.jp. . Manufacturers respond by embedding adjustable heights, grab rails, and anti-microbial surfaces in everyday products, thereby expanding beyond clinical settings. France Bed displayed sixty welfare designs at HCR 2024, while Paramount Bed introduced multi-position electric frames that lessen caregiver strain. Rising longevity fuels premiumization because older buyers place higher value on durability, comfort, and smart-home connectivity. Government policy that favors aging-in-place grants and nursing-home expansion further boosts institutional demand. Collectively, these forces add roughly 0.8 percentage points to the long-term growth outlook.
Urban Downsizing Boosts Space-Saving Modular Products
Tokyo’s population density now exceeds 6,400 persons per square kilometer, and single-person households reached 38.10% of the national total in 2024. Small apartments averaging 20 square meters make multifunctional furniture essential for daily living. MUJI’s renovation partnership with the Urban Renaissance Agency more than doubled rental inquiries for compact open-plan units, confirming market acceptance. Meanwhile, start-ups such as Subsclife rent modular sets that fold into desks or beds, easing relocation for a highly mobile workforce. Space constraints encourage lightweight composites and collapsible frames that reduce delivery costs and enable one-person assembly. These trends collectively contribute an additional 0.60% to the medium-term CAGR.
Government Subsidies for Domestic Wood Utilization
The Forestry Agency’s 2024-2026 grants cover up to 50% of processing-equipment costs for firms that switch from imports to domestic timber. Japan’s forests account for roughly 70% of the land area, yet local utilization rates remain below 35%, leaving significant headroom. Certified sourcing under Japan Agricultural Standards allows furniture producers to command price premiums and accelerate ESG targets. Regional clusters in Hokkaido and Kyūshū add sawmill capacity, shortening lead times and reducing currency-related cost exposure. As buyers increasingly request home-grown species, the subsidy is estimated to lift overall market growth by 0.4 percentage points during the grant window.
Subscription Furniture Models Gain Millennial Traction
Furniture-as-a-service platforms offer one-to-36-month rental terms that align with career mobility and minimalism. Tokyo Lease reports double-digit growth in subscription contracts, driven by urban tenants who relocate every three years on average. Digital interfaces allow customers to visualize layouts via augmented reality and to swap items seamlessly at lease end. Corporate clients adopt the model to furnish co-working hubs that adjust to hybrid-work demand swings. The pay-per-use approach also reduces upfront cash outlays, appealing to startups and newly formed households. Combined, these factors are projected to add 0.3 percentage points to short-term growth.
Restraints Impact Analysis*
| Restraint | (~) % Impact on CAGR Forecast | Geographic Relevance | Impact Timeline |
|---|---|---|---|
| Yen-driven spikes in imported timber costs | -0.4% | Nationwide, import-dependent manufacturers | Short term (≤ 2 years) |
| Decline in new rural housing starts | -0.3% | Non-metro prefectures | Medium term (2-4 years) |
| Stricter 2025 fire-safety standard for upholstered items | –0.2 % | Nationwide, upholstery manufacturers and importers | Medium term (2–4 years) |
| Post-Expo FF&E liquidation glut | –0.2 % | Kansai region, spillover to neighboring areas | Short–medium term (1–3 years) |
| Source: Mordor Intelligence | |||
Yen-Driven Spikes in Imported Timber Costs
A 15% depreciation in the yen between 2023 and 2025 lifted CIF prices for Southeast Asian plywood and North American hardwoods. Smaller manufacturers lack hedging capacity and face margin compression as raw-material outlays rise faster than retail prices. Larger chains mitigate volatility by pre-buying inventory and expanding domestic sourcing under the government’s subsidy framework. Cost pressure is also being offset by surging inbound tourism that increases hospitality demand, yet the net effect still subtracts about 0.4 percentage points from market growth. The restraint is expected to ease once currency rates stabilize or pass-through pricing gains acceptance.
Decline in New Rural Housing Starts
Total housing starts in rural prefectures fell 6.20% year-on-year in 2024, reflecting out-migration and aging demographics. Fewer greenfield homes translate into lower baseline demand for entry-level furnishings. Renovation spending only partly compensates because elderly homeowners favor minimal replacement purchases. Manufacturers serving the economy segment feel the pinch most acutely, whereas premium and healthcare suppliers maintain steadier order books. Government incentives for regional revitalization, including tax breaks for young families relocating outside metros, may soften the impact over time. Even with policy support, the trend is forecast to trim about 0.3 percentage points from medium-term growth.
*Our forecasts treat driver/restraint impacts as directional, not additive. The impact forecasts reflect baseline growth, mix effects, and variable interactions.
Segment Analysis
By Application: Healthcare Furniture Accelerates
Healthcare products expanded at a 3.02% CAGR, surpassing the Japan furniture market size growth rate and highlighting demand for hospital beds, rehab seating, and elderly-care fixtures. Home furniture still contributed the bulk of 2025 revenue at 57.62%, yet aging demographics and institutional investment propel specialized suppliers such as Paramount Bed and France Bed. The premiumization effect manifests clearly here because medical facilities and affluent seniors pay for durability, infection control, and sensor integration. Contract wins for new long-term-care facilities are likely to sustain momentum through 2031. Meanwhile, office and hospitality categories remain sensitive to remote-work trends and post-Expo inventory adjustments, keeping their trajectories below the overall market pace.
The healthcare surge elevates ancillary product lines like over-bed tables and anti-decubitus mattresses, encouraging modular designs that simplify after-sales maintenance. Digital monitoring solutions underpin product differentiation, with sensor-equipped frames transmitting real-time patient data to nursing stations. Government reimbursement programs for assistive devices make these technologies accessible beyond high-end private clinics. Continuous R&D by domestic firms protects market share against low-cost imports. Altogether, healthcare contributes a growing proportion of incremental revenue and mitigates cyclicality in the Japan furniture market.


By Material: Polymer Growth Outpaces Dominant Wood
Wood retained 60.72% of 2025 revenue, underscoring its cultural resonance and subsidy-backed supply, yet plastic and polymer furniture clocked the fastest 3.55% CAGR, outpacing the overall Japan furniture market share leader. Lightweight polymers suit compact apartments, reduce shipping costs, and facilitate recyclable content, aligning with ESG targets of leading retailers. Material suppliers collaborate with universities to create bio-composite resins using food-industry waste, improving strength and lowering carbon footprints. Metal remains vital for office and contract segments that prioritize durability under high-traffic conditions. Engineered bamboo and hybrid laminates occupy niche positions in premium artisanal lines.
Supply-chain dynamics favor domestic processors who qualify for Forestry Agency grants when substituting imported hardwoods with local cedar cores clad in polymer veneer. Consumers respond positively to scratch-resistant, easy-clean coatings that extend product lifespan. Circular economy pilots led by major chains collect post-use polymer pieces for closed-loop recycling, reinforcing brand loyalty. Although polymers begin from a smaller base, their speed of expansion ensures a rising contribution to the Japan furniture market size.
By Price Range: Premium Segment Outperforms
Premium lines registered a 3.38% CAGR, well ahead of mid-range and economy categories, signalling a demand pivot toward craftsmanship and long service life. Higher disposable income among dual-earner urban households supports willingness to spend on designer collaborations and customizable dimensions. Mid-range still accounted for 48.73% of 2025 revenue, but its growth lags as volume shoppers delay replacements. Economy products face a margin squeeze from material inflation and online price transparency.
Premium makers leverage regional heritage, as seen in Hida Sangyo’s domestic hardwood collection, to justify ticket prices often two to three times higher than mass-produced alternatives. Customization to the centimetre and augmented-reality room planners enhances perceived value. After-sales services, including repair and refinishing, further differentiate premium offerings. These attributes ensure that the segment continues to capture an outsized share of incremental growth within the Japan furniture market.
By Distribution Channel: B2C Retail Leads Omnichannel Shift
B2C outlets accounted for 72.18% of 2025 sales and the highest 3.62% CAGR, confirming the power of omnichannel strategies. Online transactions already reach 53.50% of households, aided by 73% digital-payment penetration. Brick-and-mortar showrooms now function as experiential hubs where shoppers finalize choices before ordering digitally for home delivery. Subscription furniture, although counted within B2C, blurs traditional ownership, reinforcing recurring revenue streams.
Retailers capitalize on data analytics to refine product mixes by neighborhood demographics, while same-day delivery partnerships with logistics start-ups raise service expectations. In rural areas, mobile showrooms and pop-up stores bridge access gaps and nurture brand familiarity. Collectively, these innovations ensure B2C remains the engine that drives broader adoption across the Japan furniture industry.
Geography Analysis
Kantō retained the largest 32.21% share of the Japan furniture market in 2025 thanks to Tokyo’s consumer concentration and construction activity. Still, room sizes continue shrinking, shifting demand toward compact, modular pieces that command value premiums. Retail footprints expand vertically in high-rent districts, using digital kiosks to showcase extended assortments beyond what floor space allows. The combination of high spending capacity and small living quarters offers unique margins for clever design.
Kyūshū & Okinawa delivered the fastest 3.52% CAGR and is set to erode Kantō’s dominance gradually. Tourism rebound drives hotel refurbishments, while lifestyle migrants favor detached homes that purchase higher-volume, natural-wood furnishings. Local government incentives for remote workers stimulate demand for home-office solutions. Domestic wood availability in Kyūshū also supports cost-competitive manufacturing, strengthening regional supply chains. These factors create a growth corridor distinct from metropolitan consumption patterns yet integral to the Japan furniture market.
Kansai benefits from Expo 2025 investments, with hospitality projects accelerating order books for contract suppliers, though post-event resales may temporarily weigh on new production. Chūbu leverages automotive prosperity to sustain corporate furniture procurement, whereas Hokkaido and Tōhoku rely on tourism lodges and public-sector refurbishment. Government revitalization grants aim to counterbalance rural declines, but differing population trajectories ensure that strategies must localize assortments and pricing. Overall, geographic diversification provides a demand hedge and underscores the importance of region-specific design language.
Competitive Landscape
The top five companies held a significant share of market revenue in 2024, reflecting a moderately concentrated landscape that still allows space for niche and specialist players. Nitori’s vertically integrated model covering manufacturing, logistics, and IT supports swift introduction of recycled-content product lines aligned with increasingly stringent sustainability goals[4]Nitori Holdings, “Management Policy,” nitorihd.co.jp. . IKEA Japan continues to localize product sizing while adding over 490 new items in April 2025, half of which deploy circular materials. MUJI leverages brand minimalism to expand furniture subscription packages that complement its consumables portfolio.
Healthcare leaders like Paramount Bed and France Bed capitalize on patent-protected mechanisms and long-standing hospital relationships, buffering them against price wars. Office-furniture rivals Kokuyo and Okamura pivot toward wellness-oriented ergonomics to align with corporate health certifications. Start-ups enter through digital-native channels, offering customizable, made-to-order pieces with two-week lead times. Strategic acquisitions, such as 4FUL’s purchase of the Furmeture platform, highlight ongoing consolidation focused on technology assets.
Regulatory frameworks around chemical content and fire safety create compliance costs that discourage low-tier imports, sheltering incumbents. Nevertheless, sustained yen volatility and raw-material inflation test supply-chain resilience. Firms that diversify sourcing, invest in automation, and expand service offerings are positioned to enhance profitability even as competitive intensity remains high within the Japan furniture market.
Japan Furniture Industry Leaders
Nitori
Muji
IKEA Kobe
Okamura Corporation
Kokuyo Co., Ltd.
- *Disclaimer: Major Players sorted in no particular order

Recent Industry Developments
- April 2025: IKEA Japan launched more than 490 new products emphasizing recycled plastics and limited-edition anniversary designs, underscoring its circularity commitment.
- March 2025: Kokuyo was selected for the Health & Productivity Stock 2025 program, reflecting corporate wellness priorities.
- December 2024: Goldwin supplied recycled-PET uniforms for Expo 2025 Osaka pavilion staff, combining sustainability and advanced textiles.
- June 2024: 4FUL acquired Furmeture’s online custom-furniture business, integrating centimeter-level ordering and AR tools.


Japan Furniture Market Report Scope
The furniture market consists of various movable pieces of furniture such as chairs, desks, beds, cabinets, etc. They are used for various human activities like sleeping, sitting, and storage.
The Japanese furniture market is segmented by material, application, and distribution channel. The market by material is further segmented into wood, metal, plastic, and other furniture. The market by application is further segmented into home furniture, office furniture, hospitality furniture, and other furniture. The market by distribution channel is further segmented into supermarkets, hypermarkets, specialty stores, online, and other distribution channels. The market size and forecasts are provided in terms of value (USD) for all the above segments.
By Application
| Home Furniture | Chairs |
| Tables (side, coffee, dressing, etc.) | |
| Beds | |
| Wardrobe | |
| Sofas | |
| Dining Tables/Dining Sets | |
| Kitchen Cabinets | |
| Other Home Furniture (bathroom, outdoor, etc.) | |
| Office Furniture | Chairs |
| Tables | |
| Storage Cabinets | |
| Desks | |
| Sofas & Other Soft Seating | |
| Other Office Furniture | |
| Hospitality Furniture | |
| Educational Furniture | |
| Healthcare Furniture | |
| Other Applications (public places, retail malls, govt offices, etc.) |
By Material
| Wood |
| Metal |
| Plastic & Polymer |
| Other Materials |
By Price Range
| Economy |
| Mid-Range |
| Premium |
By Distribution Channel
| B2C / Retail | Home Centers |
| Specialty Furniture Stores | |
| Online | |
| Other Distribution Channels | |
| B2B / Project |
By Region
| Hokkaido |
| Tōhoku |
| Kantō |
| Chūbu |
| Kansai |
| Chūgoku |
| Shikoku |
| Kyūshū & Okinawa |
| By Application | Home Furniture | Chairs |
| Tables (side, coffee, dressing, etc.) | ||
| Beds | ||
| Wardrobe | ||
| Sofas | ||
| Dining Tables/Dining Sets | ||
| Kitchen Cabinets | ||
| Other Home Furniture (bathroom, outdoor, etc.) | ||
| Office Furniture | Chairs | |
| Tables | ||
| Storage Cabinets | ||
| Desks | ||
| Sofas & Other Soft Seating | ||
| Other Office Furniture | ||
| Hospitality Furniture | ||
| Educational Furniture | ||
| Healthcare Furniture | ||
| Other Applications (public places, retail malls, govt offices, etc.) | ||
| By Material | Wood | |
| Metal | ||
| Plastic & Polymer | ||
| Other Materials | ||
| By Price Range | Economy | |
| Mid-Range | ||
| Premium | ||
| By Distribution Channel | B2C / Retail | Home Centers |
| Specialty Furniture Stores | ||
| Online | ||
| Other Distribution Channels | ||
| B2B / Project | ||
| By Region | Hokkaido | |
| Tōhoku | ||
| Kantō | ||
| Chūbu | ||
| Kansai | ||
| Chūgoku | ||
| Shikoku | ||
| Kyūshū & Okinawa | ||


Key Questions Answered in the Report
How large is the Japan furniture market in 2026?
The Japan furniture market size reached USD 23.57 billion in 2026 and is projected to hit USD 26.51 billion by 2031.
What application segment is growing fastest?
Healthcare furniture leads with a 3.02% CAGR through 2031, driven by aging demographics and medical-facility investment.
Which material is gaining share the quickest?
Plastic and polymer furniture is expanding at 3.55% CAGR as lightweight, recyclable designs meet urban and sustainability needs.
Which region shows the strongest growth outlook?
Kyūshū & Okinawa post the highest 3.52% CAGR thanks to tourism recovery and lifestyle migration.
How is omnichannel retail influencing sales?
B2C omnichannel strategies now drive 72.18% of revenue, with online orders reaching more than half of all households and same-day delivery becoming standard.
Page last updated on:


