Market Overview
| Study Period | 2019 - 2031 |
|---|---|
| Forecast Data Period | 2026 - 2031 |
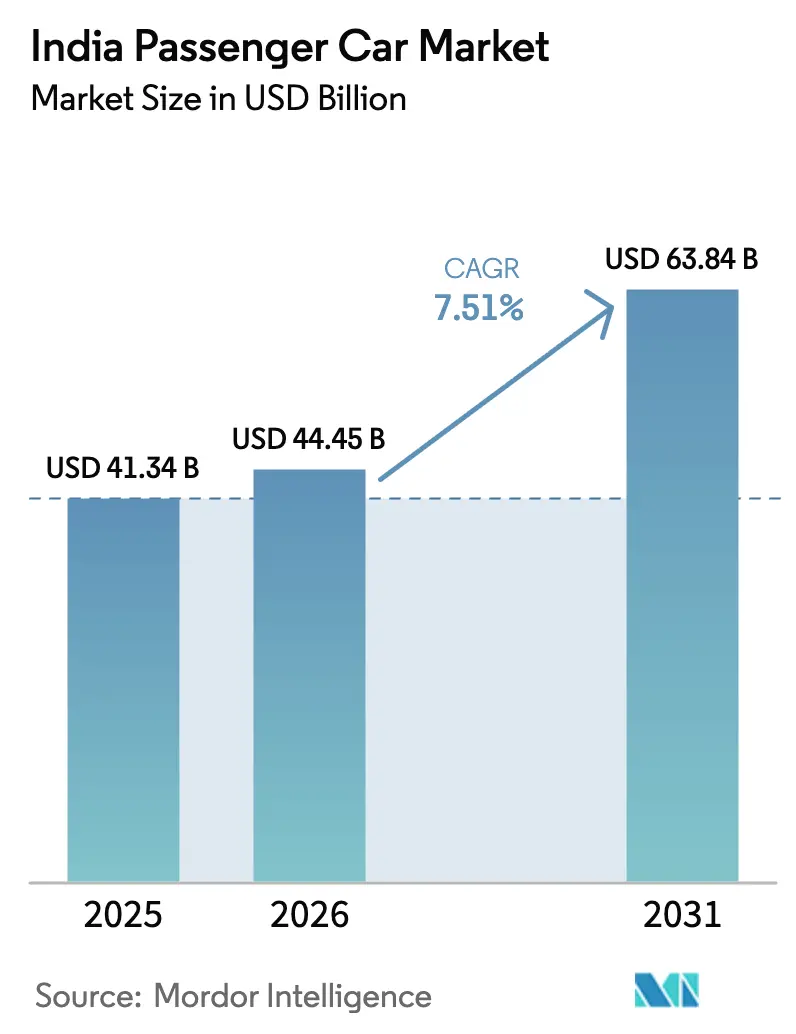
| Base Year Market Size (2025) | USD 41.34 Billion |
| Market Size (2026) | USD 44.45 Billion |
| Market Size (2031) | USD 63.84 Billion |
| Growth Rate (2026 - 2031) | 7.51% CAGR |
| Market Concentration | Medium |
Major Players*Disclaimer: Major Players sorted in no particular order Image © Mordor Intelligence. Reuse requires attribution under CC BY 4.0. | |
India Passenger Car Market Analysis by Mordor Intelligence
The Indian passenger car market size is expected to grow from USD 41.34 billion in 2025 to USD 44.45 billion in 2026 and is forecast to reach USD 63.84 billion by 2031 at a 7.51% CAGR over 2026–2031. Rapid migration from hatchbacks toward compact SUVs, sustained export momentum, and targeted electrification incentives are sustaining topline growth even as discount-led price wars drag on margins. Younger, digitally savvy buyers increasingly choose connected features and online configurators, compelling original-equipment manufacturers (OEMs) to shorten model-refresh cycles and embed software-defined architectures. Capacity expansions at Maruti Suzuki and Hyundai, coupled with Mahindra’s SUV-skewed line-up, have consolidated output, while localized battery-pack assembly is lowering the electric-vehicle (EV) bill-of-materials. Semiconductor bottlenecks in advanced driver-assistance controllers and patchy fast-charger uptime outside Tier-1 cities weigh on premium-segment production, yet policy support for CNG and electric powertrains continues to diversify propulsion mixes.
Key Report Takeaways
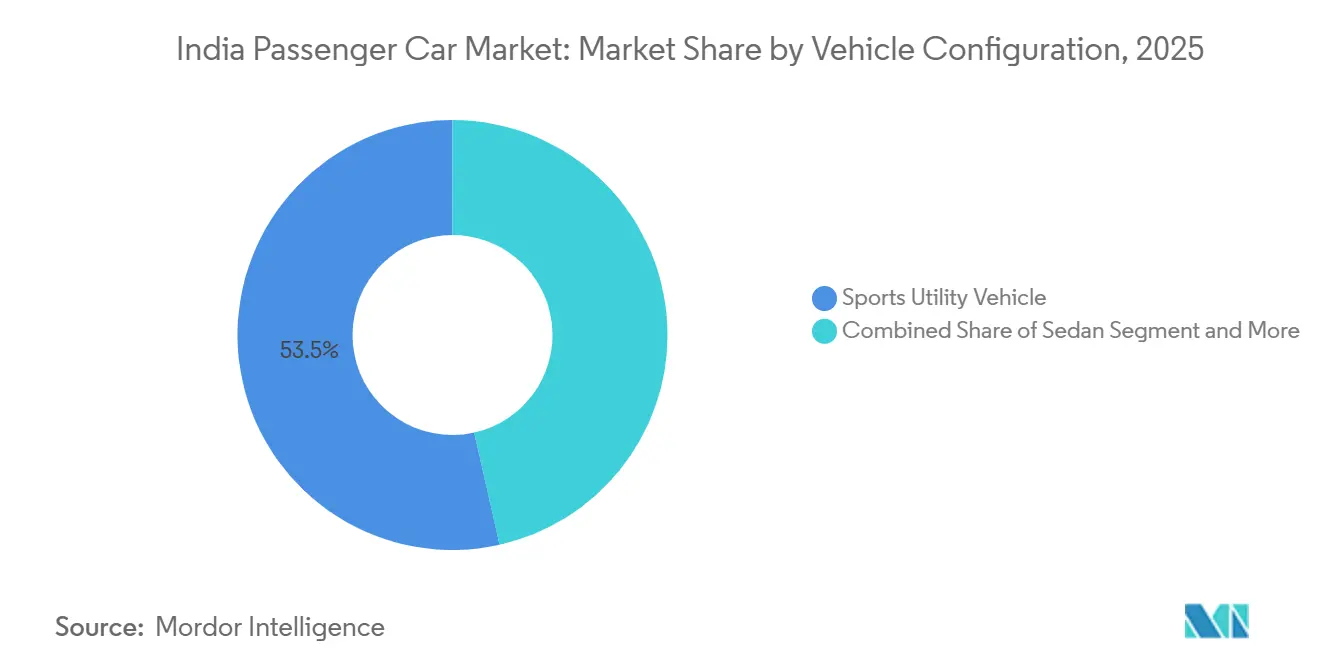
- By vehicle configuration, Sports Utility Vehicles commanded 53.47% of the Indian passenger car market share in 2025, and the segment is projected to expand at a 7.53% CAGR through 2031.
- By propulsion type, Internal Combustion Engine cars retained 83.35% of the Indian passenger car market size in 2025, whereas battery-electric models are forecast to grow at a 7.61% CAGR to 2031.
- By transmission type, manuals led with a 57.61% revenue share in 2025, while automatics are advancing at a 7.57% CAGR through 2031.
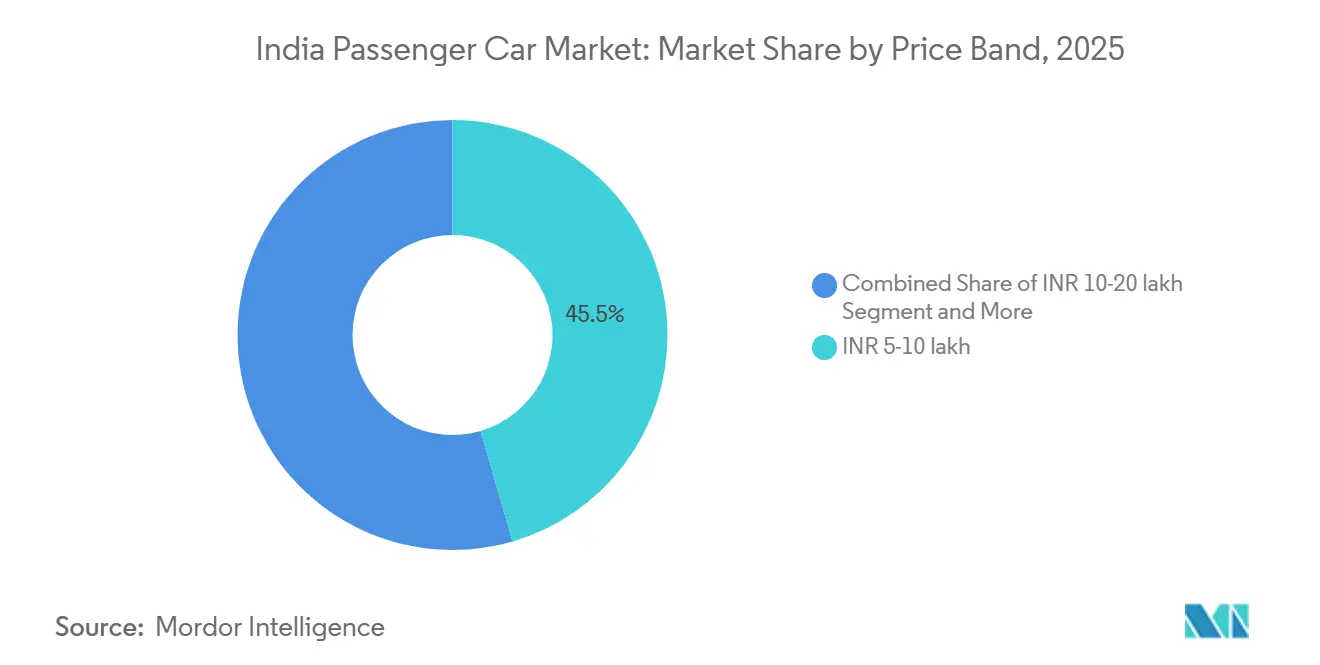
- By price band, the INR 5-10 lakh bracket accounted for 45.47% of the 2025 value; the INR 10-20 lakh category is expected to record a 7.65% CAGR to 2031.
- By ownership model, personal purchases delivered 87.17% of 2025 volumes, whereas fleet demand is poised for a 7.67% CAGR on the back of ride-hailing electrification targets.
Note: Market size and forecast figures in this report are generated using Mordor Intelligence’s proprietary estimation framework, updated with the latest available data and insights as of January 2026.
India Passenger Car Market Trends and Insights
Drivers Impact Analysis*
| Driver | (~) % Impact on CAGR Forecast | Geographic Relevance | Impact Timeline |
|---|---|---|---|
| Surging Compact-SUV Supply | +1.2% | National, with peak adoption in urban and semi-urban clusters | Short term (≤ 2 years) |
| CNG Infrastructure Build-Out | +0.9% | North and West India (Delhi-NCR, Gujarat, Maharashtra, Uttar Pradesh) | Medium term (2-4 years) |
| Digital-First Aspirational Younger Buyers | +0.8% | National, concentrated in metros and Tier-1 cities | Medium term (2-4 years) |
| E-Commerce-Fuelled Urban Gig-Fleet Demand | +0.7% | Metro cities and Tier-1 urban centers | Short term (≤ 2 years) |
| OEMs Leveraging India as Global Small-Car Export Hub | +0.6% | National manufacturing hubs (Gujarat, Tamil Nadu, Haryana) | Long term (≥ 4 years) |
| In-House Software-Defined-Vehicle Stacks | +0.5% | National, led by OEMs with established R&D centers | Long term (≥ 4 years) |
| Source: Mordor Intelligence | |||


Surging Compact-SUV Supply From 4,000-4,400 mm Length Bracket
Lower GST-plus-cess slabs spurred several launches in the sub-4-meter SUV segment during the forecast period. Recently launched models, including Maruti Fronx, Hyundai Exter, Tata Punch, Mahindra XUV 3XO, and Kia Sonet, collectively achieved significant sales volumes, with each benefiting from notable tax savings [1]“GST and Cess Schedule for Automobiles,” Central Board of Indirect Taxes and Customs, cbic.gov.in . Mahindra’s XUV 3XO, highlighting the strong demand for feature-rich compact SUVs, received an overwhelming number of reservations shortly after its launch. While shared architectures, such as Hyundai’s K1 and Maruti’s Heartect, spread tooling costs across various models, this clustering heightened price competition. As brands offered bundled accessories and extended warranties to manage rising inventories, transaction prices in the mid-range segment experienced a slight decline.
CNG Infrastructure Build-Out Reducing Running-Cost Parity Time
Between early 2024 and late 2025, the number of CNG outlets experienced significant growth, offering a notable cost advantage over gasoline prices at urban pumps. For regular users, the payback period for factory-fitted CNG cars has become considerably shorter. This trend has driven Maruti to achieve substantial CNG sales across multiple models [2]“City Gas Distribution Expansion Status,” Petroleum & Natural Gas Regulatory Board, pngrb.gov.in . Meanwhile, Hyundai and Tata have expanded their offerings by introducing CNG options in several models. Looking ahead, regulators have set ambitious targets for station expansion by the end of the decade. However, challenges persist: trade-offs like reduced boot space and slight power reductions have limited CNG adoption to a fraction of total volumes.
Digital-First Aspirational Younger Buyers
Millennials and Gen-Z customers, now accounting for a significant portion of sales, prioritize connected infotainment, voice assistants, and seamless online purchasing. Maruti Suzuki revealed that a considerable share of its Fronx reservations came through its web configurator, bypassing traditional showroom negotiations. Hyundai reported a substantial number of active users of its BlueLink telematics suite, highlighting a surge in engagement with features like remote diagnostics and geo-fencing. Tata Motors, with its ChatGPT-based assistant in the Nexon EV, significantly reduced in-cabin command time, underscoring the software's increasing value. Given the amplified sway of social media, a single viral review can influence a large number of bookings in mere days. This urgency has led OEMs to shorten model-refresh cycles from the traditional timeline to a more frequent schedule. Consequently, marketing budgets are shifting towards digital channels, sidelining traditional above-the-line advertising.
E-Commerce-Fuelled Urban Gig-Fleet Demand
In 2025, ride-hailing and last-mile delivery fleets, including major players like Ola, Uber, and BluSmart, collectively acquired a significant number of cars, emphasizing their shift towards asset-light operating models. BluSmart, for instance, operates a substantial fleet of battery-electric sedans across Delhi-NCR and Bengaluru, touting a total cost of ownership that's considerably lower than that of similar CNG vehicles over a multi-year span. Tata's Xpres-T EV, tailored for fleet use, experienced notable sales growth, driven by an attractive long-term battery warranty that resonates with professional drivers. Additionally, the PM E-DRIVE scheme offers demand incentives per kilowatt-hour, with a cap per vehicle, effectively reducing acquisition costs for operators.
Restraints Impact Analysis*
| Restraint | (~) % Impact on CAGR Forecast | Geographic Relevance | Impact Timeline |
|---|---|---|---|
| Dealer Inventory Overhang More Than 50 Days Pressuring OEM Production | -0.6% | National, acute in North and West India | Short term (≤ 2 years) |
| Intensifying Price War in Entry Hatchbacks Squeezing Margins | -0.5% | National, concentrated in sub-INR 8 lakh segment | Short term (≤ 2 years) |
| Long-Tail Chip Shortages | -0.4% | National, affecting premium and mid-size segments | Medium term (2-4 years) |
| Patchy Fast-Charger Uptime | -0.3% | Tier-2 and Tier-3 cities, rural corridors | Medium term (2-4 years) |
| Source: Mordor Intelligence | |||
Dealer Inventory Overhang More Than 50 Days Pressuring OEM Production
Channel stock increased significantly, exceeding the usual levels, which resulted in a substantial number of unsold units. To address this issue, Maruti reduced its January 2026 production by a notable percentage. At the same time, Hyundai and Tata implemented measures to support dealer liquidity by extending floor-plan tenures, which led to additional interest expenses per car. Throughout 2025, the Reserve Bank of India maintained the repo rate at a steady level, keeping auto-loan rates relatively high and suppressing festive demand. During the last quarter of 2025, significant discounting caused a noticeable decline in OEM gross margins.
Intensifying Price War in Entry Hatchbacks Squeezing Margins
In 2025, the sub-INR 8 lakh hatchback market experienced a notable decline, as entry-level buyers increasingly shifted their preferences towards compact SUVs. Significant discounts on models like the Maruti Alto and Hyundai i10 NIOS further compressed OEM margins to minimal levels [3]“Cost Structure and Margin Outlook 2025,” Automotive Component Manufacturers Association, acma.in . Rising steel and electronics costs, coupled with limited pricing power, signal structural profitability challenges for the body style.
*Our forecasts treat driver/restraint impacts as directional, not additive. The impact forecasts reflect baseline growth, mix effects, and variable interactions.
Segment Analysis
By Vehicle Configuration: Compact SUVs Redefine Volume Leadership
Sports Utility Vehicles controlled 53.47% of 2025 deliveries within the Indian passenger car market size and should advance at a 7.53% trajectory to 2031. Sub-4-meter SUVs like the Maruti Fronx, Hyundai Exter, and Tata Punch benefit from a reduced GST-plus-cess slab. This tax break significantly lowers ownership costs over the vehicle's lifecycle, making these SUVs more accessible to aspirational households. Mahindra's Scorpio-N and XUV700 have demonstrated strong demand, highlighting the appeal of rear-wheel-drive and 4x4 features in the premium segment. Meanwhile, hatchbacks have seen a decline in market share, reflecting a trend of first-time buyers shifting towards SUVs. Sedans have maintained a stable presence, supported by consistent fleet demand for the Maruti Dzire, while multi-purpose vehicles continue to address the mobility needs of joint families, particularly in rural areas.
The surge in SUV popularity has led to shared platforms; Hyundai's K1 platform now underpins multiple models, achieving significant reductions in per-unit R&D costs. Maruti's Heartect platform, enabling flexible model transitions, has enhanced production efficiency at its Gujarat plant. In this competitive landscape, the performance of models like the Nissan Magnite and Renault Kiger underscores the importance of service accessibility over product differentiation. Furthermore, innovative body styles, such as Tata's Curvv EV coupe, which has attracted considerable consumer interest, indicate potential growth opportunities even as the segment matures.


By Propulsion Type: Electrification Gains Traction Amid ICE Resilience
Internal Combustion Engines kept 83.35% command in 2025; however, EVs are slated to record a 7.61% CAGR through 2031, aided by substantial PM E-DRIVE demand incentives. Tata Motors dominated the EV market, accounting for a significant share of sales with strong performance across its Nexon EV, Tiago EV, and Punch EV models. By strategically pricing these models in the affordable range, Tata Motors successfully broadened its market reach. In contrast, Hyundai's Ioniq 5 and Kia's EV6, positioned in the premium price segment, managed to capture only a limited volume. Among internal combustion engine (ICE) vehicles, gasoline remained the most preferred choice, followed by diesel, while CNG gained notable traction due to Maruti’s bi-fuel offerings. This highlights the varied choices available to consumers.
The hybrid segment experienced notable growth, led by the Toyota Hyryder, which offers significant fuel efficiency improvements compared to gasoline and benefits from favorable tax rates. However, plug-in hybrids and fuel-cell vehicles have struggled to gain traction, hindered by their high initial costs and limited infrastructure. While clear policies on future emission standards will shape medium-term investment decisions in propulsion technologies, the current resilience of ICE vehicles suggests a gradual transition rather than a sudden shift.
By Transmission Type: Automatics Cascade into Mass Segments
Manuals retained a 57.61% revenue share in 2025, but automatic penetration is rising due to urban-traffic fatigue and cascading technology costs. Torque-converter units captured the majority of Mahindra’s Scorpio-N and XUV700 sales, highlighting willingness to pay decent premiums for smoothness. Dual-clutch transmissions posted a take rate on the Kia Seltos and Volkswagen Taigun, signalling enthusiast appeal in the INR 10-15 lakh corridor. CVTs underpin Toyota Hyryder adoption, while affordable AMTs added 180,000 units to Maruti’s hatchbacks. The Bharat NCAP ESC mandate, effective October 2025, elevated manual variant costs, narrowing price spreads and accelerating automatic uptake.
Automatic growth correlates with software-defined features, with a CAGR of 7.57% through 2031; over-the-air updates can recalibrate shift logic for efficiency gains, creating post-sale revenue opportunities. As urban congestion intensifies, automatic adoption in the Indian passenger car market is set to mirror smartphone-grade upgrade cycles rather than traditional mechanical refresh periods.
By Price Band: Premiumization Drives INR 10-20 Lakh Surge
The INR 5-10 lakh stratum accounted for 45.47% of 2025 spending, yet the INR 10-20 lakh bracket is forecast to rise at 7.65% as buyers trade up for ADAS, panoramic roofs, and connected features. Hyundai Creta emerged as a market leader, followed closely by Kia Seltos, with both models collectively holding a significant share. Maruti Grand Vitara demonstrated its brand's ability to compete in the higher price range. In contrast, the market segment for entry-level vehicles saw a notable decline, as aspirational buyers increasingly opted for compact SUVs that offer enhanced safety features over basic hatchbacks.
Premiumization is driving changes in financing patterns. A substantial proportion of transactions for lower-priced vehicles were financed through loans, whereas a smaller share of high-end vehicle purchases relied on financing, as affluent buyers often prefer outright payments to avoid interest costs. Additionally, subscription and leasing services, while still a niche segment, are gaining popularity among corporate executives and expatriates who prioritize flexibility over ownership.
By Ownership Model: Fleet Electrification Accelerates
Personal purchases delivered 87.17% of 2025 registrations, yet fleet volumes are on a 7.67% upswing as CO₂ targets drive electrification mandates. The Tata Xpres-T EV and upcoming Ola Electric sedans promise acquisition prices of under INR 10 lakh for operators, backed by eight-year battery warranties that secure residual value.
Corporate leasing expanded at a minimal rate in 2025 as firms rotated diesel sedans out in favor of hybrids to satisfy ESG scorecards. Subscription programs from Hyundai and Mahindra commanded monthly rentals of INR 25,000-35,000 for fully bundled mobility, appealing to millennials wary of long-term capital commitments.
Geography Analysis
In 2025, northern and western corridors dominated India's passenger car market, accounting for a significant share of total volumes. This surge was fueled by rising disposable incomes, a dense network of CNG stations, and proactive EV subsidies. In Delhi-NCR, registrations were bolstered by an extensive CNG infrastructure and state incentives that effectively reduced the drive-away cost of EVs. Gujarat boasted the nation's highest EV mix, supported by a robust charging network and a long-term exemption from road tax. Meanwhile, Maharashtra saw a strong preference for compact SUVs, driven by the need for ground clearance on monsoon-damaged roads.
Southern states contributed notably to the 2025 output. Bengaluru witnessed a trend where software professionals leaned towards premium SUVs and EVs. Tamil Nadu, benefiting from substantial subsidies and a growing network of fast-charging stations, recorded a significant number of EV registrations. The local supply was further bolstered by Hyundai's nearby production base. In contrast, eastern India lagged with a smaller market share, hampered by lower income levels and limited charging infrastructure. Kolkata, however, managed to maintain a preference for CNG sedans. Central and northeastern states accounted for a smaller portion of the market, with a preference for multi-purpose vehicles tailored for rural transport and agricultural needs.
Divergent state policies are leading to inconsistent momentum across regions. Maharashtra's reduction in EV grants in 2024 resulted in a noticeable slowdown in EV penetration. Conversely, Karnataka's decision to extend incentives until 2027 helped maintain a strong EV market share. Gujarat's mandate that a portion of government fleet purchases be electric led to a surge in bulk orders. Additionally, the Bharat NCAP crash-rating initiative is urging OEMs to enhance safety features, a move that's particularly resonating in knowledge-driven cities like Pune and Bengaluru.
Competitive Landscape
The Indian passenger car market is witnessing a shift in dynamics. While Maruti Suzuki, Mahindra, and Hyundai dominated with a significant share of sales, the rising popularity of SUVs and electric vehicles (EVs) is altering the landscape. Maruti, with its extensive network of service outlets and a diverse lineup boasting several CNG models, finds its SUV penetration trailing behind Mahindra. Mahindra, in contrast, has successfully positioned itself, deriving a substantial portion of its sales mix from SUVs. Tata, holding a commanding position in the EV segment, is not only cushioning the decline of diesel but also justifying its hefty investments in batteries and software. Meanwhile, Hyundai and Kia are strategically aligning with CARIAD and Mobileye to replicate advanced software-defined architectures.
As dealer stocks reached higher-than-usual levels, the competitive landscape intensified, leading to price reductions and production adjustments. Hyundai's ambitious IPO in recent times is paving the way for localized battery packs and a lineup of EV launches planned for the near future. Chinese players, BYD and MG (under SAIC), are making waves by introducing blade and sodium-ion batteries, both priced competitively. This move positions them to potentially roll out EVs at more affordable price points in the coming years. The dealer landscape is also transforming: Maruti's innovative augmented-reality configurators are significantly reducing test-drive lead times, and Hyundai's digital push, with a notable portion of bookings online, is trimming customer acquisition costs.
However, the industry grapples with rising compliance costs. New mandates like six airbags and aspirations for a Bharat NCAP five-star rating are inflating costs per unit. This trend seems to favor larger volume players who can better absorb these expenses. There's also a noticeable gap in the market: the three-row SUV segment, priced in the mid-range, currently sees competition from only a few models. Yet, with BYD's eMAX 7 set to debut in the near future, the landscape is poised for fresh competition.
India Passenger Car Industry Leaders
Hyundai Motor India Limited
Kia Corporation
Mahindra & Mahindra Limited
Maruti Suzuki India Limited
Tata Motors Limited
- *Disclaimer: Major Players sorted in no particular order


Recent Industry Developments
- January 2026: Mahindra launched the XUV 3XO EV with a 39.4 kWh battery and claimed 456 km ARAI range, opening new bookings for sub-compact electric SUVs.
- January 2026: Mahindra unveiled the XUV 7XO facelift featuring a triple-screen cockpit and advanced ADAS, with deliveries slated to commence in April 2026.
- February 2025: Maruti Suzuki began production at its Kharkhoda plant, adding 250,000 units of Brezza capacity and lifting group capability to 2.6 million units.


India Passenger Car Market Report Scope
The scope of the report includes Vehicle Configuration (Hatchback, MPV, Sedan, and SUV), Propulsion Type (Hybrid & Electric and ICE), Transmission (Manual, Automatic, AMT/IMT, and DCT/CVT), Price Band (Less Than or Equal To INR 5 Lakh and More), and Ownership (Personal and Fleet).
By Vehicle Configuration
| Hatchback |
| Multi-Purpose Vehicle |
| Sedan |
| Sports Utility Vehicle |
By Propulsion Type
| Hybrid & Electric Vehicles | Battery Electric |
| Hybrid Electric | |
| Plug-in Hybrid Electric | |
| Fuel-cell Electric | |
| Internal Combustion Engine (ICE) | CNG |
| Diesel | |
| Gasoline | |
| LPG |
By Transmission Type
| Manual |
| Automatic (Torque-Converter) |
| Automated-Manual / iMT |
| Dual-Clutch / CVT |
By Price Band
| Less than or equal to INR 5 lakh |
| INR 5–10 lakh |
| INR 10–20 lakh |
| More than INR 20 lakh |
By Ownership Model
| Personal |
| Fleet (Ride-hailing, Subscription, Leasing) |
| By Vehicle Configuration | Hatchback | |
| Multi-Purpose Vehicle | ||
| Sedan | ||
| Sports Utility Vehicle | ||
| By Propulsion Type | Hybrid & Electric Vehicles | Battery Electric |
| Hybrid Electric | ||
| Plug-in Hybrid Electric | ||
| Fuel-cell Electric | ||
| Internal Combustion Engine (ICE) | CNG | |
| Diesel | ||
| Gasoline | ||
| LPG | ||
| By Transmission Type | Manual | |
| Automatic (Torque-Converter) | ||
| Automated-Manual / iMT | ||
| Dual-Clutch / CVT | ||
| By Price Band | Less than or equal to INR 5 lakh | |
| INR 5–10 lakh | ||
| INR 10–20 lakh | ||
| More than INR 20 lakh | ||
| By Ownership Model | Personal | |
| Fleet (Ride-hailing, Subscription, Leasing) | ||


Market Definition
- Vehicle Type - The category includes passenger cars.
- Vehicle Body Type - This include various body types such as Hatchbacks, Sedans, Sports Utility Vehicles, and Multi-purpose Vehicles.
- Fuel Category - The category includes various fuel types such as Gasoline, Diesel, LPG (Liquefied Petroleum Gas), CNG (Compressed Natural Gas), HEV (Hybrid Electric Vehicles), PHEV (Plug-in Hybrid Electric Vehicles), BEV (Battery Electric Vehicles), and FCEV (Fuel Cell Electric Vehicles)
| Keyword | Definition |
|---|---|
| Electric Vehicle (EV) | A vehicle which uses one or more electric motors for propulsion. Includes cars, buses, and trucks. This term includes all-electric vehicles or battery electric vehicles and plug-in hybrid electric vehicles. |
| BEV | A BEV relies completely on a battery and a motor for propulsion. The battery in the vehicle must be charged by plugging it into an outlet or public charging station. BEVs do not have an ICE and hence are pollution-free. They have a low cost of operation and reduced engine noise as compared to conventional fuel engines. However, they have a shorter range and higher prices than their equivalent gasoline models. |
| PEV | A plug-in electric vehicle is an electric vehicle that can be externally charged and generally includes all-electric vehicles as well as plug-in hybrids. |
| Plug-in Hybrid EV | A vehicle that can be powered either by an ICE or an electric motor. In contrast to normal hybrid EVs, they can be charged externally. |
| Internal combustion engine | An engine in which the burning of fuels occurs in a confined space called a combustion chamber. Usually run with gasoline/petrol or diesel. |
| Hybrid EV | A vehicle powered by an ICE in combination with one or more electric motors that use energy stored in batteries. These are continually recharged with power from the ICE and regenerative braking. |
| Commercial Vehicles | Commercial vehicles are motorized road vehicles designed for transporting people or goods. The category includes light commercial vehicles (LCVs) and medium and heavy-duty vehicles (M&HCV). |
| Passenger Vehicles | Passenger cars are electric motor– or engine-driven vehicles with at least four wheels. These vehicles are used for the transport of passengers and comprise no more than eight seats in addition to the driver’s seat. |
| Light Commercial Vehicles | Commercial vehicles that weigh less than 6,000 lb (Class 1) and in the range of 6,001–10,000 lb (Class 2) are covered under this category. |
| M&HDT | Commercial vehicles that weigh in the range of 10,001–14,000 lb (Class 3), 14,001–16,000 lb (Class 4), 16,001–19,500 lb (Class 5), 19,501–26,000 lb (Class 6), 26,001–33,000 lb (Class 7) and above 33,001 lb (Class 8) are covered under this category. |
| Bus | A mode of transportation that typically refers to a large vehicle designed to carry passengers over long distances. This includes transit bus, school bus, shuttle bus, and trolleybuses. |
| Diesel | It includes vehicles that use diesel as their primary fuel. A diesel engine vehicle have a compression-ignited injection system rather than the spark-ignited system used by most gasoline vehicles. In such vehicles, fuel is injected into the combustion chamber and ignited by the high temperature achieved when gas is greatly compressed. |
| Gasoline | It includes vehicles that use gas/petrol as their primary fuel. A gasoline car typically uses a spark-ignited internal combustion engine. In such vehicles, fuel is injected into either the intake manifold or the combustion chamber, where it is combined with air, and the air/fuel mixture is ignited by the spark from a spark plug. |
| LPG | It includes vehicles that use LPG as their primary fuel. Both dedicated and bi-fuel LPG vehicles are considered under the scope of the study. |
| CNG | It includes vehicles that use CNG as their primary fuel. These are vehicles that operate like gasoline-powered vehicles with spark-ignited internal combustion engines. |
| HEV | All the electric vehicles that use batteries and an internal combustion engine (ICE) as their primary source for propulsion are considered under this category. HEVs generally use a diesel-electric powertrain and are also known as hybrid diesel-electric vehicles. An HEV converts the vehicle momentum (kinetic energy) into electricity that recharges the battery when the vehicle slows down or stops. The battery of HEV cannot be charged using plug-in devices. |
| PHEV | PHEVs are powered by a battery as well as an ICE. The battery can be charged through either regenerative breaking using the ICE or by plugging into some external charging source. PHEVs have a better range than BEVs but are comparatively less eco-friendly. |
| Hatchback | These are compact-sized cars with a hatch-type door provided at the rear end. |
| Sedan | These are usually two- or four-door passenger cars, with a separate area provided at the rear end for luggage. |
| SUV | Popularly known as SUVs, these cars come with four-wheel drive, and usually have high ground clearance. These cars can also be used as off-road vehicles. |
| MPV | These are multi-purpose vehicles (also called minivans) designed to carry a larger number of passengers. They carry between five and seven people and have room for luggage too. They are usually taller than the average family saloon car, to provide greater headroom and ease of access, and they are usually front-wheel drive. |


Research Methodology
Mordor Intelligence follows a four-step methodology in all its reports.
- Step-1: Identify Key Variables: To build a robust forecasting methodology, the variables and factors identified in Step-1 are tested against available historical market numbers. Through an iterative process, the variables required for market forecast are set and the model is built based on these variables.
- Step-2: Build a Market Model: Market-size estimations for the historical and forecast years have been provided in revenue and volume terms. Market revenue is calculated by multiplying the sales volume with their respective average selling price (ASP). While estimating ASP factors like average inflation, market demand shift, manufacturing cost, technological advancement, and varying consumer preference, among others have been taken into account.
- Step-3: Validate and Finalize: In this important step, all market numbers, variables, and analyst calls are validated through an extensive network of primary research experts from the market studied. The respondents are selected across levels and functions to generate a holistic picture of the market studied.
- Step-4: Research Outputs: Syndicated Reports, Custom Consulting Assignments, Databases & Subscription Platforms.


