Japan Engineering Plastics Market Size and Share
Market Overview
| Study Period | 2021 - 2031 |
|---|---|
| Forecast Data Period | 2026 - 2031 |
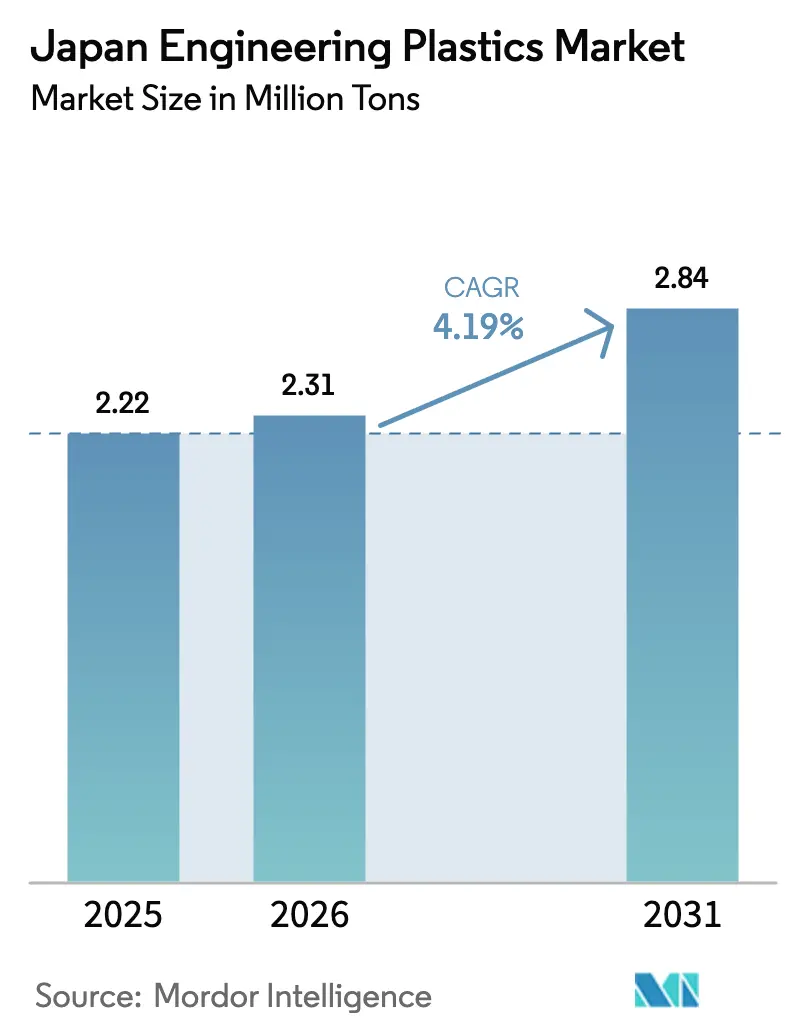
| Base Year Market Size (2025) | 2.22 Million tons |
| Market Volume (2026) | 2.31 Million tons |
| Market Volume (2031) | 2.84 Million tons |
| Growth Rate (2026 - 2031) | 4.19% CAGR |
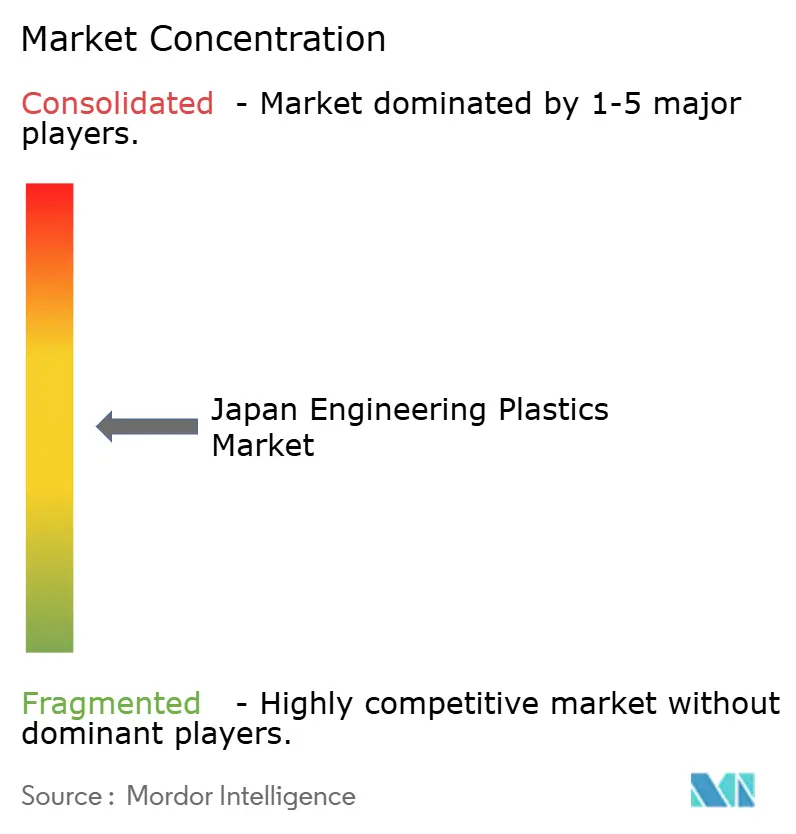
| Market Concentration | Medium |
Major Players *Disclaimer: Major Players sorted in no particular order Image © Mordor Intelligence. Reuse requires attribution under CC BY 4.0. | |
Japan Engineering Plastics Market Analysis by Mordor Intelligence
The Japan Engineering Plastics Market size is projected to be 2.22 million tons in 2025, 2.31 million tons in 2026, and reach 2.84 million tons by 2031, growing at a CAGR of 4.19% from 2026 to 2031. Demand is shifting from commodity polyolefins to specialty grades that serve 5G infrastructure, medical implants, and hydrogen-electrolysis equipment as domestic producers retreat from volumes that compete head-on with low-priced imports. Japan’s value chain is migrating away from Chubu’s automotive stamping plants toward Kanto’s semiconductor packaging lines and metropolitan clean rooms that manufacture high-added-value medical devices. Investment is concentrating in fluoropolymers, polyimide films, and PFAS-free tribological polyamides because these niches are insulated from Chinese overcapacity and enjoy pricing power. Meanwhile, consolidation among commodity producers and injection molders is squeezing marginal players, creating wider spreads between high-performance resins and bulk grades.
Key Report Takeaways
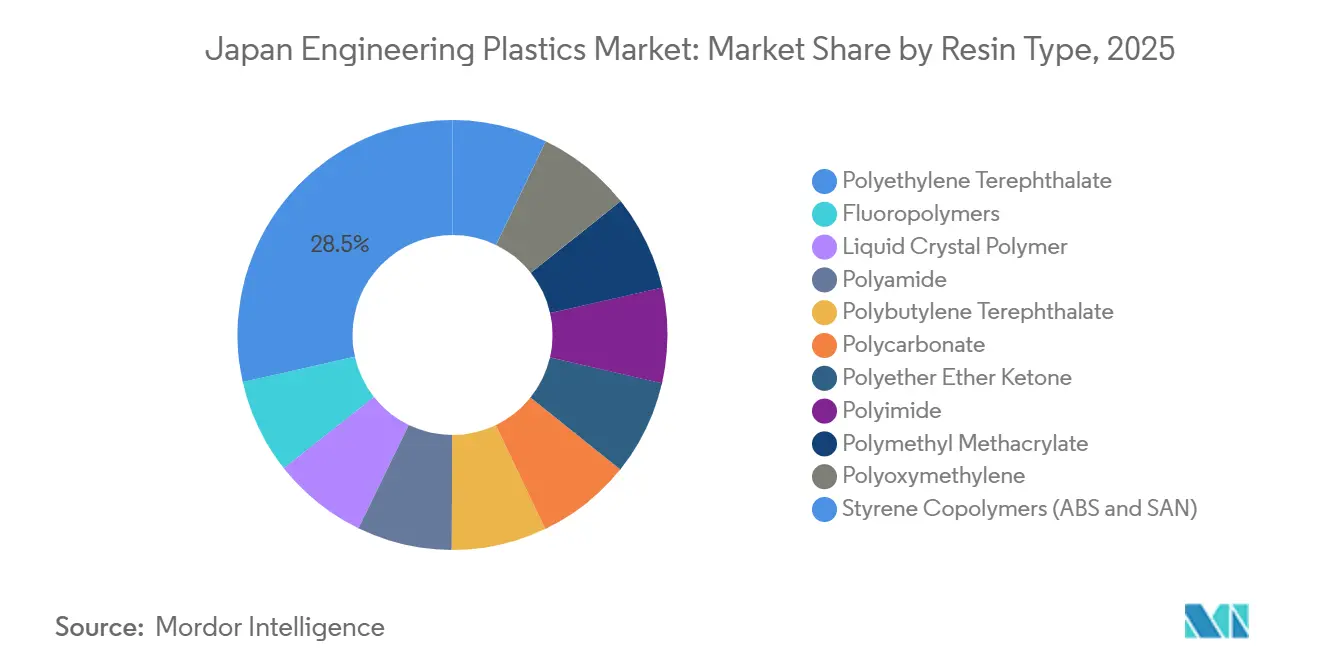
- By resin type, polyethylene terephthalate (PET) held 28.50% of the Japan Engineering Plastics market share in 2025. Fluoropolymers are projected to record the fastest 6.44% CAGR during the forecast period (2026-2031).
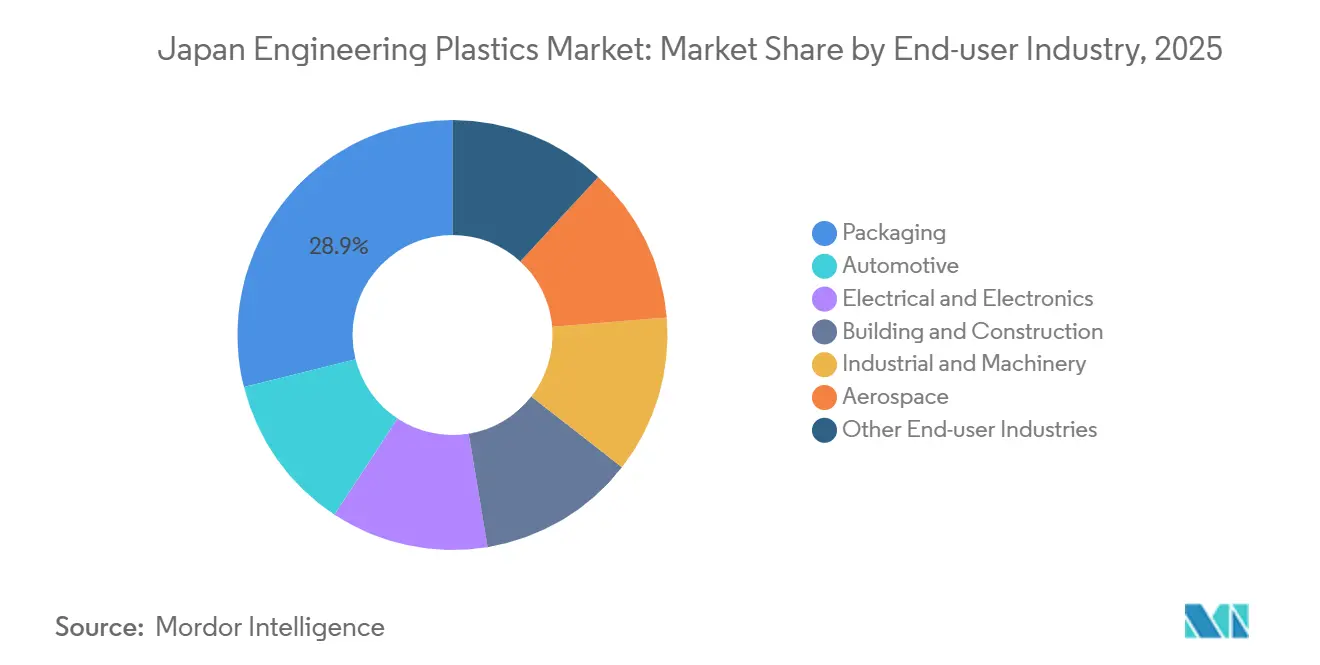
- By end-user industry, packaging captured 28.89% of the volume share in 2025, whereas electrical and electronics is set to advance at a 6.37% CAGR during the forecast period (2026-2031).
Note: Market size and forecast figures in this report are generated using Mordor Intelligence’s proprietary estimation framework, updated with the latest available data and insights as of January 2026.
Japan Engineering Plastics Market Trends and Insights
Drivers Impact Analysis*
| Driver | (~) % Impact on CAGR Forecast | Geographic Relevance | Impact Timeline |
|---|---|---|---|
| Surge in 5G and advanced semiconductor packaging | +1.2% | Kanto and Kyushu semiconductor corridors | Medium term (2-4 years) |
| Aging-society demand for medical devices | +0.9% | Metropolitan prefectures nationwide | Long term (≥ 4 years) |
| Recycling and circular-economy compliance mandates | +0.7% | National | Long term (≥ 4 years) |
| PFAS phase-out enabling PA tribological grades | +0.6% | National with export spillovers | Short term (≤ 2 years) |
| Cloud-based polymer CAE boosting high-turnover SKUs | +0.4% | Tier-1 chemical firms | Medium term (2-4 years) |
| Source: Mordor Intelligence | |||


Surge in 5G and Advanced Semiconductor Packaging
Japan’s drive for semiconductor sovereignty is redirecting more than 15,000 tons per year of high-purity fluoropolymers into plasma-etch chambers and chemical-delivery tubing[1]Ministry of Economy, Trade and Industry, “Rapidus Project Overview,” meti.go.jp. AGC’s JPY 35 billion expansion at Chiba, completed in 2025, increased Ethylenetetrafluoroethylene (ETFE) and Polyvinylidene Fluoride (PVDF) capacity expressly for this demand. TOPPAN and Kyocera have ramped ultra-thin polyimide films below 10 µm for advanced IC substrates, a niche that commands three to five times the margin of automotive resins. UBE is doubling polyimide capacity by 2030 as it exits commodity nylon. These moves tilt the Japan engineering plastics market toward low-dielectric, heat-resistant polymers that Chinese competitors cannot yet mass-produce at required purity levels.
Aging-Society Demand for Medical Devices
Twenty-eight-point-six percent of Japan’s population is over 65, transforming medical devices into a structural growth pillar. The Ministry of Health, Labour and Welfare approved 47 new device classifications in 2025 that rely on ISO-10993-compliant polymers. Polyether Ether Ketone (PEEK) and polysulfone are taking share in spinal implants and dialysis membranes because they enable MRI-compatible and chemically robust solutions that metals cannot offer. Asahi Kasei is doubling PIMEL polyimide capacity by 2030 to support minimally invasive surgical tools[2]Asahi Kasei, “PFAS-Free PA66 Launch,” asahi-kasei.com. Such clinical innovation decouples resin demand from GDP, linking growth instead to procedure adoption curves that favor high-margin biocompatible grades.
Recycling and Circular-Economy Compliance Mandates
The Plastic Resource Circulation Act now obligates 25% recycled content in packaging and durable goods by 2030, prompting the Ministry of Economy, Trade and Industry (METI) to target 1 million tons of recycled plastics annually. Sumitomo Chemical processed 11,440 tons of waste into chemically recycled polypropylene in FY 2024 and plans 200,000 tons by 2030. Recycled Polyethylene Terephthalate capacity rose 28% between 2023 and 2025 to 445,000 tons, and Toray–Teijin solvent purification pilots aim to recover near-virgin Polyamide (PA) and Polybutylene Terephthalate (PBT) for under-hood automotive parts. Integrated producers that control polymerization and recycling infrastructure are positioned to capture closed-loop premiums in the Japan engineering plastics market.
PFAS Phase-Out Enabling PA Tribological Grades
The January 2025 ban on Perfluorooctanoic acid (PFOA), Perfluorooctanesulfonic acid (PFOS), and PFHxS (Perfluorohexanesulfonic acid) accelerated substitution away from PTFE-filled compounds. Asahi Kasei’s PFAS-free PA66, launched in January 2026, achieves a 0.15 coefficient of friction against steel without fluorinated additives. Mitsui Chemicals is marketing TPX polymethylpentene as a drop-in for FEP in semiconductor wet benches. Per- and polyfluoroalkyl substances (PFAS)-free resins command 20-30% price premiums, giving early movers a head start before foreign competitors replicate the chemistries.
Restraints Impact Analysis*
| Restraint | (~) % Impact on CAGR Forecast | Geographic Relevance | Impact Timeline |
|---|---|---|---|
| Automotive output contraction 2023-24 | -0.8% | Chubu automotive corridor | Short term (≤ 2 years) |
| PFAS regulatory uncertainty for fluoropolymers | -0.5% | Fluoropolymer producers nationwide | Medium term (2-4 years) |
| Shrinking domestic injection-molding SME base | -0.3% | Kansai and Kanto industrial belts | Long term (≥ 4 years) |
| Source: Mordor Intelligence | |||
Automotive Output Contraction 2023-24
Monthly vehicle output fell to 587,348 units in November 2025, far below historical peaks, and Japan Auto Parts Industries Association (JAPIA) recorded 36 supplier bankruptcies in 2024. The slump hits commodity PP and ABS hardest, but it also crimps demand for PA66 intake manifolds and PC headlamp lenses. Surviving molders such as the newly formed GMS Group (created by the April 2026 Nissei Plastic-TOYO Innobex merger) now control larger shares of downstream conversion capacity, slowing diffusion of next-generation resins.
PFAS Regulatory Uncertainty for Fluoropolymers
Daikin’s JPY 35 billion Chiba PTFE investment and AGC’s JPY 15 billion Kitakyushu PVDF line assume continued exemptions for high-performance grades. Yet Europe’s proposed blanket PFAS restriction could force Japan to tighten rules by 2027. Smaller players are delaying expansions and pivoting to PFAS-free chemistries, capping fluoropolymer growth despite robust semiconductor demand.
*Our forecasts treat driver/restraint impacts as directional, not additive. The impact forecasts reflect baseline growth, mix effects, and variable interactions.
Segment Analysis
By End-User Industry: Electrification Rebalances Automotive Losses
Packaging held 28.89% of Japan Engineering Plastics market share in 2025, driven by beverage and food applications that consumed 640,000 tons of PET, PP, and PS. Electrical and Electronics is forecast to grow at a 6.37% CAGR during the forecast period (2026-2031), propelled by a 17% surge in domestic IC output as Rapidus and TSMC fabs ramp capacity. Automotive remains volume-heavy but is losing relative weight; however, each EV integrates 30-40 kg of high-performance PPS, PPA, and PEEK versus 15-20 kg in internal-combustion cars, cushioning the Japan Engineering Plastics market size for this segment.
Hospitals’ shift to single-use devices and robotic platforms is boosting medical applications of radiolucent PEEK and sterilization-resistant PSU. Building and Construction demand for PVC profiles and PC glazing is stabilizing alongside residential starts, while Industrial Machinery is pacing 3-4% annual growth as factories digitize. Aerospace, though small, benefits from NEDO-funded composite programs that favor high-temperature polyimides and carbon-fiber-reinforced thermoplastics.


By Resin Type: Fluoropolymers and Specialty PAs Outpace Commodities
Polyethylene Terephthalate (PET) accounted for 28.50% of the Japan Engineering Plastics market size in 2025 on the back of rPET adoption that lifted domestic recycled capacity to 445,000 tons. Fluoropolymers are projected to advance at a 6.44% CAGR during the forecast period (2026-2031) because AGC and Daikin have committed JPY 50 billion (USD 335 million) to PTFE, PVDF, and FEP expansions for semiconductor wet processes and hydrogen-electrolyzer membranes. Specialty PA66 from Asahi Kasei and heat-resistant PA from Kuraray are capturing share in tribological gears and EV e-axles, expanding 7-8% annually.
Polycarbonate faces Chinese overcapacity yet enjoys niche demand in heads-up displays and medical shields. POM growth has moved offshore after Daicel-Polyplastics started a Nantong line, keeping domestic production focused on ultra-pure grades for medical devices. Liquid-crystal polymer volumes are lifting as 5G antenna substrates miniaturize. PMMA, styrene copolymers, and PBT remain flat or slightly contracting except for specialty formulations that meet high-voltage EV requirements.
Geography Analysis
The Kanto region accounts for the most domestic engineering plastics consumption because of its concentration of electronics, medical, and precision-molding firms. High-purity fluoropolymers, polyimide films, and PEEK implants dominate resin flows into the region, insulating it from automotive weakness. Chubu’s automotive corridor is under pressure as vehicle production slows, but Toray’s Nagoya site is pivoting toward PPS compounds for e-axles and carbon-fiber prepregs for hydrogen tanks, helping stabilize specialty demand.
Kyushu is emerging as a semiconductor-materials cluster anchored by TSMC’s Kumamoto fabs and METI’s designation of the area as a strategic zone. AGC projects Kyushu will account for up to 20% of its fluoropolymer sales by 2028 after its FORBLUE S-series expansion comes online. Trade dynamics accentuate regional differences: Japan imports roughly 190,000 tons of commodity PA6, PC, and PBT from China and South Korea while exporting 130,000 tons of specialty fluoropolymers, PEEK, and LCP to North America and Europe.
The asymmetric pattern, importing bulk, exporting specialty, will widen as Prime Polymer consolidates domestic polyolefin capacity and reallocates capital toward offshore specialty assets. Regional governments are now competing for subsidies tied to recycling plants and hydrogen infrastructure, setting the stage for localized demand spikes in recycled PET and PVDF membranes.
Competitive Landscape
The Japan Engineering Plastics market is moderately fragmented. Technological differentiation is sharpening competitive moats. Toray’s AI-driven materials informatics platform cuts resin-development cycles in half. Compliance credentials remain barriers to entry: Japanese firms’ long track records with UL 94 flammability and ISO 10993 biocompatibility keep most Chinese producers in the commodity tier.
Japan Engineering Plastics Industry Leaders
Polyplastics-Evonik Corporation
Toray Industries Inc.
Sumitomo Chemical Co., Ltd.
Mitsui Chemicals, Inc.
Mitsubishi Chemical Group Corporation
- *Disclaimer: Major Players sorted in no particular order

Recent Industry Developments
- June 2025: Teijin Limited announced that pipes molded from its biomass-derived polycarbonate (PC) resin were adopted for use in the world’s first pipe organ made from bioplastic. The transparent pipes were manufactured by Teiyo Co., Ltd., a Teijin Group company specializing in plastic molding.
- March 2025: Sumitomo Chemical Co., Ltd. announced plans to market polymethyl methacrylate (PMMA) made from chemically recycled methyl methacrylate (MMA) monomer. LG Display Co., Ltd. and Nissan Motor Co., Ltd. decided to use this recycled material in their products.


Japan Engineering Plastics Market Report Scope
Engineering plastics are engineered for outshining their commodity counterparts with enhanced mechanical, electrical, and thermal properties. They boast superior resistance to chemicals and ultraviolet light, and even offer biocompatibility, making them ideal for food packaging.
The Japan Engineering Plastics market is segmented by end-user industry and resin type. By end-user industry, the market is segmented into automotive, electrical and electronics, building and construction, packaging, industrial and machinery, aerospace, and other end-user industries. By resin type, the market is segmented into fluoropolymers, liquid crystal polymer, polyamide, polybutylene terephthalate, polycarbonate, polyether ether ketone, polyethylene terephthalate, polyimide, polymethyl methacrylate, polyoxymethylene, and styrene copolymers (ABS and SAN). The report also provides the market size and forecasts in volume (tons).
| Automotive |
| Electrical and Electronics |
| Building and Construction |
| Packaging |
| Industrial and Machinery |
| Aerospace |
| Other End-User Industries |
| Fluoropolymers | Ethylenetetrafluoroethylene (ETFE) |
| Fluorinated Ethylene-propylene (FEP) | |
| Polytetrafluoroethylene (PTFE) | |
| Polyvinylfluoride (PVF) | |
| Polyvinylidene Fluoride (PVDF) | |
| Other Sub Resin Types | |
| Liquid Crystal Polymer | |
| Polyamide | Aramid |
| Polyamide (PA) 6 | |
| Polyamide (PA) 66 | |
| Polyphthalamide | |
| Polybutylene Terephthalate | |
| Polycarbonate | |
| Polyether Ether Ketone | |
| Polyethylene Terephthalate | |
| Polyimide | |
| Polymethyl Methacrylate | |
| Polyoxymethylene | |
| Styrene Copolymers (ABS and SAN) |
| By End-User Industry | Automotive | |
| Electrical and Electronics | ||
| Building and Construction | ||
| Packaging | ||
| Industrial and Machinery | ||
| Aerospace | ||
| Other End-User Industries | ||
| By Resin Type | Fluoropolymers | Ethylenetetrafluoroethylene (ETFE) |
| Fluorinated Ethylene-propylene (FEP) | ||
| Polytetrafluoroethylene (PTFE) | ||
| Polyvinylfluoride (PVF) | ||
| Polyvinylidene Fluoride (PVDF) | ||
| Other Sub Resin Types | ||
| Liquid Crystal Polymer | ||
| Polyamide | Aramid | |
| Polyamide (PA) 6 | ||
| Polyamide (PA) 66 | ||
| Polyphthalamide | ||
| Polybutylene Terephthalate | ||
| Polycarbonate | ||
| Polyether Ether Ketone | ||
| Polyethylene Terephthalate | ||
| Polyimide | ||
| Polymethyl Methacrylate | ||
| Polyoxymethylene | ||
| Styrene Copolymers (ABS and SAN) | ||


Market Definition
- End-user Industry - Packaging, Electrical & Electronics, Automotive, Building & Construction, and Others are the end-user industries considered under the engineering plastics market.
- Resin - Under the scope of the study, consumption of virgin resins like Fluoropolymer, Polycarbonate, Polyethylene Terephthalate, Polybutylene Terephthalate, Polyoxymethylene, Polymethyl Methacrylate, Styrene Copolymers, Liquid Crystal Polymer, Polyether Ether Ketone, Polyimide, and Polyamide in the primary forms are considered. Recycling has been provided separately under its individual chapter.
| Keyword | Definition |
|---|---|
| Acetal | This is a rigid material that has a slippery surface. It can easily withstand wear and tear in abusive work environments. This polymer is used for building applications such as gears, bearings, valve components, etc. |
| Acrylic | This synthetic resin is a derivative of acrylic acid. It forms a smooth surface and is mainly used for various indoor applications. The material can also be used for outdoor applications with a special formulation. |
| Cast film | A cast film is made by depositing a layer of plastic onto a surface then solidifying and removing the film from that surface. The plastic layer can be in molten form, in a solution, or in dispersion. |
| Colorants & Pigments | Colorants & Pigments are additives used to change the color of the plastic. They can be a powder or a resin/color premix. |
| Composite material | A composite material is a material that is produced from two or more constituent materials. These constituent materials have dissimilar chemical or physical properties and are merged to create a material with properties unlike the individual elements. |
| Degree of Polymerization (DP) | The number of monomeric units in a macromolecule, polymer, or oligomer molecule is referred to as the degree of polymerization or DP. Plastics with useful physical properties often have DPs in the thousands. |
| Dispersion | To create a suspension or solution of material in another substance, fine, agglomerated solid particles of one substance are dispersed in a liquid or another substance to form a dispersion. |
| Fiberglass | Fiberglass-reinforced plastic is a material made up of glass fibers embedded in a resin matrix. These materials have high tensile and impact strength. Handrails and platforms are two examples of lightweight structural applications that use standard fiberglass. |
| Fiber-reinforced polymer (FRP) | Fiber-reinforced polymer is a composite material made of a polymer matrix reinforced with fibers. The fibers are usually glass, carbon, aramid, or basalt. |
| Flake | This is a dry, peeled-off piece, usually with an uneven surface, and is the base of cellulosic plastics. |
| Fluoropolymers | This is a fluorocarbon-based polymer with multiple carbon-fluorine bonds. It is characterized by high resistance to solvents, acids, and bases. These materials are tough yet easy to machine. Some of the popular fluoropolymers are PTFE, ETFE, PVDF, PVF, etc. |
| Kevlar | Kevlar is the commonly referred name for aramid fiber, which was initially a Dupont brand for aramid fiber. Any group of lightweight, heat-resistant, solid, synthetic, aromatic polyamide materials that are fashioned into fibers, filaments, or sheets is called aramid fiber. They are classified into Para-aramid and Meta-aramid. |
| Laminate | A structure or surface composed of sequential layers of material bonded under pressure and heat to build up to the desired shape and width. |
| Nylon | They are synthetic fiber-forming polyamides formed into yarns and monofilaments. These fibers possess excellent tensile strength, durability, and elasticity. They have high melting points and can resist chemicals and various liquids. |
| PET preform | A preform is an intermediate product that is subsequently blown into a polyethylene terephthalate (PET) bottle or a container. |
| Plastic compounding | Compounding consists of preparing plastic formulations by mixing and/or blending polymers and additives in a molten state to achieve the desired characteristics. These blends are automatically dosed with fixed setpoints usually through feeders/hoppers. |
| Plastic pellets | Plastic pellets, also known as pre-production pellets or nurdles, are the building blocks for nearly every product made of plastic. |
| Polymerization | It is a chemical reaction of several monomer molecules to form polymer chains that form stable covalent bonds. |
| Styrene Copolymers | A copolymer is a polymer derived from more than one species of monomer, and a styrene copolymer is a chain of polymers consisting of styrene and acrylate. |
| Thermoplastics | Thermoplastics are defined as polymers that become soft material when it is heated and becomes hard when it is cooled. Thermoplastics have wide-ranging properties and can be remolded and recycled without affecting their physical properties. |
| Virgin Plastic | It is a basic form of plastic that has never been used, processed, or developed. It may be considered more valuable than recycled or already used materials. |


Research Methodology
Mordor Intelligence follows a four-step methodology in all our reports.
- Step-1: Identify Key Variables: The quantifiable key variables (industry and extraneous) pertaining to the specific product segment and country are selected from a group of relevant variables & factors based on desk research & literature review; along with primary expert inputs. These variables are further confirmed through regression modeling (wherever required).
- Step-2: Build a Market Model: In order to build a robust forecasting methodology, the variables and factors identified in Step-1 are tested against available historical market numbers. Through an iterative process, the variables required for market forecast are set and the model is built on the basis of these variables.
- Step-3: Validate and Finalize: In this important step, all market numbers, variables and analyst calls are validated through an extensive network of primary research experts from the market studied. The respondents are selected across levels and functions to generate a holistic picture of the market studied.
- Step-4: Research Outputs: Syndicated Reports, Custom Consulting Assignments, Databases & Subscription Platforms


