India Engineering Plastics Market Size and Share
Market Overview
| Study Period | 2021 - 2031 |
|---|---|
| Forecast Data Period | 2026 - 2031 |
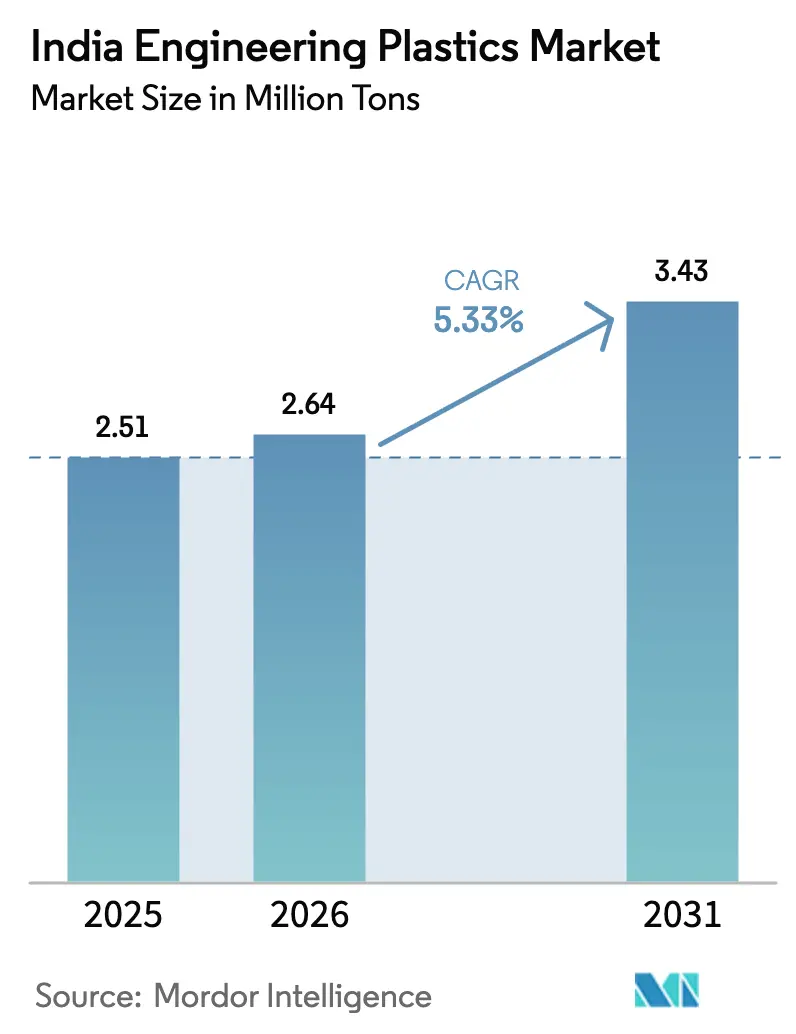
| Base Year Market Size (2025) | 2.51 Million tons |
| Market Volume (2026) | 2.64 Million tons |
| Market Volume (2031) | 3.43 Million tons |
| Growth Rate (2026 - 2031) | 5.33% CAGR |
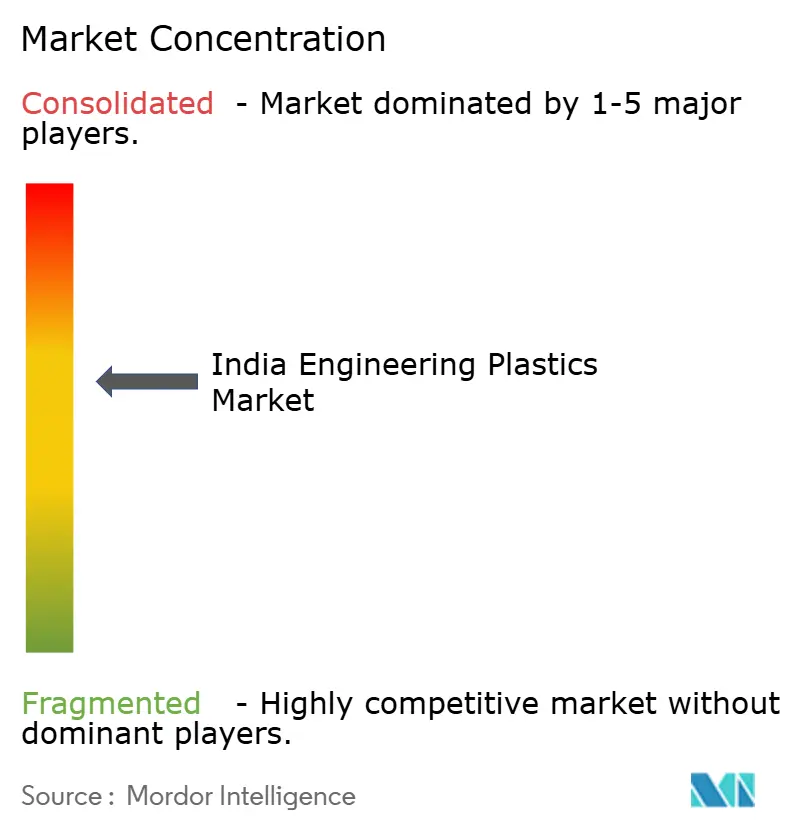
| Market Concentration | Medium |
Major Players *Disclaimer: Major Players sorted in no particular order Image © Mordor Intelligence. Reuse requires attribution under CC BY 4.0. | |
India Engineering Plastics Market Analysis by Mordor Intelligence
The Indian Engineering Plastics Market size is expected to grow from 2.51 million tons in 2025 to 2.64 million tons in 2026 and is forecast to reach 3.43 million tons by 2031 at 5.33% CAGR over 2026-2031. Demand for rigid and flexible packaging remains robust across the beverage, food, and e-commerce sectors. However, there is a notable pivot towards premium components in the electrical, electronics, and mobility domains. Government initiatives, such as the Production Linked Incentive (PLI) outlays, alongside a growing electric vehicle (EV) production base and stringent recycled content mandates, have drastically accelerated resin-adoption cycles. What previously required nearly a decade has now been reduced to approximately five years. This swift transition is highlighted by the expanding grades in flame-retardant polyamides, polycarbonate-ABS blends, and fluoropolymers. Between 2026 and 2031, domestic capacity expansions have focused on PET, ABS, and standard polyamide 6. However, India continues to depend on imports for a considerable portion of its specialty polymers. This reliance makes converters vulnerable to foreign exchange fluctuations and potential shipping delays.
Key Report Takeaways
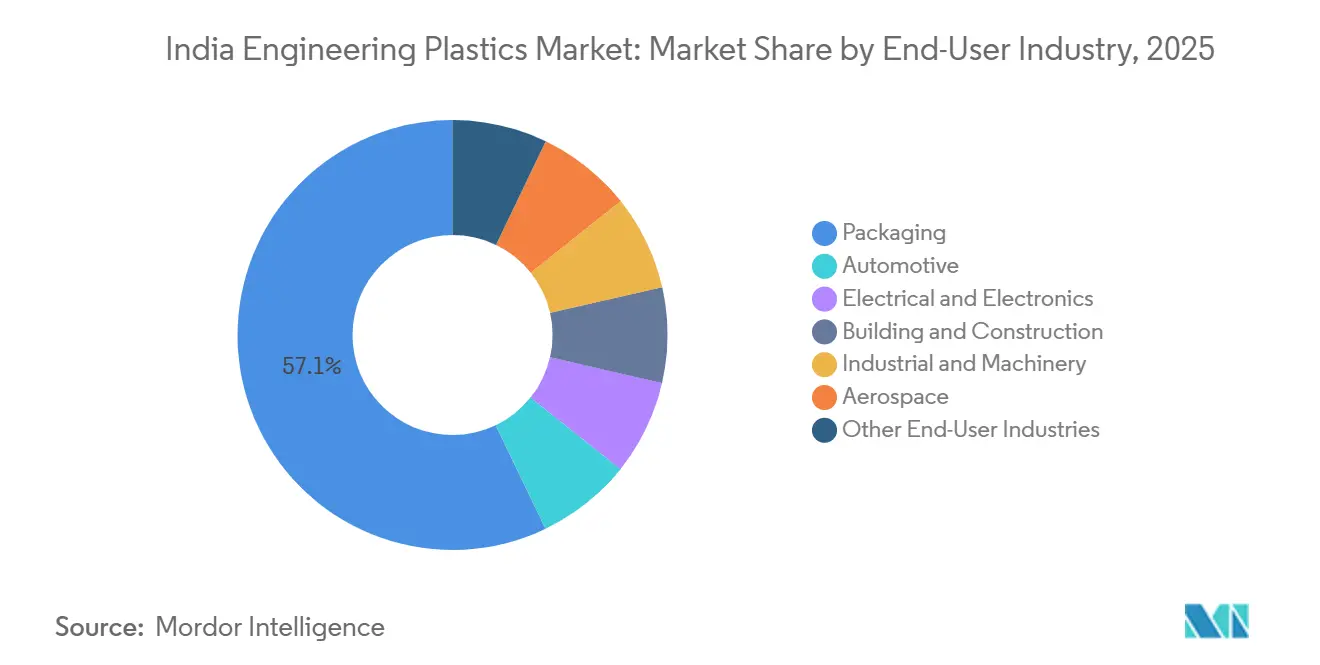
- By end-user industry, the packaging sector led with a 57.12% India Engineering Plastics market share in 2025, while the electrical and electronics sector is projected to post the fastest growth of 8.55% CAGR (2026-2031).
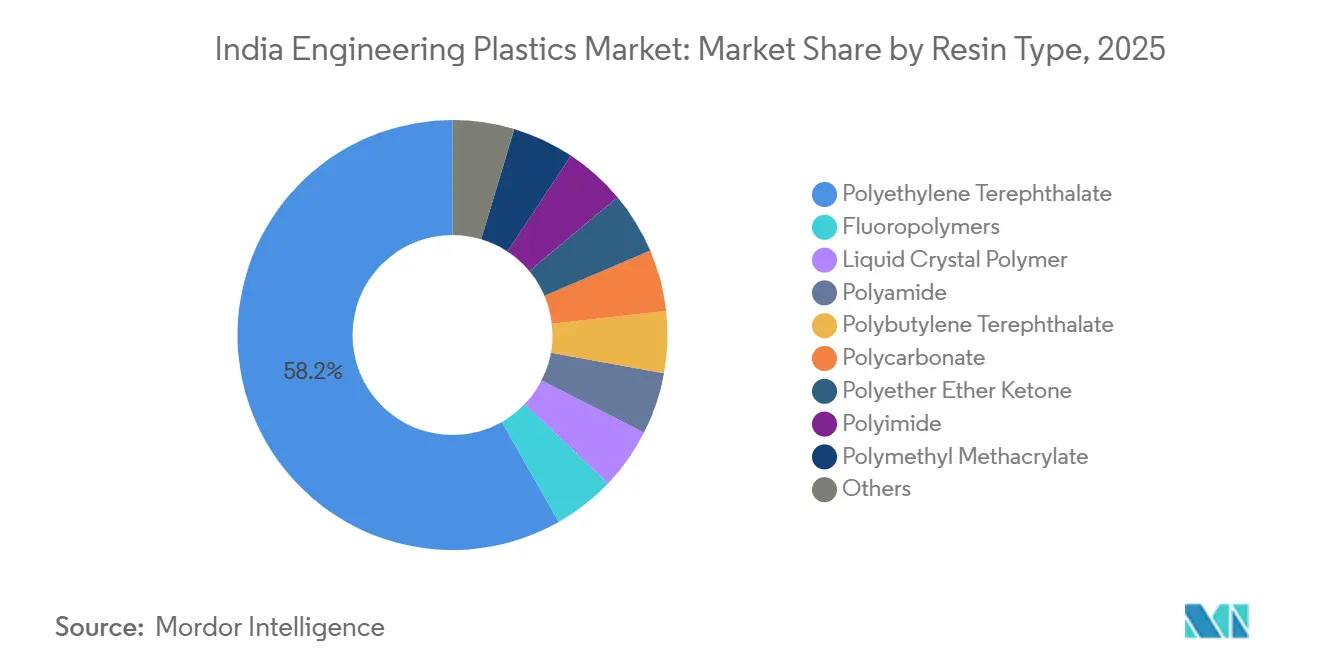
- By resin type, polyethylene terephthalate (PET) accounted for a 58.22% share of the Indian Engineering Plastics market size in 2025, whereas fluoropolymer is anticipated to advance at a 9.12% CAGR between 2026 and 2031.
Note: Market size and forecast figures in this report are generated using Mordor Intelligence’s proprietary estimation framework, updated with the latest available data and insights as of January 2026.
India Engineering Plastics Market Trends and Insights
Drivers Impact Analysis*
| Drivers | (~) % Impact on CAGR Forecast | Geographic Relevance | Impact Timeline |
|---|---|---|---|
| Automotive Light-weighting and Electric Vehicle Adoption Boom | +1.8% | National, concentrated in Tamil Nadu (Chennai corridor), Maharashtra (Pune-Aurangabad belt), Gujarat (Sanand-Halol cluster) | Medium term (2-4 years) |
| Government PLI Incentives for Specialty Polymers | +1.2% | National, with early gains in Gujarat (Dahej, Vadodara), Karnataka (Bengaluru electronics hub), Tamil Nadu (Chennai-Sriperumbudur) | Short term (≤ 2 years) |
| Surge in Electronics Manufacturing | +1.5% | National, spill-over to Uttar Pradesh (Noida-Greater Noida), Telangana (Hyderabad), Maharashtra (Pune) | Medium term (2-4 years) |
| Food-grade rPET Mandate for Beverage Bottles | +0.6% | National, with compliance pressure highest in Maharashtra, Karnataka, Delhi NCR (major beverage consumption centers) | Short term (≤ 2 years) |
| Rapid Growth of Technical-textile and Fiber Exports | +0.4% | National, export-oriented clusters in Gujarat (Surat, Vapi), Tamil Nadu (Coimbatore, Tirupur), Maharashtra (Mumbai-Thane) | Long term (≥ 4 years) |
| Source: Mordor Intelligence | |||
Automotive Light-Weighting and Electric-Vehicle Adoption Boom
From 2024 to 2033, India's EV sales are projected to surge, driving up the demand for polymers in vehicles. OEMs are increasingly opting for materials such as glass-fiber-reinforced polyamide 66, polyphthalamide, and flame-retardant polycarbonate-ABS, replacing traditional metal housings. This shift not only reduces curb weight but also enhances the EV driving range, making it a pivotal choice for battery enclosures, power-electronics modules, and thermal-management manifolds. Tata Motors and Mahindra are leading the charge, specifying a higher content of engineering plastics in their new EV platforms, which doubles the content used in comparable internal-combustion models. While domestic production of PA 66 faces capacity constraints, the value-chain players are turning to imports for intermediates such as caprolactam and adipic acid. This reliance on imports tempers potential cost reductions, even with Bhansali Engineering Polymers planning an expansion set to conclude in 2028. Starting in 2027, the Bureau of Energy Efficiency is tightening Corporate Average Fuel Economy (CAFE) norms. This policy is expected to further accelerate the shift from plastic to metal in components such as door modules, instrument clusters, and seat structures[1]Bureau of Energy Efficiency, “Draft CAFE Norms 2027,” beeindia.gov.in.
Government PLI Incentives for Specialty Polymers
By December 2025, disbursements under the PLI scheme reached significant levels, leading to the establishment of multiple greenfield projects in corridors focused on electronics, batteries, and specialty chemicals. Major players such as Foxconn, Samsung, and Tata Electronics are committed to sourcing components, including polycarbonate housings, liquid-crystal-polymer connectors, and PVDF binders, from domestic markets. This marked a significant shift from their earlier reliance on imports. The Advanced Chemistry Cell PLI, with substantial funding, created a considerable demand for PVDF and PTFE annually for applications such as cathode binders and separator coatings. The Dahej-Vadodara belt in Gujarat and the Bengaluru cluster in Karnataka experienced the most momentum. In these regions, land subsidies and favorable power tariffs enabled resin manufacturers to reduce operating costs. Notably, mobile-phone import volumes had significantly declined since FY 2020-21, underscoring the potential of localization efforts to reshape trade balances within a single investment cycle.
Surge in Electronics Manufacturing
Over the past five years, electronics projects backed by the PLI initiative have significantly boosted the demand for UL 94 V-0-compliant materials, such as ABS, polycarbonate, and LCP. In Tamil Nadu and Karnataka, the vendor ecosystem supporting Apple has dramatically increased its annual consumption of flame-retardant plastics, moving from marginal volumes in 2023 to substantial amounts today. PCB production, which previously had minimal polymer requirements, now depends on polyimide films, epoxy laminates, and high-glass-transition PBT connectors to withstand lead-free solder reflow profiles. By backward-integrating into injection-molded appliance enclosures, Dixon Technologies and Amber Enterprises are not only reducing lead times but also enhancing domestic consumption of ABS. The initial PLI projects have generated direct jobs, leading to a heightened demand for polymethyl methacrylate light-guides, polyoxymethylene gears, and SAN lenses, thereby broadening the downstream influence of the Engineering Plastics Market in North America.
Food-Grade rPET Mandate for Beverage Bottles
In April 2025, the Food Safety and Standards Authority of India mandated the inclusion of recycled content in PET beverage bottles. However, by mid-2025, supplies of accredited food-contact rPET fell short of meeting annual demand. This gap caused rPET resin premiums to surpass those of virgin grades, putting financial pressure on smaller bottlers. In response to the situation, Reliance Industries set up a bottle-to-bottle rPET line at a new facility in Dahej. However, certification challenges remained, with fewer than ten domestic labs possessing the necessary gas-chromatography-mass-spectrometry capability for timely migration testing. While Polyplex Corporation and IVL Dhunseri explored chemical-recycling loops to restore intrinsic viscosity after multiple melt cycles, they projected full commercialization no earlier than the 2026–2031 forecast period.
Restraints Impact Analysis*
| Restraints | (~) % Impact on CAGR Forecast | Geographic Relevance | Impact Timeline |
|---|---|---|---|
| Feedstock Price Volatility (PX, Benzene, HF) | -0.9% | National, acute impact in Gujarat and Maharashtra (major petrochemical hubs), ripple effects across all consuming states | Short term (≤ 2 years) |
| Compliance Costs from EPR and Recycled-content Rules | -0.5% | National, enforcement pressure highest in Maharashtra, Karnataka, Delhi NCR, Tamil Nadu (major urban centers with stringent monitoring) | Medium term (2-4 years) |
| Under-investment in Certified Recycling Infrastructure | -0.4% | National, infrastructure gaps most severe in Tier-2 and Tier-3 cities across Uttar Pradesh, Madhya Pradesh, Rajasthan, Bihar | Long term (≥ 4 years) |
| Source: Mordor Intelligence | |||
Feedstock Price Volatility (PX, Benzene, HF)
Paraxylene prices have exhibited significant fluctuations, and benzene prices have also experienced notable swings in a short timeframe. These price movements have compressed margins for polyester and polyamide producers. In a bid to safeguard their spreads, Reliance Industries and Gujarat State Fertilizers & Chemicals transitioned from quarterly to monthly price adjustments. However, this shift has strained their working capital, adversely affecting downstream operations. Meanwhile, hydrofluoric acid, a critical feedstock for PTFE and PVDF production, has experienced a tightening supply due to new environmental restrictions implemented in China. As a result, Gujarat Fluorochemicals has entered into multi-year supply contracts at a premium over previous averages[2]Gujarat Fluorochemicals Limited, “Long-Term HF Supply Contracts,” gfl.co.in. Furthermore, smaller compounders, who typically do not hedge, postponed their new extrusion lines by several months. This postponement has hindered the commercialization of resin grades for emerging applications, including 5G antennas and EV battery seals.
Compliance Costs from EPR and Recycled-Content Rules
By 2025, packaged-goods brands experienced increased collection costs and mechanical-recycling expenses due to Extended Producer Responsibility (EPR) levies, which reduced their EBIT margins. The Central Pollution Control Board's digital portal required companies to upload quarterly tonnage data. However, spot inspections revealed non-compliance rates exceeding forty percent, exposing firms to potential penalty surcharges. Achieving NABL accreditation, a costly endeavor for each facility, remained a significant challenge for most recyclers until mid-2025. This scarcity of accredited recyclers led to a tight supply and increased rPET prices. While automakers and electronics assemblers paid a premium for virgin resin, they simultaneously relied on PET-based EPR credits. This regulatory maneuvering highlighted a disconnect between their material choices and genuine sustainability goals, particularly as recycling technologies for polycarbonate and polyamide lagged behind PET.
*Our forecasts treat driver/restraint impacts as directional, not additive. The impact forecasts reflect baseline growth, mix effects, and variable interactions.
Segment Analysis
By End-User Industry: Packaging Dominates, Electronics Accelerates
In 2025, packaging took the lead in India's engineering plastics market, securing a commanding 57.12% share. This upswing was fueled by a dynamic domestic packaging sector, skillfully addressing the needs of swift urbanization, food delivery services, and organized retail. As companies in the soft drink, water, and dairy sectors geared up for the rPET mandate, production of PET bottles saw a consistent rise. Flexible multi-layer films, now a significant segment of total packaging tonnage, are enhanced with EVOH and polyamide barriers to extend the shelf life of snack foods. Although electronics manufacturing represented a smaller slice of the 2025 volume, it is set to expand at an 8.55% CAGR through the 2026–2031 forecast period. This anticipated growth is driven by PLI incentives that bolster the domestic assembly of smartphones, white goods, and wearables. Each addition of a PCB or printed antenna notably heightens the demand for high-temperature LCP and PBT. The automotive sector is ramping up its polymer usage for electric vehicles (EVs), favoring optical-grade polycarbonate for components like battery packs, electrical connectors, and exterior glazing, moving away from traditional materials. The construction sector, leveraging CPVC pipes, PMMA glazing, and polycarbonate roofing, is a major consumer, spurred by initiatives like the Smart Cities Mission and PM Awas Yojana housing projects.
As e-commerce trends evolve, there is a noticeable shift in packaging towards lighter, recyclable formats. This evolution has spotlighted niches for monomaterial glycol-modified PET and polyolefin-based barrier films. Brand owners' push for tamper-evident bottles and laser-engraved closures has spiked the demand for specialty polyacetal and thermoplastic elastomers. The electronics sector, closely tied to major players like Apple and Samsung, has seen a marked decrease in the country's dependence on imported flame-retardant ABS. The automotive industry's drive for lightweight components has led to a surge in demand for glass-fiber-reinforced PA 66 and polyphthalamide engine covers. Additionally, impact-modified polycarbonate is becoming the go-to for two-wheeler battery casings. With a construction boom underway, especially in municipal water projects, there has been a notable uptick in the demand for CPVC and UPVC pipes. Industrial machinery, from bearings to conveyor systems, is increasingly opting for low-friction POM and aramid-reinforced PA 6 to boost wear resistance, though there is still a significant dependence on imports for advanced grades.


By Resin Type: PET Leads, Fluoropolymers Surge
In 2025, Reliance Industries' robust production capacity, combined with a surging demand for bottles, polyester fiber, and biaxially-oriented film, propelled Polyethylene Terephthalate (PET) to seize a commanding 58.22% market share. By 2031, buoyed by upstream expansions and a growing recycling loop, the Indian engineering plastics market, spearheaded by PET, is poised for growth during the forecast period of 2026–2031. While Fluoropolymers currently occupy a niche segment, they are on a rapid trajectory, with projections indicating a 9.12% CAGR growth through 2026–2031. This momentum is largely driven by semiconductor fabs increasingly turning to PTFE, FEP, and PVDF for their dielectric and sealing applications. Polyamide grades, constituting a significant portion of the tonnage, are crucial in under-hood components, technical textiles, and industrial gears. Yet, with existing capacity gaps in PA 66, the sector leans heavily on imports, a situation expected to ease once Bhansali Engineering Polymers' new line is operational. Polycarbonate, while holding a moderate market share, grapples with intermittent shortages, a consequence of its domestic polymerization capacity being restricted to a pilot scale. As a result, the industry predominantly relies on international suppliers, leading to extended shipping times. Styrene copolymers, particularly ABS and SAN, dominate the volume landscape. To safeguard their margins, Styrenix Performance Materials and INEOS are shifting their focus toward glass-reinforced and impact-modified variants.
Value-added resins such as PEEK, PEI, and LCP, despite their limited volume representation, command premium unit prices, significantly outpacing those of PET. Operating margins for PTFE and FEP, both integral to EV battery-seal tapes and 5G antenna substrates, remain robust. Polyoxymethylene (POM) caters to precision gears, PMMA shines in optical light-guides, and PBT is the go-to for high-temperature electrical connectors. While Reliance Industries, Polyplex, and IVL Dhunseri channel surplus PET fiber exports to the Southeast Asia region, the domestic arena grapples with a deficit in engineering-grade PET, crucial for hot-fill bottle applications. This shortfall finds a remedy in imports from Thailand and South Korea. With an eye on the future, Gujarat Fluorochemicals is spearheading an expansion, positioning India as a regional fluoropolymer nexus, thereby reducing dependence on Chinese suppliers, especially in light of their anticipated extended lead times through 2025–2026.
Geography Analysis
India's engineering plastics demand is heavily concentrated in Gujarat, Maharashtra, and Tamil Nadu. In Gujarat, the Dahej-Vadodara corridor integrates essential components such as paraxylene, PTA, PET, and fluoropolymer chains, with the added advantage of port access at Hazira and Mundra. Notably, resin exports from Gujarat benefit from significant freight savings over inland plants, highlighting the state's cost edge. Maharashtra's Pune-Aurangabad-Mumbai triangle, a hub for automotive and electronics assemblers, sees a robust demand for PA 66, polycarbonate, and ABS. In Tamil Nadu, a center for EV production, smartphone assembly, and tire manufacturing, there is a surge in demand for glass-fiber-reinforced polyamide, flame-retardant ABS, and high-clarity polycarbonate. Bengaluru, supported by Tata Electronics and prominent IT hardware suppliers, drives the demand for high-performance resins such as LCP. Meanwhile, in Hyderabad's Telangana corridor, fluoropolymers find their application in pharmaceutical equipment.
Regional policy incentives further accentuate these cost differentials. Gujarat's stamp-duty refunds and electricity tariffs help reduce resin cash costs. While Tamil Nadu offers capital subsidies, it grapples with intermittent power cuts, leading to unexpected downtime for extrusion and compounding lines. The electronics district in Noida-Greater Noida, close to Delhi's consumption base, faces challenges with organized waste-collection networks, making EPR compliance tricky for packaging producers. In Tier-2 hubs such as Indore, Jaipur, and Patna, where Smart Cities projects are boosting water and housing infrastructure, construction plastics, notably CPVC pipes and PMMA sheets, are in high demand. Export-driven polyester fiber and technical textiles flourish in the Surat-Vapi cluster of Gujarat and the Coimbatore-Tirupur cluster in Tamil Nadu, leveraging coastal shipping routes to Southeast Asia and the Gulf.
Competitive Landscape
The Indian Engineering Plastics Market is moderately consolidated. Strategic investments are increasingly favoring localization and backward integration. LANXESS has invested heavily in a new specialty-polyamide compounding unit, targeting the surging demand for high-voltage EV connectors in India's engineering plastics arena. Mitsubishi Chemical is optimizing its operations by collaborating with local firms for toll-production of polycarbonate and PBT, reducing import lead times from a lengthy ten weeks to a brisk four. Haldia Petrochemicals is making headlines with its announcement of a polycarbonate complex in West Bengal, signaling a strategic shift from commodities to engineering resins.
India Engineering Plastics Industry Leaders
Reliance Industries Ltd
APPL Industries Limited
Gujarat Fluorochemicals Limited (GFL)
DuPont
LANXESS
- *Disclaimer: Major Players sorted in no particular order

Recent Industry Developments
- March 2025: Haldia Petrochemicals Ltd., a petrochemical producer in India, unveiled its plan to set up a polycarbonate production facility in West Bengal, backed by an investment of USD 1 billion. By opting to use the available land at its current Haldia site, the company underscores its strategic move towards diversifying deeper into the downstream chemical sector.
- January 2024: Deepak Chem Tech Limited, a fully owned subsidiary of Deepak Nitrite Limited, signed a Memorandum of Understanding with the Gujarat government. The agreement outlines an investment of USD 1.1 billion to set up polycarbonate resins and compounds, methyl methacrylate, polymethyl methacrylate resins and compounds, and aniline production facilities in Dahej.


India Engineering Plastics Market Report Scope
Engineering plastics are high-performance thermoplastics, including PA, PC, PET, and ABS, characterized by superior mechanical, thermal, and chemical resistance compared to commodity plastics. These materials are widely used in demanding applications such as automotive (EV battery housings), electrical (connectors), construction (pipes), and industrial machinery, where structural, lightweight, and durable components are required.
The Indian engineering plastics market is segmented by end-user industry and resin type. By end-user industry, the market is segmented into automotive, electrical and electronics, building and construction, packaging, industrial and machinery, aerospace, and other end-user industries. By resin type, the market is segmented into fluoropolymers, liquid crystal polymer, polyamide, polybutylene terephthalate, polycarbonate, polyether ether ketone, polyethylene terephthalate, polyimide, polymethyl methacrylate, polyoxymethylene, and styrene copolymers (ABS and SAN). The report also covers the market size and forecasts for the market in 12 countries across major regions. For each segment, the market sizing and forecasts are done based on volume (Tons).
| Automotive |
| Electrical and Electronics |
| Building and Construction |
| Packaging |
| Industrial and Machinery |
| Aerospace |
| Other End-User Industries |
| Fluoropolymers | Ethylenetetrafluoroethylene (ETFE) |
| Fluorinated Ethylene-propylene (FEP) | |
| Polytetrafluoroethylene (PTFE) | |
| Polyvinylfluoride (PVF) | |
| Polyvinylidene Fluoride (PVDF) | |
| Other Sub Resin Types | |
| Liquid Crystal Polymer | |
| Polyamide | Aramid |
| Polyamide (PA) 6 | |
| Polyamide (PA) 66 | |
| Polyphthalamide | |
| Polybutylene Terephthalate | |
| Polycarbonate | |
| Polyether Ether Ketone | |
| Polyethylene Terephthalate | |
| Polyimide | |
| Polymethyl Methacrylate | |
| Polyoxymethylene | |
| Styrene Copolymers (ABS and SAN) |
| By End-User Industry | Automotive | |
| Electrical and Electronics | ||
| Building and Construction | ||
| Packaging | ||
| Industrial and Machinery | ||
| Aerospace | ||
| Other End-User Industries | ||
| By Resin Type | Fluoropolymers | Ethylenetetrafluoroethylene (ETFE) |
| Fluorinated Ethylene-propylene (FEP) | ||
| Polytetrafluoroethylene (PTFE) | ||
| Polyvinylfluoride (PVF) | ||
| Polyvinylidene Fluoride (PVDF) | ||
| Other Sub Resin Types | ||
| Liquid Crystal Polymer | ||
| Polyamide | Aramid | |
| Polyamide (PA) 6 | ||
| Polyamide (PA) 66 | ||
| Polyphthalamide | ||
| Polybutylene Terephthalate | ||
| Polycarbonate | ||
| Polyether Ether Ketone | ||
| Polyethylene Terephthalate | ||
| Polyimide | ||
| Polymethyl Methacrylate | ||
| Polyoxymethylene | ||
| Styrene Copolymers (ABS and SAN) | ||


Market Definition
- End-user Industry - Packaging, Electrical & Electronics, Automotive, Building & Construction, and Others are the end-user industries considered under the engineering plastics market.
- Resin - Under the scope of the study, consumption of virgin resins like Fluoropolymer, Polycarbonate, Polyethylene Terephthalate, Polybutylene Terephthalate, Polyoxymethylene, Polymethyl Methacrylate, Styrene Copolymers, Liquid Crystal Polymer, Polyether Ether Ketone, Polyimide, and Polyamide in the primary forms are considered. Recycling has been provided separately under its individual chapter.
| Keyword | Definition |
|---|---|
| Acetal | This is a rigid material that has a slippery surface. It can easily withstand wear and tear in abusive work environments. This polymer is used for building applications such as gears, bearings, valve components, etc. |
| Acrylic | This synthetic resin is a derivative of acrylic acid. It forms a smooth surface and is mainly used for various indoor applications. The material can also be used for outdoor applications with a special formulation. |
| Cast film | A cast film is made by depositing a layer of plastic onto a surface then solidifying and removing the film from that surface. The plastic layer can be in molten form, in a solution, or in dispersion. |
| Colorants & Pigments | Colorants & Pigments are additives used to change the color of the plastic. They can be a powder or a resin/color premix. |
| Composite material | A composite material is a material that is produced from two or more constituent materials. These constituent materials have dissimilar chemical or physical properties and are merged to create a material with properties unlike the individual elements. |
| Degree of Polymerization (DP) | The number of monomeric units in a macromolecule, polymer, or oligomer molecule is referred to as the degree of polymerization or DP. Plastics with useful physical properties often have DPs in the thousands. |
| Dispersion | To create a suspension or solution of material in another substance, fine, agglomerated solid particles of one substance are dispersed in a liquid or another substance to form a dispersion. |
| Fiberglass | Fiberglass-reinforced plastic is a material made up of glass fibers embedded in a resin matrix. These materials have high tensile and impact strength. Handrails and platforms are two examples of lightweight structural applications that use standard fiberglass. |
| Fiber-reinforced polymer (FRP) | Fiber-reinforced polymer is a composite material made of a polymer matrix reinforced with fibers. The fibers are usually glass, carbon, aramid, or basalt. |
| Flake | This is a dry, peeled-off piece, usually with an uneven surface, and is the base of cellulosic plastics. |
| Fluoropolymers | This is a fluorocarbon-based polymer with multiple carbon-fluorine bonds. It is characterized by high resistance to solvents, acids, and bases. These materials are tough yet easy to machine. Some of the popular fluoropolymers are PTFE, ETFE, PVDF, PVF, etc. |
| Kevlar | Kevlar is the commonly referred name for aramid fiber, which was initially a Dupont brand for aramid fiber. Any group of lightweight, heat-resistant, solid, synthetic, aromatic polyamide materials that are fashioned into fibers, filaments, or sheets is called aramid fiber. They are classified into Para-aramid and Meta-aramid. |
| Laminate | A structure or surface composed of sequential layers of material bonded under pressure and heat to build up to the desired shape and width. |
| Nylon | They are synthetic fiber-forming polyamides formed into yarns and monofilaments. These fibers possess excellent tensile strength, durability, and elasticity. They have high melting points and can resist chemicals and various liquids. |
| PET preform | A preform is an intermediate product that is subsequently blown into a polyethylene terephthalate (PET) bottle or a container. |
| Plastic compounding | Compounding consists of preparing plastic formulations by mixing and/or blending polymers and additives in a molten state to achieve the desired characteristics. These blends are automatically dosed with fixed setpoints usually through feeders/hoppers. |
| Plastic pellets | Plastic pellets, also known as pre-production pellets or nurdles, are the building blocks for nearly every product made of plastic. |
| Polymerization | It is a chemical reaction of several monomer molecules to form polymer chains that form stable covalent bonds. |
| Styrene Copolymers | A copolymer is a polymer derived from more than one species of monomer, and a styrene copolymer is a chain of polymers consisting of styrene and acrylate. |
| Thermoplastics | Thermoplastics are defined as polymers that become soft material when it is heated and becomes hard when it is cooled. Thermoplastics have wide-ranging properties and can be remolded and recycled without affecting their physical properties. |
| Virgin Plastic | It is a basic form of plastic that has never been used, processed, or developed. It may be considered more valuable than recycled or already used materials. |


Research Methodology
Mordor Intelligence follows a four-step methodology in all our reports.
- Step-1: Identify Key Variables: The quantifiable key variables (industry and extraneous) pertaining to the specific product segment and country are selected from a group of relevant variables & factors based on desk research & literature review; along with primary expert inputs. These variables are further confirmed through regression modeling (wherever required).
- Step-2: Build a Market Model: In order to build a robust forecasting methodology, the variables and factors identified in Step-1 are tested against available historical market numbers. Through an iterative process, the variables required for market forecast are set and the model is built on the basis of these variables.
- Step-3: Validate and Finalize: In this important step, all market numbers, variables and analyst calls are validated through an extensive network of primary research experts from the market studied. The respondents are selected across levels and functions to generate a holistic picture of the market studied.
- Step-4: Research Outputs: Syndicated Reports, Custom Consulting Assignments, Databases & Subscription Platforms


