Market Overview
| Study Period | 2017 - 2029 |
|---|---|
| Forecast Data Period | 2025 - 2029 |
| Historical Data Period | 2017 - 2023 |
| Market Size (2025) | USD 1.11 Billion |
| Market Size (2029) | USD 1.78 Billion |
| Growth Rate (2025 - 2029) | 12.56% CAGR |
| Market Concentration | Low |
Major Players*Disclaimer: Major Players sorted in no particular order Image © Mordor Intelligence. Reuse requires attribution under CC BY 4.0. | |

Japan E-bike Market Analysis by Mordor Intelligence
The Japan E-bike Market size is estimated at 1.11 billion USD in 2025, and is expected to reach 1.78 billion USD by 2029, growing at a CAGR of 12.56% during the forecast period (2025-2029).
Japan's e-bike market is experiencing significant transformation driven by evolving urban mobility needs and infrastructure development. The country's extensive road network, spanning over 1.28 million kilometers with numerous bridges and tunnels, provides an ideal foundation for Japan electric bicycle adoption. The integration of dedicated cycling infrastructure and the development of smart city initiatives have created a conducive environment for e-bike usage. Urban planners and municipalities are increasingly incorporating bicycle-friendly elements into city development plans, recognizing the role of e-bikes in sustainable transportation. The bicycle rental service market has shown remarkable growth, reaching USD 22.92 million in 2023, indicating strong consumer interest in alternative transportation options.
Technological advancements in battery systems are reshaping the market landscape, with lithium-ion batteries dominating the sector at an 89.65% market share in 2023. Manufacturers are focusing on developing more efficient and sustainable electric bicycle battery solutions, with an emphasis on longer range capabilities and faster charging times. The industry is witnessing significant investment in research and development, particularly in areas such as battery management systems and motor efficiency. Japanese e-bike manufacturers are leading innovations in compact battery design and integration, catering to the specific needs of urban commuters and recreational riders.
Consumer preferences are increasingly shifting towards city/urban e-bikes, which represent a significant portion of new bicycle sales. The market is seeing a notable trend towards pedal-assisted electric bicycles (pedelec), which account for approximately 12.2% of all new bicycle sales in Japan. These bikes are particularly popular in residential areas with varying topography, offering consumers an efficient solution for daily commuting and recreational activities. Manufacturers are responding to this demand by developing models that combine comfort, practicality, and advanced features while maintaining competitive price points.
The industry is characterized by continuous product innovation and development, with manufacturers focusing on lightweight designs, smart connectivity features, and improved user interfaces. Companies are investing in advanced manufacturing techniques and materials to enhance product durability and performance. The integration of IoT capabilities and smart features in newer models is becoming increasingly common, allowing for better user experience and maintenance tracking. Japanese e-bike manufacturers are particularly focused on developing compact, efficient designs that address the specific needs of urban environments while maintaining high safety and quality standards.
Japan E-bike Market Trends and Insights
Japan exhibits a consistent increase in E-Bike adoption rates, reflecting growing market penetration and consumer acceptance.
- The e-bike market in Japan is quickly becoming the most popular mode of transportation in urban areas. E-bikes are more agile and quicker than cars as they are extremely maneuverable and can readily dodge obstacles that cause a vehicle to slow down.
- In recent years, the number of e-bikes sold in Japan has increased, showing significant demand from a growing number of older people and working parents with young children. Older people were the major target demographic when electric power-assist bicycles were first introduced to the Japanese market. Motorized bicycles, such as pedelecs, are more convenient to commute. The elderly benefit from these bicycles as they allow them to exert less physical strength to navigate their everyday lives. However, in recent years, parents of preschool children have grown to rely on the convenience of e-bikes while dropping their children at daycare centers.
- Due to the resumption of business activities and the removal of trade restrictions imposed during lockdown, the adoption of e-bikes increased in Japan. Lifting trade regulations has benefited the country's import and export activities. Due to e-bikes features and benefits, such as fuel efficiency and time savings, their adoption rate is projected to increase in Japan in the future.


Japan maintains a high percentage of commuters traveling 5-15 km daily, indicating a strong preference for this travel distance.
- The bicycle culture is gaining popularity in the country. Over the years, bicycle demand in Japan has increased. The usage of bicycles for commuting to various places, such as schools, marketplaces, and job sites, is increasing in the country. In 2020, more people started using bicycles to travel a distance of 5-15 km for exercising and going to nearby places, such as markets or offices. Therefore, the demand for bicycles in Japan increased in 2020 compared to 2019.
- The restrictions and barriers imposed during the pandemic significantly and favorably affected the bicycle market in Japan. For short trips, more Japanese choose to walk or bike instead of using other automobiles. The availability of e-bikes with more sophisticated features and longer battery lives also encouraged individuals to choose bicycles for weekend activities and exercise, further boosting the number of commuters in Japan who traveled 5-15 km on bicycles in 2021 compared to 2020.
- Bicycle use for short trips became common as people habitually used bicycles to commute to nearby places. Currently, many individuals commute daily by bicycle, covering a distance of 5-15 km to local markets and workplaces. More people prefer to commute by bicycle due to the growing health benefits, carbon-free commuting, and saving time by avoiding traffic. These factors are anticipated to increase the number of people commuting a distance of 5-15 km in Japan during the forecast period.

OTHER KEY INDUSTRY TRENDS COVERED IN THE REPORT
- Japan's bicycle sales show a steady market with a slight downward trend, reflecting mature market conditions.
- Japan maintains low and stable inflation rates, demonstrating its strong economic structure and policy effectiveness.
- Japan's e-bike battery prices are steadily declining, indicating a mature market and technological innovation.
- Japan's consistent growth in dedicated bicycle lanes showcases the country's commitment to enhancing cycling infrastructure and promoting eco-friendly transportation.
- Japan shows a significant decrease in E-bike charging times, highlighting the country's advancement in fast-charging technology and efficient battery systems.
- Japan's GDP per capita indicates a stable economy with a focus on high-value industries and innovation.
- Japan's bicycle rental market is growing steadily, reflecting a consistent demand and a stable market environment.
- Japan's hyper-local delivery sector is expanding, reflecting a strong consumer shift towards convenience and localized online services.
- Japan shows a steady increase in trekker numbers, indicating sustained interest in its natural beauty and well-established trekking trails.
- Japan's Traffic Congestion Index is decreasing, suggesting effective congestion management strategies and possibly a shift in transportation habits.
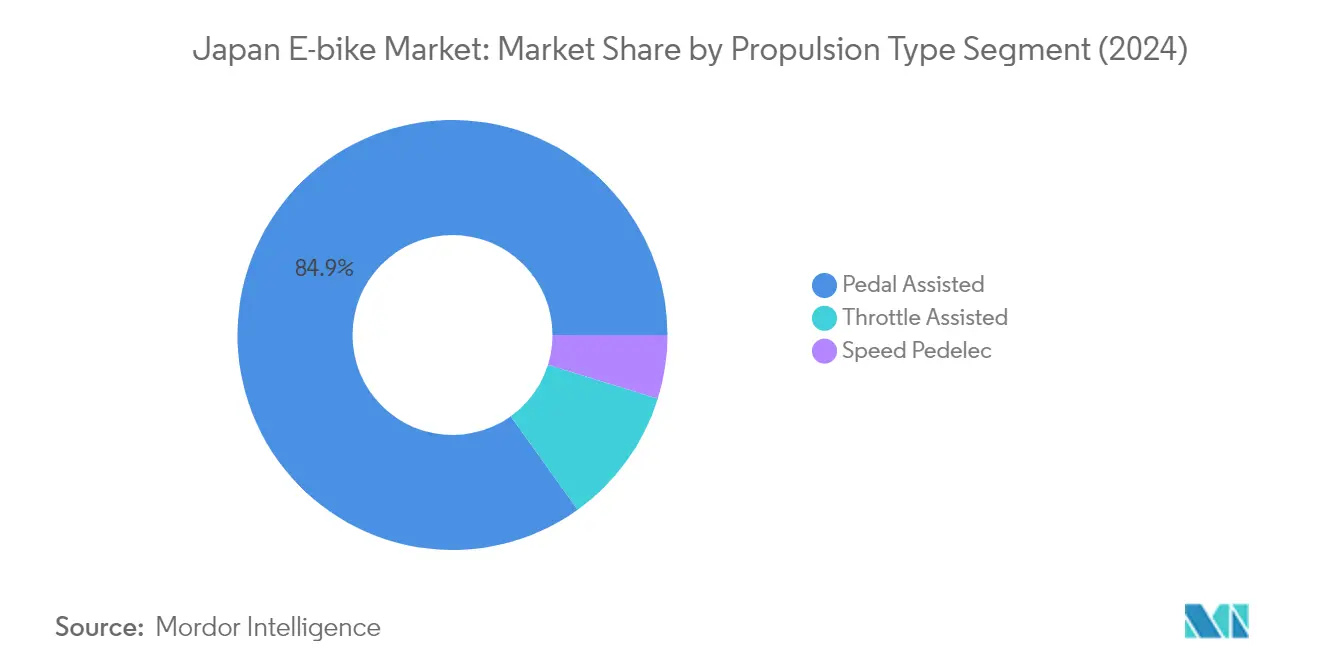
Segment Analysis: Propulsion Type
Pedal Assisted Segment in Japan E-bike Market
The pedal assist bicycle segment dominates the Japan e-bike market, commanding approximately 85% market share in 2024. This significant market position is driven by the segment's strong appeal among urban residents, particularly in neighborhoods with numerous slopes where pedal assistance provides crucial support for daily commuting. The segment's popularity is further enhanced by Japan's favorable regulatory environment, which classifies pedal-assisted e-bikes as regular bicycles under traffic laws, making them more accessible to consumers. These e-bikes typically retail between JPY 70,000 and JPY 150,000, positioning them as an attractive option for various consumer segments, from elderly users seeking mobility support to working professionals looking for efficient urban transportation solutions.

Speed Pedelec Segment in Japan E-bike Market
The speed pedelec segment is emerging as the most dynamic segment in the Japanese e-bike market, projected to grow at approximately 17% during 2024-2029. This remarkable growth trajectory is driven by increasing consumer demand for faster mobility solutions in congested urban areas, particularly among commuters seeking efficient alternatives to traditional transportation. The segment's expansion is supported by technological advancements in motor and battery efficiency, enabling these e-bikes to deliver enhanced performance while maintaining safety standards. The growing preference for speed pedelecs among younger, tech-savvy consumers and urban professionals who value both speed and sustainability is expected to further accelerate this segment's growth in the coming years.
Remaining Segments in Propulsion Type
The throttle-assisted segment represents a significant portion of the Japanese e-bike market, offering unique advantages for specific user groups. These e-bikes, which provide power on demand without requiring pedaling, are particularly popular among delivery services and users who need consistent power output regardless of terrain or physical condition. Despite requiring additional regulatory compliance, including registration and licensing requirements, throttle-assisted e-bikes continue to maintain a steady presence in the market, particularly in commercial and specialized applications where their unique capabilities provide distinct advantages over other propulsion types.
Segment Analysis: Application Type
City/Urban Segment in Japan E-bike Market
The electric city bike segment dominates the Japan e-bike market, commanding approximately 78% market share in 2024. This significant market position is driven by the widespread adoption of e-bikes in Japan's densely populated urban areas, where they serve as an efficient solution for daily commuting and local transportation needs. The segment's prominence is particularly notable among elderly citizens, homemakers, and students who frequently use city e-bikes, locally known as "Mamachari," for their daily mobility needs. The segment's success is further bolstered by Japan's well-developed urban infrastructure, including dedicated cycling lanes and parking facilities, making e-bikes an attractive transportation option for city dwellers. Additionally, the segment benefits from the increasing focus on sustainable urban mobility solutions and the growing preference among working professionals for convenient, eco-friendly transportation alternatives.
Cargo/Utility Segment in Japan E-bike Market
The electric cargo bike segment is emerging as the fastest-growing category in Japan's e-bike market, driven by the rapid expansion of last-mile delivery services and the growing e-commerce sector. This segment is experiencing robust growth, projected to maintain a strong trajectory between 2024 and 2029. The growth is primarily fueled by increasing adoption among logistics companies and restaurants for delivery services, as these vehicles offer an efficient and cost-effective solution for urban deliveries. The segment's expansion is further supported by the rising environmental consciousness among businesses and the need for sustainable delivery solutions in congested urban areas. Additionally, the development of more sophisticated cargo e-bike models with enhanced carrying capacity and battery performance is attracting more commercial users, particularly in the hyperlocal delivery sector.
Remaining Segments in Application Type
The Trekking segment represents a significant niche in Japan's e-bike market, catering to recreational cyclists and adventure enthusiasts. This segment has gained traction due to Japan's diverse terrain and extensive network of cycling trails, making it particularly attractive for both domestic and international cycling tourists. The segment benefits from Japan's mountainous landscape, with over 70% of the country being mountainous and densely forested, providing ideal conditions for trekking e-bikes. The segment's growth is supported by increasing interest in outdoor activities and adventure tourism, with manufacturers developing specialized e-bikes equipped with features specifically designed for challenging terrain and long-distance riding.
Segment Analysis: Battery Type
Lithium-ion Battery Segment in Japan E-bike Market
The battery powered bicycle segment dominates the Japan e-bike market, commanding approximately 90% market share in 2024, primarily due to its superior performance characteristics and declining costs. These batteries are widely preferred for their high energy density, longer lifespan, and lighter weight compared to alternative options. The segment's dominance is further strengthened by continuous technological advancements in battery chemistry and manufacturing processes, which have led to improved efficiency and reduced production costs. Japanese manufacturers have particularly focused on developing more sustainable and long-lasting lithium-ion batteries, with many small and medium-sized battery manufacturers establishing production facilities to meet the growing demand. The increasing adoption of lithium-ion batteries in e-bikes is also driven by their ability to provide greater range, improved speed capabilities, and enhanced overall performance, making them the preferred choice for both manufacturers and consumers in the Japanese market.
Lithium-ion Battery Segment Growth in Japan E-bike Market
The lithium-ion battery segment is projected to maintain its strong growth trajectory from 2024 to 2029, driven by continuous innovations in battery technology and manufacturing processes. The segment's expansion is supported by increasing investments in research and development, focusing on improving battery efficiency, reducing charging times, and extending battery life. Japanese manufacturers are particularly focusing on developing next-generation lithium-ion batteries with enhanced safety features and improved performance characteristics. The growth is further accelerated by the rising consumer preference for eco-friendly transportation solutions and the government's push towards sustainable mobility options. Additionally, the expected reduction in battery production costs, coupled with improvements in energy density and charging capabilities, is anticipated to make lithium-ion battery-powered e-bikes more accessible to a broader consumer base during the forecast period.
Remaining Segments in Battery Type
The lead-acid battery and other battery segments continue to maintain their presence in the Japanese e-bike market, albeit with diminishing market shares. Lead-acid batteries, despite their cost advantage, face challenges due to their heavier weight and shorter lifespan compared to lithium-ion alternatives. The 'others' category, which includes emerging battery technologies and experimental power sources, represents a small but innovative segment of the market. These alternative battery technologies are particularly important for specific niche applications and continue to undergo development for potential future applications. While these segments may face challenges in competing with lithium-ion batteries, they remain relevant for specific use cases and price-sensitive market segments, contributing to the overall diversity of battery options available in the Japanese e-bike market.
Competitive Landscape
Top Companies in Japan E-bike Market
The Japanese e-bike market is characterized by intense innovation and strategic development among key players like Panasonic, Yamaha, Shimano, and Trek Bicycle Corporation. Companies are heavily focusing on technological advancements in battery technology, motor efficiency, and smart connectivity features to differentiate their offerings. Operational agility is demonstrated through flexible manufacturing processes and robust supply chain management, allowing companies to adapt quickly to changing market demands. Strategic moves in the industry primarily revolve around forming strategic partnerships for technology development, particularly in areas like battery swapping systems and electric drivetrain solutions. Market expansion strategies include the development of specialized retail networks, enhancement of after-sales service capabilities, and investment in digital sales channels to improve customer reach and experience.
Local Players Dominate Japanese E-bike Market
The Japanese e-bike market exhibits a strong presence of domestic manufacturers and established local brands, with companies like Panasonic and Yamaha leveraging their deep understanding of local consumer preferences and extensive distribution networks. These domestic players benefit from their established reputation in the electronics and automotive sectors, allowing them to transfer technological expertise to e-bike manufacturing. The market shows moderate consolidation, with the top players holding significant market share while smaller specialized manufacturers cater to specific market segments like urban commuting or cargo delivery.
The market is witnessing increasing collaboration between traditional bicycle manufacturers and technology companies, particularly in developing advanced battery systems and electric drivetrains. Japanese conglomerates are leveraging their diverse business portfolios to create synergies across their automotive, electronics, and mobility divisions. Market entry barriers remain high due to the need for sophisticated technology, established distribution networks, and compliance with strict quality and safety standards, leading to strategic partnerships and joint ventures rather than outright acquisitions.
Innovation and Localization Key to Success
Success in the Japanese e-bike market increasingly depends on companies' ability to innovate while maintaining strong local market understanding. Manufacturers must focus on developing products that specifically cater to Japanese urban infrastructure and consumer preferences, including compact designs for limited parking spaces and features suitable for various age groups. Companies need to invest in research and development to improve battery life, charging efficiency, and overall product durability while maintaining competitive pricing strategies. Building strong relationships with local dealers and service networks remains crucial for market penetration and customer retention.
Future market success will require companies to address growing environmental concerns and changing urban mobility patterns. Manufacturers must navigate potential regulatory changes regarding battery disposal, product safety standards, and urban mobility regulations. Companies need to develop comprehensive service ecosystems, including maintenance networks, battery recycling programs, and mobile applications for enhanced user experience. The ability to offer flexible ownership models, including leasing and sharing services, will become increasingly important as consumer preferences evolve and urban mobility solutions diversify. Notably, the focus on electric bike battery technology is crucial for addressing these challenges.
Japan E-bike Industry Leaders
Asahi Cycle Co. Ltd
Panasonic Cycle Technology Co. Ltd
Shimano Inc.
Trek Bicycle Corporation
Yamaha Bicycles
- *Disclaimer: Major Players sorted in no particular order


Recent Industry Developments
- July 2022: Kawasaki debuted the Elektrode bicycle in the market. It has three adjustable speed modes, a disc brake, an integrated battery, and a motor located on the wheel. The list price is USD 1,099.
- June 2022: Yamaha introduced a new mid-drive electric bike motor with increased power in a smaller package.
- April 2022: Kawasaki and Eneos agreed to collaborate on a platform with swappable batteries. As a part of the agreement, Eneos intends to work on the "BaaS" (Battery as a Service) platform for electric transportation and other battery recycling solutions.


Japan E-bike Market Report Scope
Pedal Assisted, Speed Pedelec, Throttle Assisted are covered as segments by Propulsion Type. Cargo/Utility, City/Urban, Trekking are covered as segments by Application Type. Lead Acid Battery, Lithium-ion Battery, Others are covered as segments by Battery Type.Propulsion Type
| Pedal Assisted |
| Speed Pedelec |
| Throttle Assisted |
Application Type
| Cargo/Utility |
| City/Urban |
| Trekking |
Battery Type
| Lead Acid Battery |
| Lithium-ion Battery |
| Others |
| Propulsion Type | Pedal Assisted |
| Speed Pedelec | |
| Throttle Assisted | |
| Application Type | Cargo/Utility |
| City/Urban | |
| Trekking | |
| Battery Type | Lead Acid Battery |
| Lithium-ion Battery | |
| Others |


Market Definition
- By Application Type - E-bikes considered under this segment include city/urban, trekking, and cargo/utility e-bikes. The common types of e-bikes under these three categories include off-road/hybrid, kids, ladies/gents, cross, MTB, folding, fat tire, and sports e-bike.
- By Battery Type - This segment includes lithium-ion batteries, lead-acid batteries, and other battery types. The other battery type category includes nickel-metal hydroxide (NiMH), silicon, and lithium-polymer batteries.
- By Propulsion Type - E-bikes considered under this segment include pedal-assisted e-bikes, throttle-assisted e-bikes, and speed pedelec. While the speed limit of pedal and throttle-assisted e-bikes is usually 25 km/h, the speed limit of speed pedelec is generally 45 km/h (28 mph).
| Keyword | Definition |
|---|---|
| Pedal Assisted | Pedal-assist or pedelec category refers to the electric bikes that provide limited power assistance through torque-assist system and do not have throttle for varying the speed. The power from the motor gets activated upon pedaling in these bikes and reduces human efforts. |
| Throttle Assisted | Throttle-based e-bikes are equipped with the throttle assistance grip, installed on the handlebar, similarly to motorbikes. The speed can be controlled by twisting the throttle directly without the need to pedal. The throttle response directly provides power to the motor installed in the bicycles and speeds up the vehicle without paddling. |
| Speed Pedelec | Speed pedelec is e-bikes similar to pedal-assist e-bikes as they do not have throttle functionality. However, these e-bikes are integrated with an electric motor which delivers power of approximately 500 W and more. The speed limit of such e-bikes is generally 45 km/h (28 mph) in most of the countries. |
| City/Urban | The city or urban e-bikes are designed with daily commuting standards and functions to be operated within the city and urban areas. The bicycles include various features and specifications such as comfortable seats, sit upright riding posture, tires for easy grip and comfortable ride, etc. |
| Trekking | Trekking and mountain bikes are special types of e-bikes that are designed for special purposes considering the robust and rough usage of the vehicles. These bicycles include a strong frame, and wide tires for better and advanced grip and are also equipped with various gear mechanisms which can be used while riding in different terrains, rough grounded, and tough mountainous roads. |
| Cargo/Utility | The e-cargo or utility e-bikes are designed to carry various types of cargo and packages for shorter distances such as within urban areas. These bikes are usually owned by local businesses and delivery partners to deliver packages and parcels at very low operational costs. |
| Lithium-ion Battery | A Li-ion battery is a rechargeable battery, which uses lithium and carbon as its constituent materials. The Li-Ion batteries have a higher density and lesser weight than sealed lead acid batteries and provide the rider with more range per charge than other types of batteries. |
| Lead Acid Battery | A lead acid battery refers to sealed lead acid battery having a very low energy-to-weight and energy-to-volume ratio. The battery can produce high surge currents, owing to its relatively high power-to-weight ratio as compared to other rechargeable batteries. |
| Other Batteries | This includes electric bikes using nickel–metal hydroxide (NiMH), silicon, and lithium-polymer batteries. |
| Business-to-Business (B2B) | The sales of e-bikes to business customers such as urban fleet and logistics company, rental/sharing operators, last-mile fleet operators, and corporate fleet operators are considered under this category. |
| Business-to-Customers (B2C) | The sales of electric scooters and motorcycles to direct consumers is considered under this category. The consumers acquire these vehicles either directly from manufacturers or from other distributers and dealers through online and offline channel. |
| Unorganized Local OEMs | These players are small local manufacturers and assemblers of e-bikes. Most of these manufacturers import the components from China and Taiwan and assemble them locally. They offer the product at low cost in this price sensitive market which give them advantage over organized manufacturers. |
| Battery-as-a-Service | A business model in which the battery of an EV can be rented from a service provider or swapped with another battery when it runs out of charge |
| Dockless e-Bikes | Electric bikes that have self-locking mechanisms and a GPS tracking facility with an average top speed of around 15mph. These are mainly used by bike-sharing companies such as Bird, Lime, and Spin. |
| Electric Vehicle | A vehicle which uses one or more electric motors for propulsion. Includes cars, scooters, buses, trucks, motorcycles, and boats. This term includes all-electric vehicles and hybrid electric vehicles |
| Plug-in EV | An electric vehicle that can be externally charged and generally includes all-electric vehicles as well as plug-in hybrids. In this report we use the term for all-electric vehicles to differentiate them from plug-in hybrid electric vehicles. |
| Lithium-Sulphur Battery | A rechargeable battery that replaces the liquid or polymer electrolyte found in current lithium-ion batteries with sulfur. They have more capacity than Li-ion batteries. |
| Micromobility | Micromobility is one of the many modes of transport involving very-light-duty vehicles to travel short distances. These means of transportation include bikes, e-scooters, e-bikes, mopeds, and scooters. Such vehicles are used on a sharing basis for covering short distances, usually five miles or less. |
| Low Speed Electric Vehicls (LSEVs) | They are low speed (usually less than 25 kmph) light vehicles that do not have an internal combustion engine, and solely use electric energy for propulsion. |


Research Methodology
Mordor Intelligence follows a four-step methodology in all its reports.
- Step-1: Identify Key Variables: To build a robust forecasting methodology, the variables and factors identified in Step-1 are tested against available historical market numbers. Through an iterative process, the variables required for market forecast are set and the model is built based on these variables.
- Step-2: Build a Market Model: Market-size estimations for the historical and forecast years have been provided in revenue and volume terms. Market revenue is calculated by multiplying the volume demand with volume-weighted average battery pack price (per kWh). Battery pack price estimation and forecast takes into account various factors affecting ASP, such as inflation rates, market demand shifts, production costs, technological developments, and consumer preferences, providing estimations for both historical data and future trends.
- Step-3: Validate and Finalize: In this important step, all market numbers, variables, and analyst calls are validated through an extensive network of primary research experts from the market studied. The respondents are selected across levels and functions to generate a holistic picture of the market studied.
- Step-4: Research Outputs: Syndicated Reports, Custom Consulting Assignments, Databases & Subscription Platforms


